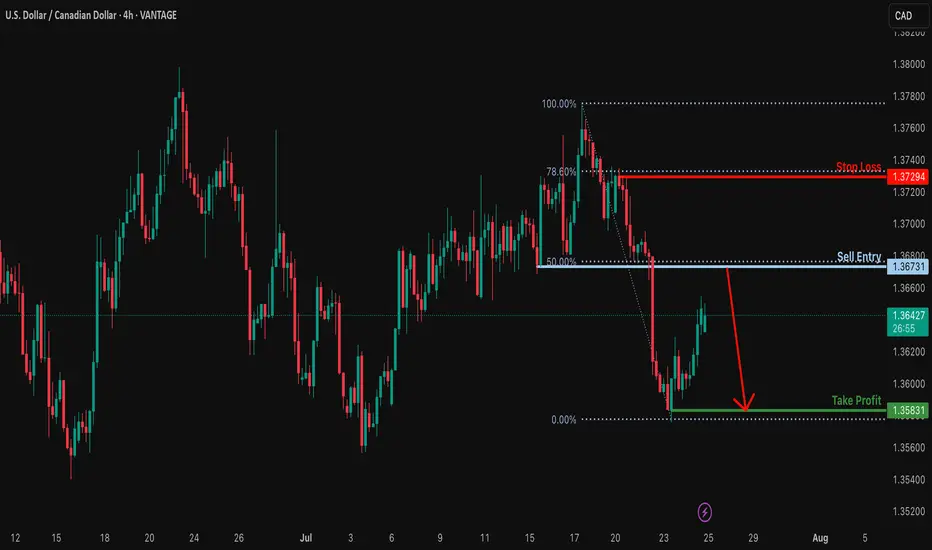
Heading into 50% Fibonacci resistance?USD/CAD is rising towards the resistance level, which serves as a pullback resistance that aligns with the 50% Fibonacci retracement and could reverse from this level to our take-profit target.
Entry: 1.3673
Why we like it:
There is a pullback resistance that lines up with the 50% Fibonacci retracement.
Stop loss: 1.3729
Why we like it:
There is a pullback resistance that lines up with the 78.6% Fibonacci retracement.
Take profit: 1.3583
Why we like it:
There is a swing low support.
Enjoying your TradingView experience? Review us!
Please be advised that the information presented on TradingView is provided to Vantage (‘Vantage Global Limited’, ‘we’) by a third-party provider (‘Everest Fortune Group’). Please be reminded that you are solely responsible for the trading decisions on your account. There is a very high degree of risk involved in trading. Any information and/or content is intended entirely for research, educational and informational purposes only and does not constitute investment or consultation advice or investment strategy. The information is not tailored to the investment needs of any specific person and therefore does not involve a consideration of any of the investment objectives, financial situation or needs of any viewer that may receive it. Kindly also note that past performance is not a reliable indicator of future results. Actual results may differ materially from those anticipated in forward-looking or past performance statements. We assume no liability as to the accuracy or completeness of any of the information and/or content provided herein and the Company cannot be held responsible for any omission, mistake nor for any loss or damage including without limitation to any loss of profit which may arise from reliance on any information supplied by Everest Fortune Group.
Forexsignals
Bullish bounce for the Cable?The price is falling towards the suoprt level which is an overlap support that is slightly above the 61.8% Fibonacci retracement and could bounce from this level to our take profit.
Entry: 1.3468
Why we like it:
There is an overlap support that is slightly above the 61.8% Fibonacci retracement.
Stop loss: 1.3377
Why we like it:
There is a swing low support.
Take profit: 1.3577
Why we like it:
There is a pullback resistance.
Enjoying your TradingView experience? Review us!
Please be advised that the information presented on TradingView is provided to Vantage (‘Vantage Global Limited’, ‘we’) by a third-party provider (‘Everest Fortune Group’). Please be reminded that you are solely responsible for the trading decisions on your account. There is a very high degree of risk involved in trading. Any information and/or content is intended entirely for research, educational and informational purposes only and does not constitute investment or consultation advice or investment strategy. The information is not tailored to the investment needs of any specific person and therefore does not involve a consideration of any of the investment objectives, financial situation or needs of any viewer that may receive it. Kindly also note that past performance is not a reliable indicator of future results. Actual results may differ materially from those anticipated in forward-looking or past performance statements. We assume no liability as to the accuracy or completeness of any of the information and/or content provided herein and the Company cannot be held responsible for any omission, mistake nor for any loss or damage including without limitation to any loss of profit which may arise from reliance on any information supplied by Everest Fortune Group.

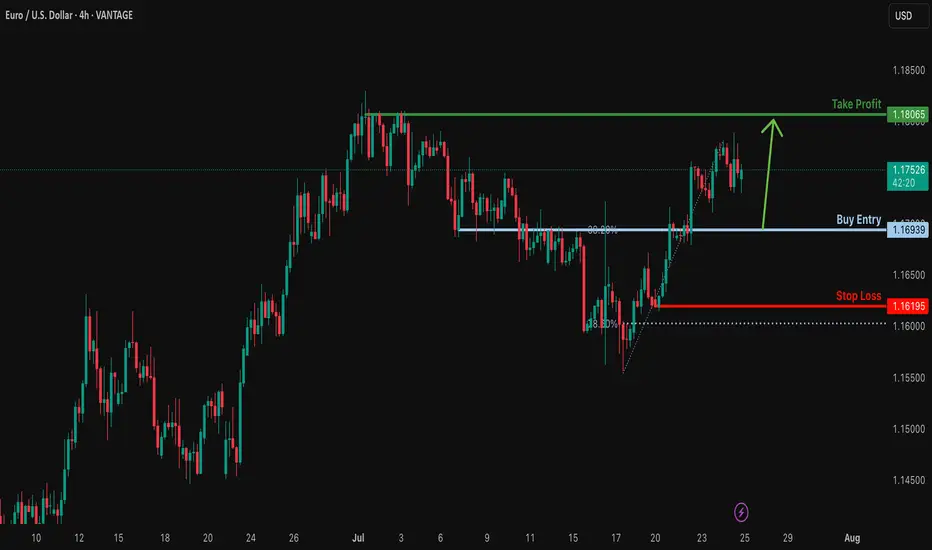
Bullish bounce off overlap support?EUR/USD is falling towards the support level, which is an overlap support that aligns with the 38.2% Fibonacci retracement and could bounce from this level to our take profit.
Entry: 1.1693
Why we like it:
There is an overlap support that lines up with the 38.2% Fibonacci retracement.
Stop loss: 1.1619
Why we like it:
There is a pullback support that is slightly above the 78.6% Fibonacci retracement.
Take profit: 1.1806
Why we like it:
There is a swing high resistance.
Enjoying your TradingView experience? Review us!
Please be advised that the information presented on TradingView is provided to Vantage (‘Vantage Global Limited’, ‘we’) by a third-party provider (‘Everest Fortune Group’). Please be reminded that you are solely responsible for the trading decisions on your account. There is a very high degree of risk involved in trading. Any information and/or content is intended entirely for research, educational and informational purposes only and does not constitute investment or consultation advice or investment strategy. The information is not tailored to the investment needs of any specific person and therefore does not involve a consideration of any of the investment objectives, financial situation or needs of any viewer that may receive it. Kindly also note that past performance is not a reliable indicator of future results. Actual results may differ materially from those anticipated in forward-looking or past performance statements. We assume no liability as to the accuracy or completeness of any of the information and/or content provided herein and the Company cannot be held responsible for any omission, mistake nor for any loss or damage including without limitation to any loss of profit which may arise from reliance on any information supplied by Everest Fortune Group.
Correction in Play, Long-Term BUY Opportunity Ahead XAUUSD 24/07 – Correction in Play, Long-Term BUY Opportunity Ahead
🧭 Market Outlook
Gold has dropped sharply from the 343x region, exactly as outlined in yesterday’s plan. Price has broken below the ascending trendline on the H1 chart and is now tapping into lower liquidity zones (FVG + OBS), signaling continuation of the short-term bearish move.
Key context to watch:
Traders are awaiting final decisions on US global trade policy agreements.
Next week’s FOMC meeting may confirm expectations of an interest rate cut.
Later today, markets will react to US PMI data and Jobless Claims, which could trigger volatility.
📊 Technical View
While the higher timeframe trend (D1/H4) remains bullish, the short-term structure has broken, and the market is now exploring unfilled liquidity pools below. Once these are swept, we anticipate a strong long-term BUY opportunity.
🎯 Trading Plan for Today
📌 Short-Term Strategy:
Look for short-term SELL setups on retracements toward resistance zones. Wait for clear rejection signals before entering.
📌 Mid/Long-Term Strategy:
Prepare to BUY from major Key Levels once price taps into deep liquidity zones. Ensure confluence and good risk/reward before entering.
🔎 Key Levels to Watch
🔺 Upper Resistance Zones:
3393 – 3404 – 3414 – 3420 – 3428
🔻 Lower Support Zones:
3375 – 3366 – 3352 – 3345 – 3330
🔽 Trade Setups
✅ BUY ZONE: 3352 – 3350
SL: 3345
TP: 3356 → 3360 → 3364 → 3370 → 3375 → 3380 → 3390 → 3400
🔻 SELL ZONE: 3414 – 3416
SL: 3420
TP: 3410 → 3406 → 3400 → 3395 → 3390 → 3380
⚠️ Risk Reminder
No major economic news is scheduled for today, but unexpected political statements or geopolitical tensions could cause price spikes.
✔️ Always follow your SL/TP strictly.
✔️ Avoid entering without solid confirmation.
✔️ Watch how price reacts to the levels above.
📣 Follow MMF on TradingView
If this trading roadmap helps your strategy,
📌 Follow the MMF team on TradingView for daily actionable setups, real levels, and no-nonsense analysis based on real market conditions.
🎯 Real trades. Real zones. Real discipline.

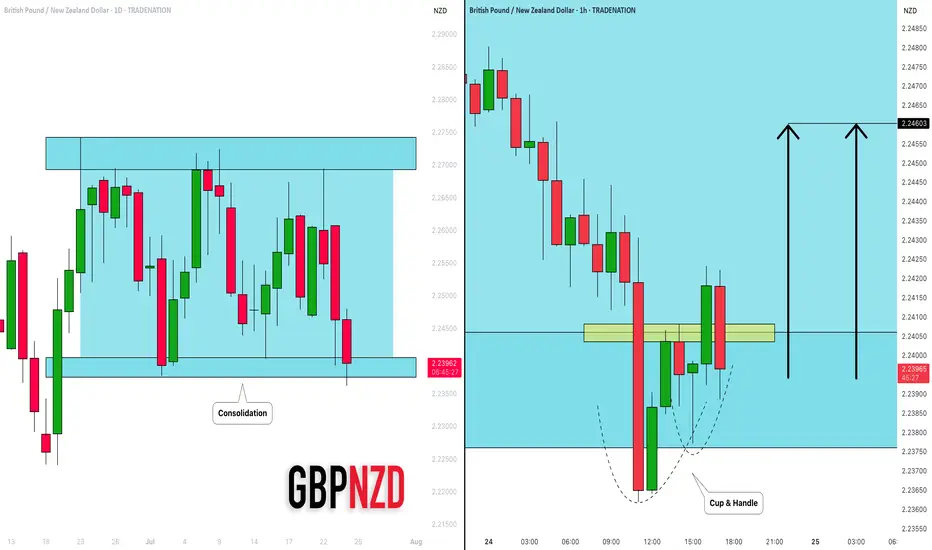
GBPNZD: Bullish Move in a Channel 🇬🇧🇳🇿
I see a horizontal parallel channel on GBPNZD on a daily.
The price is currently testing its support.
On an hourly time frame, a cup & handle pattern was formed on that.
Its neckline was violated with the today's high impact news.
I think that the price may bounce at least to 2.246 level.
❤️Please, support my work with like, thank you!❤️
I am part of Trade Nation's Influencer program and receive a monthly fee for using their TradingView charts in my analysis.
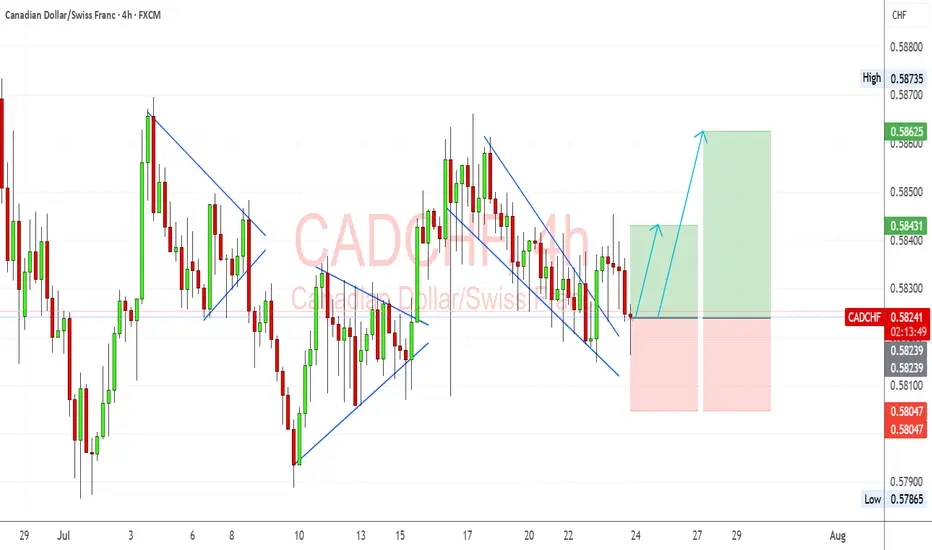
CADCHF Bullish Reversal in Motion Channel Break & Momentum ShiftCADCHF setup is developing into a potential bullish recovery after a breakout from a falling wedge. I’m looking for signs of buyer control as price attempts to build higher structure off the recent breakout.
📊 Technical View (My Setup Insight):
Falling Wedge Breakout: Price has cleanly broken out of the descending channel/wedge formation. That’s often a reversal signal, especially near support zones.
Support Holding: The pair found buyers around 0.5810–0.5820, an area tested multiple times in July. This zone has acted as a soft base.
Bullish Flag Recovery: Prior corrective patterns (flags/pennants) were followed by strong impulsive moves, and we may be repeating this pattern now.
Next Targets:
TP1: 0.5843 – aligns with previous structure and minor resistance.
TP2: 0.5862 – near the most recent high and top of consolidation.
Stop-Loss: Below 0.5800 to invalidate the reversal structure.
🧮 Fundamental Drivers (My Outlook):
CAD Support from Oil Stability: Oil prices have firmed around $78–$80, which helps the CAD via improved trade and energy revenue prospects.
SNB Stance Neutral-Dovish: Swiss inflation remains soft, and SNB has signaled comfort with its current policy rate, reducing CHF bullish pressure.
BoC Hawkish Bias: Despite softening Canadian CPI, the BoC remains cautious and hasn’t ruled out future hikes. CAD remains supported relative to CHF.
Global Risk Mood: CHF is sensitive to risk-off flows. With equities and commodities rebounding modestly, safe haven flows into CHF may slow.
⚠️ Risks to the Setup:
A sudden drop in oil prices could hurt CAD.
Risk-off sentiment due to geopolitical tensions or US equity selloffs could fuel CHF strength.
Any surprise SNB jawboning about FX could cause CHF to spike.
📆 Upcoming Events to Monitor:
Canadian GDP / Retail Sales – if strong, reinforces CAD recovery.
Swiss KOF Economic Barometer – gives insight into CHF macro tone.
Oil Inventories – strong builds or drawdowns influence CAD indirectly.
🔁 Leader/Lagger Context:
CADCHF is often a lagger, especially when risk sentiment or oil makes bigger moves. It can follow USDCHF or USDCAD behavior due to shared components.
If oil or global risk sentiment shifts, CADCHF tends to react with a small lag, making it great for secondary confirmation trades.
🧩 Summary – Bias & Watchpoints:
I currently hold a bullish bias on CADCHF following the falling wedge breakout and support defense. Fundamentals are moderately in favor of CAD due to oil stability and BoC’s cautious stance versus the more passive SNB. Key risks include any renewed CHF demand from risk-off shifts or soft Canadian economic surprises. The most critical levels now lie at 0.5843 and 0.5862 for upside targets, while 0.5800 remains key invalidation support.
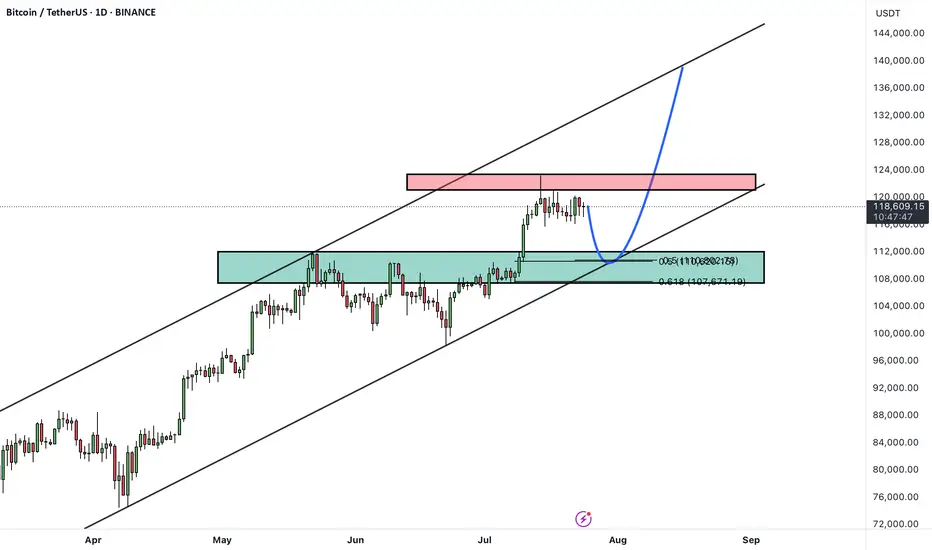
BTCUSDTHello Traders! 👋
What are your thoughts on BITCOIN?
After setting a new all-time high, Bitcoin remains in a corrective phase, marked by sideways price action and choppy movements.
There's a notable gap around the $114,000 level, which may act as a magnet for price during this correction.
The ongoing pullback is likely to extend toward the key support zone, which aligns with the previous breakout level and the bottom of the ascending channel.
Once this support holds, we could see a bullish reversal, targeting the upper boundary of the channel once again.
As long as Bitcoin remains above the marked support zone, the overall structure stays bullish and this correction may present a buy-the-dip opportunity.
Will Bitcoin fill the gap and bounce back toward new highs? Let us know your thoughts! 🤔👇
Don’t forget to like and share your thoughts in the comments! ❤️
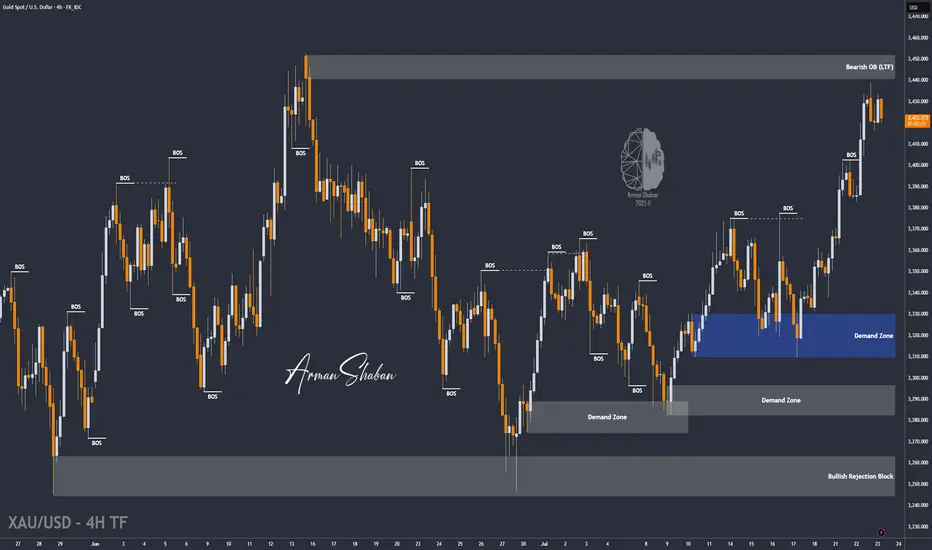
XAU/USD | Watching for Potential Drop Toward $3391! (READ)By analyzing the gold chart on the 4-hour timeframe, we can see that gold continued its bullish move after holding above $3409, successfully hitting the $3440 target and delivering over 200 pips in returns! After reaching this key supply zone, gold corrected down to $3415 and is now trading around $3421. If the price stabilizes below $3431, we can expect further downside movement, with the next bearish targets at $3415, $3404, and $3391. If this scenario fails, an alternative setup will be shared.
Please support me with your likes and comments to motivate me to share more analysis with you and share your opinion about the possible trend of this chart with me !
Best Regards , Arman Shaban
Here’s a fresh Nasdaq100 analysis I’ve put together for you.Hey Guys,
Here’s a fresh Nasdaq100 analysis I’ve put together for you.
I’ve marked the buy zone between 23,252 and 23,240. If price dips into that range, I’m anticipating a potential move upward toward 23,294.
Your likes and support are my biggest source of motivation to keep sharing these insights.
Huge thanks to everyone backing me with a thumbs-up!

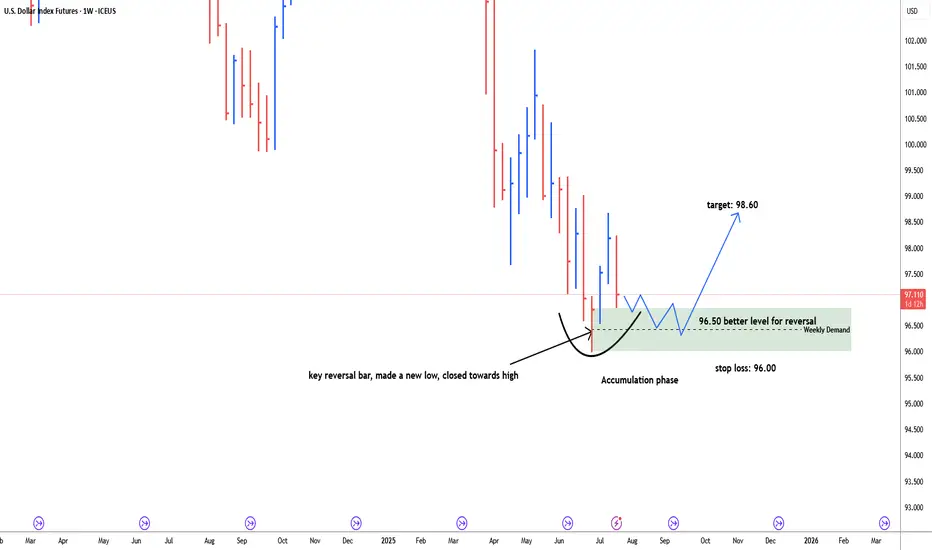
USD Dollar index possbile bullish reversal#usddollarindex, last weekly bar of the month of June is key reversal bar, made a new low and closed towards high. price retracing back down to test weekly demand zone. discount zone of demand is 96.50. possible bullish reversal target: 98.60. Stop loss below 96.00. price need time to build energy for bullish momentum. 96.50-96.00 is more secure level for long.
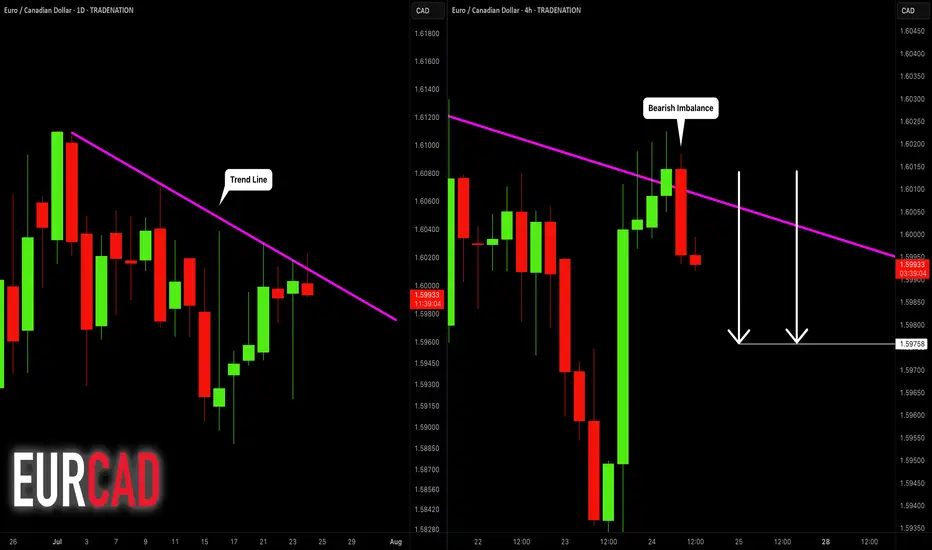
EURCAD: Bearish After the News 🇪🇺🇨🇦
EURCAD may drop from a solid daily resistance.
As a confirmation signal, I spotted a bearish engulfing candle
on a 4H time frame after its test.
The formation of this candle is accompanied by multiple negative
German fundamentals.
Goal - 1.5976
❤️Please, support my work with like, thank you!❤️
I am part of Trade Nation's Influencer program and receive a monthly fee for using their TradingView charts in my analysis.
Bullish bounce for the Kiwi?The price is falling towards the pivot, which has been identified as an overlap support and could bounce to the 1st resistance, which acts as a pullback resistance.
Pivot: 0.6038
1st Support: 0.5999
1st Resistance: 0.6079
Risk Warning:
Trading Forex and CFDs carries a high level of risk to your capital and you should only trade with money you can afford to lose. Trading Forex and CFDs may not be suitable for all investors, so please ensure that you fully understand the risks involved and seek independent advice if necessary.
Disclaimer:
The above opinions given constitute general market commentary, and do not constitute the opinion or advice of IC Markets or any form of personal or investment advice.
Any opinions, news, research, analyses, prices, other information, or links to third-party sites contained on this website are provided on an "as-is" basis, are intended only to be informative, is not an advice nor a recommendation, nor research, or a record of our trading prices, or an offer of, or solicitation for a transaction in any financial instrument and thus should not be treated as such. The information provided does not involve any specific investment objectives, financial situation and needs of any specific person who may receive it. Please be aware, that past performance is not a reliable indicator of future performance and/or results. Past Performance or Forward-looking scenarios based upon the reasonable beliefs of the third-party provider are not a guarantee of future performance. Actual results may differ materially from those anticipated in forward-looking or past performance statements. IC Markets makes no representation or warranty and assumes no liability as to the accuracy or completeness of the information provided, nor any loss arising from any investment based on a recommendation, forecast or any information supplied by any third-party.

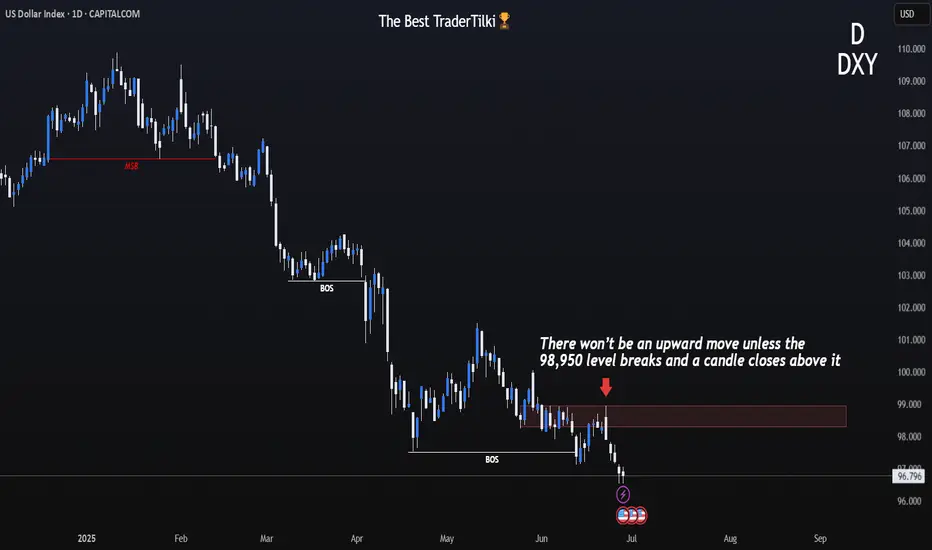
DXY 1D – Tipping Point: News or Price Action?Hey Guys,
The DXY index is currently moving within a downtrend. This trend is unlikely to reverse unless it breaks above the 98.950 level.
Sure, key fundamental data could shift the trend, but without those news catalysts, a reversal at this point doesn’t seem realistic.
Don’t forget—98.950 is a critical threshold for the DXY.
I meticulously prepare these analyses for you, and I sincerely appreciate your support through likes. Every like from you is my biggest motivation to continue sharing my analyses.
I’m truly grateful for each of you—love to all my followers💙💙💙
Bullish reversal?USD/JPY is falling towards the support level, which is an overlap support that aligns with the 50% Fibonacci retracement and could bounce from this level to our take profit.
Entry: 145.84
Why we like it:
There is an overlap support that aligns with the 50% Fibonacci retracement.
Stop loss: 144.91
Why we like it:
There is a pullback support that is slightly below the 61.8% Fibonacci retracement.
Take profit: 147.15
Why we like it:
There is an overlap resistance that lines up with the 38.2% Fibonacci retracement.
Enjoying your TradingView experience? Review us!
Please be advised that the information presented on TradingView is provided to Vantage (‘Vantage Global Limited’, ‘we’) by a third-party provider (‘Everest Fortune Group’). Please be reminded that you are solely responsible for the trading decisions on your account. There is a very high degree of risk involved in trading. Any information and/or content is intended entirely for research, educational and informational purposes only and does not constitute investment or consultation advice or investment strategy. The information is not tailored to the investment needs of any specific person and therefore does not involve a consideration of any of the investment objectives, financial situation or needs of any viewer that may receive it. Kindly also note that past performance is not a reliable indicator of future results. Actual results may differ materially from those anticipated in forward-looking or past performance statements. We assume no liability as to the accuracy or completeness of any of the information and/or content provided herein and the Company cannot be held responsible for any omission, mistake nor for any loss or damage including without limitation to any loss of profit which may arise from reliance on any information supplied by Everest Fortune Group.

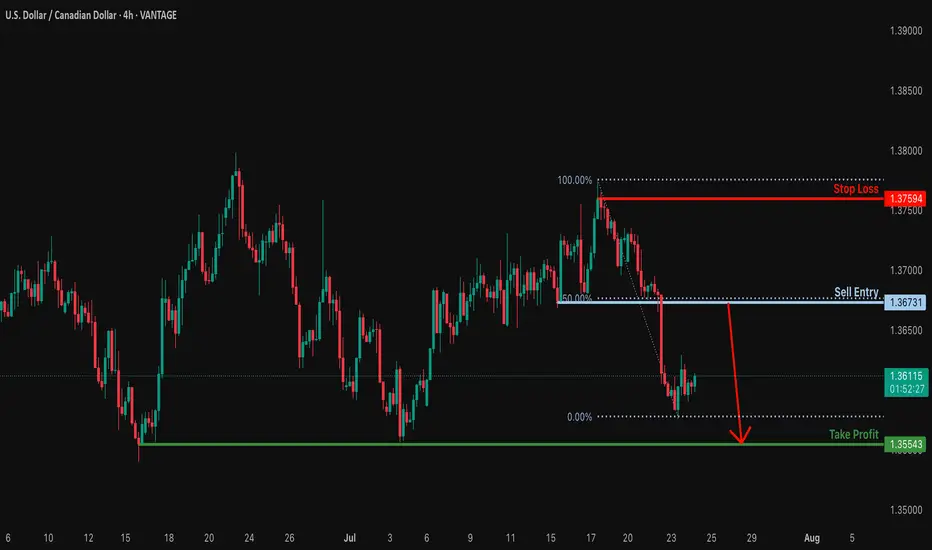
Heading into 50% Fibonacci resistance?USD/CAD is rising towards the resistance which is a pullback reistance that lines up with the 50% Fibonacci retracement and could reverse from this level to our take profit.
Entry: 1.3673
Why we like it:
There is a pullback resistance that lines up with the 50% Fibonacci retracement.
Stop loss: 1.3759
Why we like it:
There is a swing high resistance.
Take profit: 1.3554
Why we like it:
There is a multi swing low support.
Enjoying your TradingView experience? Review us!
Please be advised that the information presented on TradingView is provided to Vantage (‘Vantage Global Limited’, ‘we’) by a third-party provider (‘Everest Fortune Group’). Please be reminded that you are solely responsible for the trading decisions on your account. There is a very high degree of risk involved in trading. Any information and/or content is intended entirely for research, educational and informational purposes only and does not constitute investment or consultation advice or investment strategy. The information is not tailored to the investment needs of any specific person and therefore does not involve a consideration of any of the investment objectives, financial situation or needs of any viewer that may receive it. Kindly also note that past performance is not a reliable indicator of future results. Actual results may differ materially from those anticipated in forward-looking or past performance statements. We assume no liability as to the accuracy or completeness of any of the information and/or content provided herein and the Company cannot be held responsible for any omission, mistake nor for any loss or damage including without limitation to any loss of profit which may arise from reliance on any information supplied by Everest Fortune Group.
Bearish reversal off pullback resistance?The Cable (GBP/USD) is reacting off the resistance level, which is a pullback resistance that aligns with the 50% Fibonacci retracement and could drop from this level to our take profit.
Entry: 1.3589
Why we like it:
There is a pullback resistance that lines up with the 50% Fibonacci retracement.
Stop loss: 1.3673
Why we like it:
There is a swing high resistance.
Take profit: 1.3469
Why we like it:
There is an overlap support level that is slightly above the 61.8% Fibonacci retracement.
Enjoying your TradingView experience? Review us!
Please be advised that the information presented on TradingView is provided to Vantage (‘Vantage Global Limited’, ‘we’) by a third-party provider (‘Everest Fortune Group’). Please be reminded that you are solely responsible for the trading decisions on your account. There is a very high degree of risk involved in trading. Any information and/or content is intended entirely for research, educational and informational purposes only and does not constitute investment or consultation advice or investment strategy. The information is not tailored to the investment needs of any specific person and therefore does not involve a consideration of any of the investment objectives, financial situation or needs of any viewer that may receive it. Kindly also note that past performance is not a reliable indicator of future results. Actual results may differ materially from those anticipated in forward-looking or past performance statements. We assume no liability as to the accuracy or completeness of any of the information and/or content provided herein and the Company cannot be held responsible for any omission, mistake nor for any loss or damage including without limitation to any loss of profit which may arise from reliance on any information supplied by Everest Fortune Group.

Bearish reversal off 161.8% Fibonacci resistance?EUR/USD is rising towards the resistance level which is a pullback resitance that lines up with the 161.8% Fibonacci rretracement and could drop from this level to our take profit.
Entry: 1.1786
Why we like it:
There is a pullback resistance level that lines up with the 161.8% Fibonacci extension.
Stop loss: 1.1828
Why we like it:
There is a swing high resistance.
Take profit: 1.1691
Why we like it:
There is an overlap support that aligns with the 38.2% Fibonacci retracement.
Enjoying your TradingView experience? Review us!
Please be advised that the information presented on TradingView is provided to Vantage (‘Vantage Global Limited’, ‘we’) by a third-party provider (‘Everest Fortune Group’). Please be reminded that you are solely responsible for the trading decisions on your account. There is a very high degree of risk involved in trading. Any information and/or content is intended entirely for research, educational and informational purposes only and does not constitute investment or consultation advice or investment strategy. The information is not tailored to the investment needs of any specific person and therefore does not involve a consideration of any of the investment objectives, financial situation or needs of any viewer that may receive it. Kindly also note that past performance is not a reliable indicator of future results. Actual results may differ materially from those anticipated in forward-looking or past performance statements. We assume no liability as to the accuracy or completeness of any of the information and/or content provided herein and the Company cannot be held responsible for any omission, mistake nor for any loss or damage including without limitation to any loss of profit which may arise from reliance on any information supplied by Everest Fortune Group.

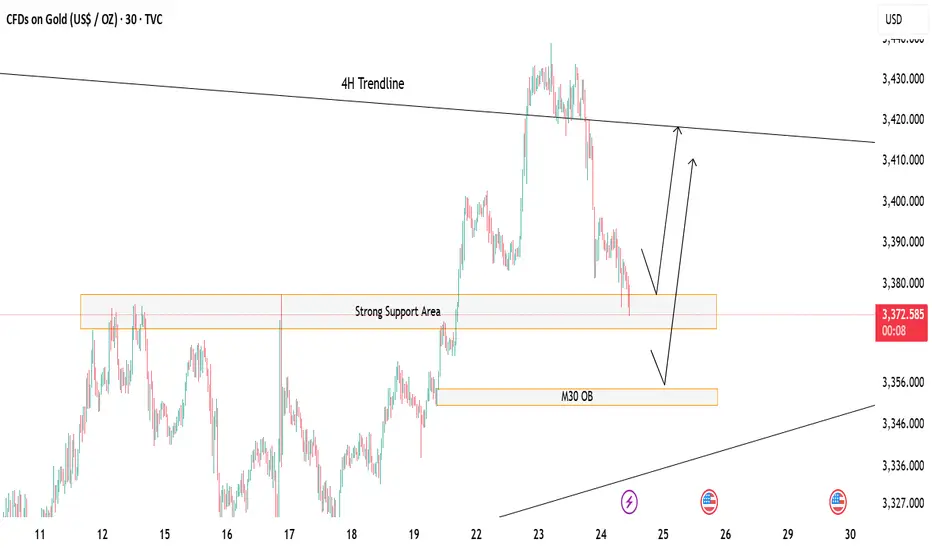
Gold at Key Decision Zone – Bounce or Break?Price is currently hovering above a strong support zone, showing potential for a short-term bounce. 🔁
If this zone holds, we could see a bullish reaction toward the 4H trendline resistance above. 📈
However, a break below may lead price to drop and tap into the M30 Order Block (OB) for a deeper mitigation before any move up. ⚠️
If this happen we could look for potential sell till the OB test otherwise the buying opportunity should focused more
🎯 Watch these key zones carefully – market is at a decision point!
Both buy and sell setups possible depending on how price reacts at these levels.
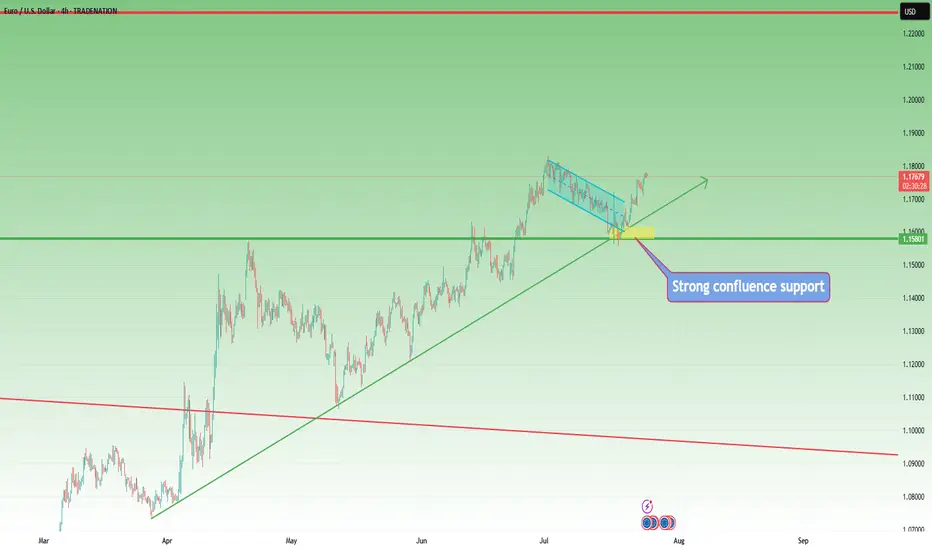
EURUSD – Bulls Still in Control, Trend ResumesIn my previous EURUSD analysis, I pointed out that the pair was nearing an important confluence support around 1.1620, and that – given the overall bullish trend – this zone could offer solid long opportunities.
What followed?
The market briefly dipped below that zone, even challenging the psychological 1.1600 round number. But instead of breaking down, bulls regrouped, stepped in with force, and pushed the pair aggressively higher.
📍 At the time of writing, EURUSD is trading at 1.1770, and my long trade is running with a comfortable 150 pips profit.
🔍 W hat’s Next?
The current structure suggests a continuation of the uptrend, and the logical technical target is the recent high at 1.1830.
Until proven otherwise, this is still a buy-the-dip market.
✅ Buying around 1.1700 could be a valid setup, especially if we see buying power on the intraday chart
⚠️ The Warning Sign
Despite the bullish bias, keep in mind:
If EURUSD drops and closes below 1.1670, the structure begins to shift — and this could signal a deeper correction or even trend reversal.
📌 Until then, the bias remains bullish, dips are to be watched for entries, and 1.1830 is the next checkpoint.
D isclosure: I am part of TradeNation's Influencer program and receive a monthly fee for using their TradingView charts in my analyses and educational articles.
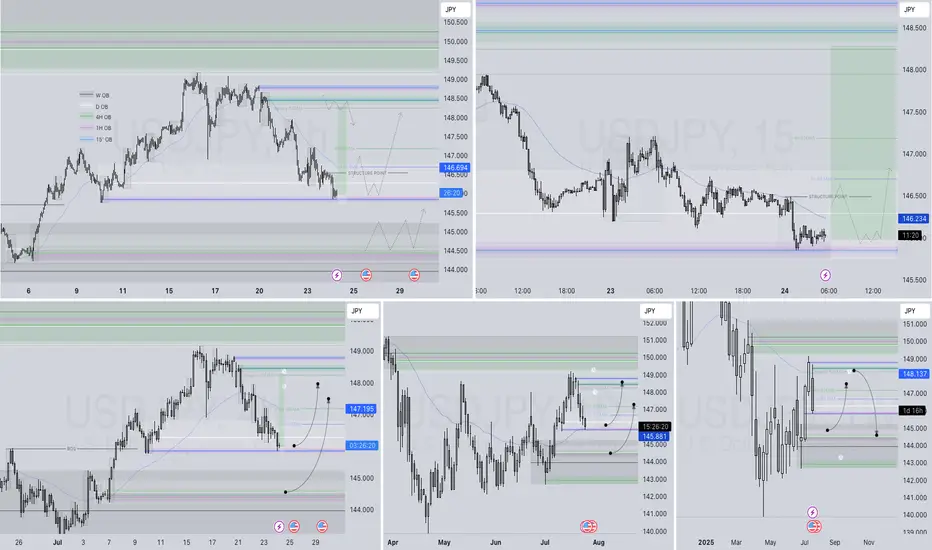
USDJPY Q3 | D24 | W30 | Y25📊USDJPY Q3 | D24 | W30 | Y25
Daily Forecast🔍📅
Here’s a short diagnosis of the current chart setup 🧠📈
Higher time frame order blocks have been identified — these are our patient points of interest 🎯🧭.
It’s crucial to wait for a confirmed break of structure 🧱✅ before forming a directional bias.
This keeps us disciplined and aligned with what price action is truly telling us.
📈 Risk Management Protocols
🔑 Core principles:
Max 1% risk per trade
Only execute at pre-identified levels
Use alerts, not emotion
Stick to your RR plan — minimum 1:2
🧠 You’re not paid for how many trades you take, you’re paid for how well you manage risk.
🧠 Weekly FRGNT Insight
"Trade what the market gives, not what your ego wants."
Stay mechanical. Stay focused. Let the probabilities work.
FRGNT
FX:USDJPY
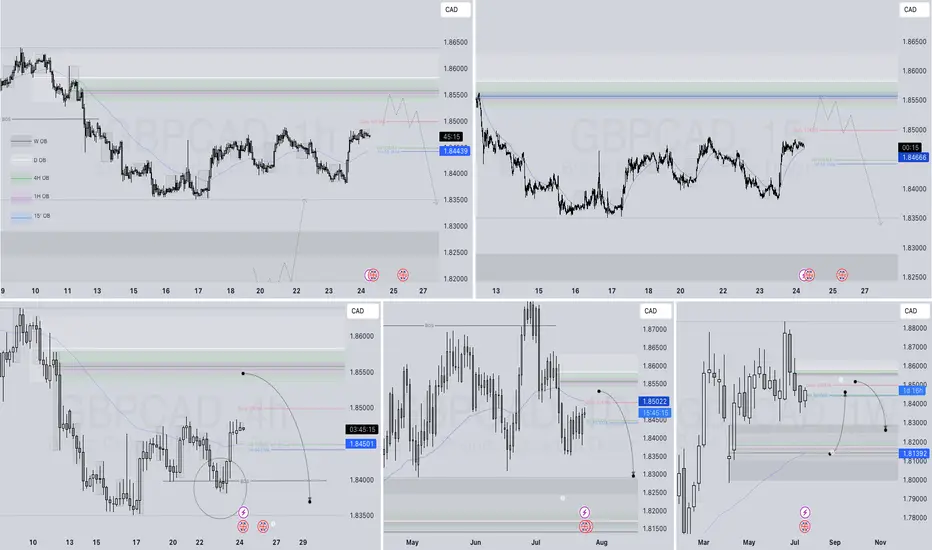
GBPCAD Q3 | D24 | W30 | Y25📊GBPCAD Q3 | D24 | W30 | Y25
Daily Forecast🔍📅
Here’s a short diagnosis of the current chart setup 🧠📈
Higher time frame order blocks have been identified — these are our patient points of interest 🎯🧭.
It’s crucial to wait for a confirmed break of structure 🧱✅ before forming a directional bias.
This keeps us disciplined and aligned with what price action is truly telling us.
📈 Risk Management Protocols
🔑 Core principles:
Max 1% risk per trade
Only execute at pre-identified levels
Use alerts, not emotion
Stick to your RR plan — minimum 1:2
🧠 You’re not paid for how many trades you take, you’re paid for how well you manage risk.
🧠 Weekly FRGNT Insight
"Trade what the market gives, not what your ego wants."
Stay mechanical. Stay focused. Let the probabilities work.
FRGNT
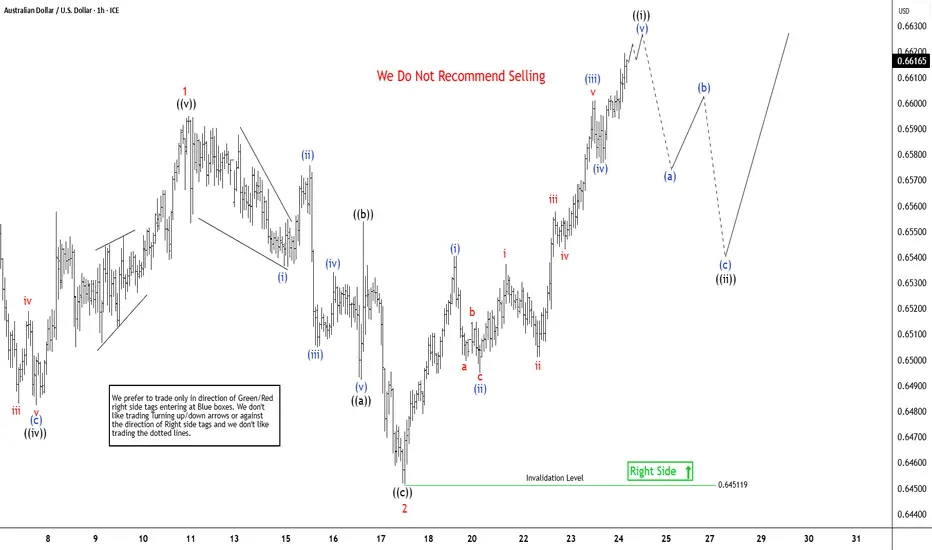
AUDUSD Elliott Wave Outlook: Impulse Pattern Approaching To EndThe AUDUSD pair is showing higher high from 4.09.2025 low, expecting rally to continue from 5.12.2025 low. It favors zigzag corrective bounce from April-2025 low & should continue rally against 0.6451 low. In daily, it started corrective bounce from 4.09.2025 low & may extend towards 0.6720 – 0.6955 area in next few weeks. Above 4.09.2025 low, it ended (A) at 0.6515 high of 5.06.2025, (B) at 0.6354 low of 5.12.2025 & favors upside in (C). Ideally, (C) can extend towards 0.6955 or higher levels, while pullback holds above 5.12.2025 low. Within (C), it placed 1 at 0.6595 high, 2 at 0.6451 low in corrective pullback & favors upside in 3. Within 1, it ended ((i)) at 0.6552 high, ((ii)) at 0.6369 low, ((iii)) at 0.6590 high, ((iv)) at 0.6451 low & ((v)) at 0.6595 high in overlapping diagonal. Below 1 high, it ended 2 in zigzag correction at extreme area before resume rally in 3.
It placed ((a)) of 2 at 0.6492 low in 5 swings, ((b)) at 0.6554 high & ((c)) at 0.6451 low in 5 swings. Wave 2 pullback ended at 0.618 Fibonacci retracement of 1. Within 3, it favors impulse in ((i)) started from 7.17.2025 low. It placed (i) of ((i)) at 0.6540 high, (ii) at 0.6495 low, (iii) at 0.6601 high, (iv) at 0.6576 low & favor upside in (v) targeting in to 0.6606 – 0.6637 area to finish it. It already reached minimum area, but can see more upside above 0.6593 low. Alternatively, the current move even can be (iii) of ((i)) followed by small pullback in (iv) & higher in (v). Later, it expects ((ii)) to correct in 3, 7 or 11 swings against 7.17.2025 low & find support from extreme area to continue rally. Wave 3 should extend in to 0.6692 – 0.6841 area in 5 swings before correcting in 4 of (C). We like to buy the pullback in 3, 7 or 11 swings at extreme area against 7.17.2025 low.
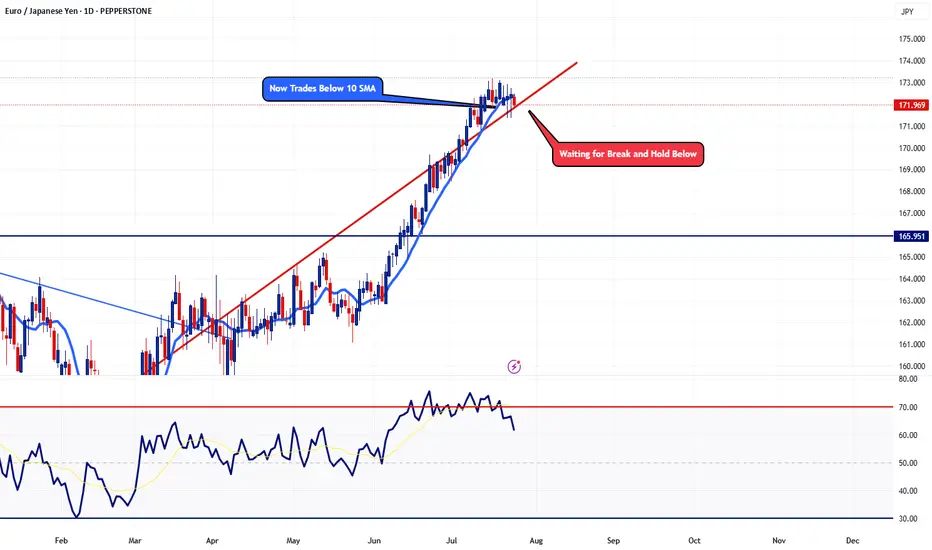
EURJPY - Potential Topping ActionTaking a look at the daily timeframe, price action is now trading below the 10 SMA. This pair has not traded below the 10 SMA since May 26. Now I'm just waiting for a few more confirmation before I'm fully confident. For now, adding a few small sells won't hurt.
Trade Safe - Trade Well