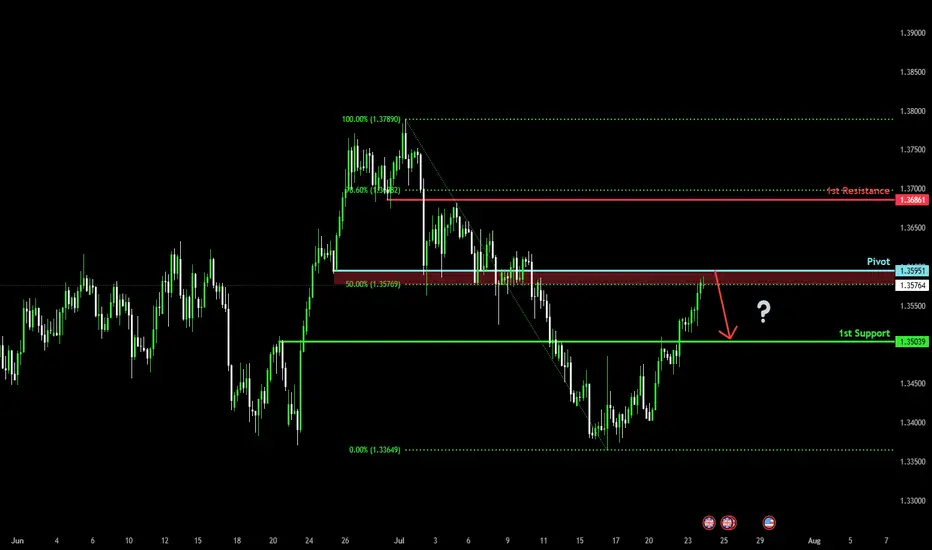
Bearish reevrsal for the Cable?The price is rising towards the pivot, which serves as a pullback resistance and could drop back to the pullback support.
Pivot: 1.3595
1st Support: 1.3503
1st Resistance: 1.3686
Risk Warning:
Trading Forex and CFDs carries a high level of risk to your capital and you should only trade with money you can afford to lose. Trading Forex and CFDs may not be suitable for all investors, so please ensure that you fully understand the risks involved and seek independent advice if necessary.
Disclaimer:
The above opinions given constitute general market commentary, and do not constitute the opinion or advice of IC Markets or any form of personal or investment advice.
Any opinions, news, research, analyses, prices, other information, or links to third-party sites contained on this website are provided on an "as-is" basis, are intended only to be informative, is not an advice nor a recommendation, nor research, or a record of our trading prices, or an offer of, or solicitation for a transaction in any financial instrument and thus should not be treated as such. The information provided does not involve any specific investment objectives, financial situation and needs of any specific person who may receive it. Please be aware, that past performance is not a reliable indicator of future performance and/or results. Past Performance or Forward-looking scenarios based upon the reasonable beliefs of the third-party provider are not a guarantee of future performance. Actual results may differ materially from those anticipated in forward-looking or past performance statements. IC Markets makes no representation or warranty and assumes no liability as to the accuracy or completeness of the information provided, nor any loss arising from any investment based on a recommendation, forecast or any information supplied by any third-party.
Forexsignals
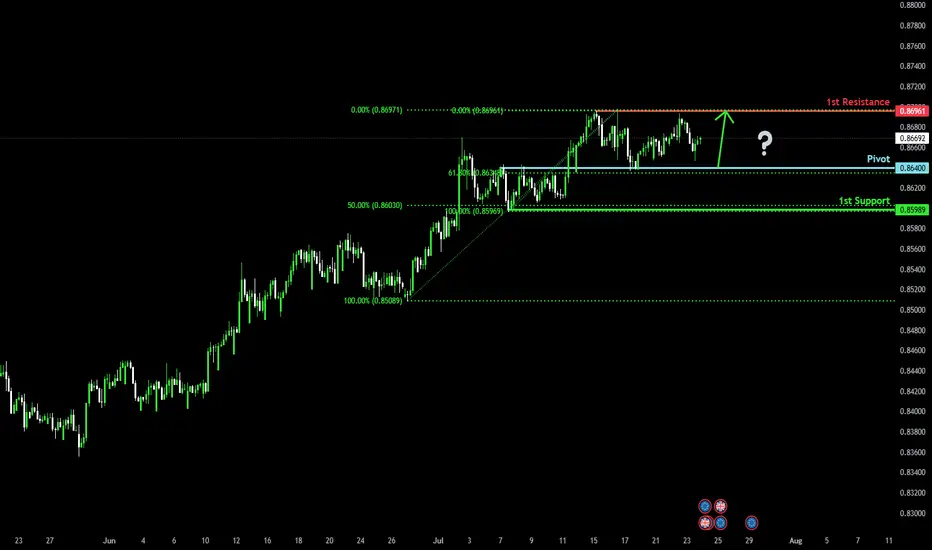
Bullish bounce off overlap support?EUR/GBP is falling towards the pivot, which has been identified as an overlap support and could bounce to the 1st resistance, which acts as a swing high resistance.
Pivot: 0.8640
1st Support: 0.8598
1st Resistance: 0.8696
Risk Warning:
Trading Forex and CFDs carries a high level of risk to your capital and you should only trade with money you can afford to lose. Trading Forex and CFDs may not be suitable for all investors, so please ensure that you fully understand the risks involved and seek independent advice if necessary.
Disclaimer:
The above opinions given constitute general market commentary, and do not constitute the opinion or advice of IC Markets or any form of personal or investment advice.
Any opinions, news, research, analyses, prices, other information, or links to third-party sites contained on this website are provided on an "as-is" basis, are intended only to be informative, is not an advice nor a recommendation, nor research, or a record of our trading prices, or an offer of, or solicitation for a transaction in any financial instrument and thus should not be treated as such. The information provided does not involve any specific investment objectives, financial situation and needs of any specific person who may receive it. Please be aware, that past performance is not a reliable indicator of future performance and/or results. Past Performance or Forward-looking scenarios based upon the reasonable beliefs of the third-party provider are not a guarantee of future performance. Actual results may differ materially from those anticipated in forward-looking or past performance statements. IC Markets makes no representation or warranty and assumes no liability as to the accuracy or completeness of the information provided, nor any loss arising from any investment based on a recommendation, forecast or any information supplied by any third-party.
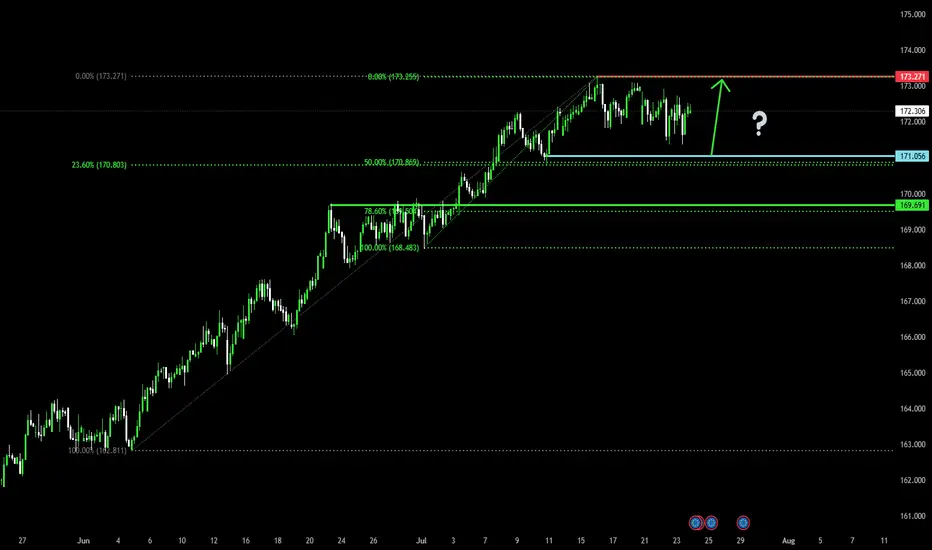
Bullish bounce?EUR/JPY is falling towards the pivot and could bounce to the 1st resistance, which acts as a swing high resistance.
Pivot: 171.05
1st Support: 169.69
1st Resistance: 173.27
Risk Warning:
Trading Forex and CFDs carries a high level of risk to your capital and you should only trade with money you can afford to lose. Trading Forex and CFDs may not be suitable for all investors, so please ensure that you fully understand the risks involved and seek independent advice if necessary.
Disclaimer:
The above opinions given constitute general market commentary, and do not constitute the opinion or advice of IC Markets or any form of personal or investment advice.
Any opinions, news, research, analyses, prices, other information, or links to third-party sites contained on this website are provided on an "as-is" basis, are intended only to be informative, is not an advice nor a recommendation, nor research, or a record of our trading prices, or an offer of, or solicitation for a transaction in any financial instrument and thus should not be treated as such. The information provided does not involve any specific investment objectives, financial situation and needs of any specific person who may receive it. Please be aware, that past performance is not a reliable indicator of future performance and/or results. Past Performance or Forward-looking scenarios based upon the reasonable beliefs of the third-party provider are not a guarantee of future performance. Actual results may differ materially from those anticipated in forward-looking or past performance statements. IC Markets makes no representation or warranty and assumes no liability as to the accuracy or completeness of the information provided, nor any loss arising from any investment based on a recommendation, forecast or any information supplied by any third-party.
Bullish momentum to extend?The Fiber (EUR/USD) is reacting off the pivot and could rise to the 127.2% Fibonacci resistance.
Pivot: 1.1746
1st Support: 1.1659
1st Resistance: 1.1907
Risk Warning:
Trading Forex and CFDs carries a high level of risk to your capital and you should only trade with money you can afford to lose. Trading Forex and CFDs may not be suitable for all investors, so please ensure that you fully understand the risks involved and seek independent advice if necessary.
Disclaimer:
The above opinions given constitute general market commentary, and do not constitute the opinion or advice of IC Markets or any form of personal or investment advice.
Any opinions, news, research, analyses, prices, other information, or links to third-party sites contained on this website are provided on an "as-is" basis, are intended only to be informative, is not an advice nor a recommendation, nor research, or a record of our trading prices, or an offer of, or solicitation for a transaction in any financial instrument and thus should not be treated as such. The information provided does not involve any specific investment objectives, financial situation and needs of any specific person who may receive it. Please be aware, that past performance is not a reliable indicator of future performance and/or results. Past Performance or Forward-looking scenarios based upon the reasonable beliefs of the third-party provider are not a guarantee of future performance. Actual results may differ materially from those anticipated in forward-looking or past performance statements. IC Markets makes no representation or warranty and assumes no liability as to the accuracy or completeness of the information provided, nor any loss arising from any investment based on a recommendation, forecast or any information supplied by any third-party.

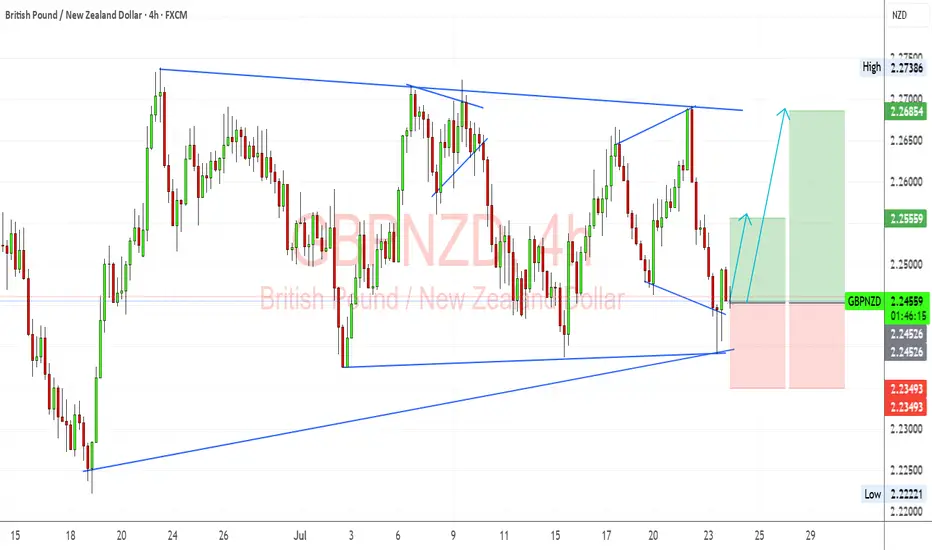
GBPNZD Analysis — 4H Chart ReviewI’m watching GBPNZD for a potential bullish continuation after a successful retest of the long-term ascending trendline. Price rejected near the lower boundary of the symmetrical triangle and showed bullish momentum right off that support. My structure suggests potential upside targets at 2.25559 (minor resistance) and 2.26854 (upper triangle boundary/major resistance zone).
🔍 Fundamental Context:
🇬🇧 GBP Fundamentals:
UK CPI came in softer than expected, and BoE rate cuts are slowly being priced in for late 2025.
However, BoE still sounds relatively hawkish compared to RBNZ due to inflation persistence in services.
Strong UK wage growth and sticky inflation give GBP some near-term yield support.
🇳🇿 NZD Fundamentals:
RBNZ remains on hold, but dovish tilt noted in recent communications.
NZD under pressure from falling dairy prices and weak global growth sentiment (especially China).
Risk-off flows and Fed hawkishness keep NZD vulnerable as a high-beta currency.
⚠️ Risks to the Setup:
A surprise hawkish turn from RBNZ or better-than-expected NZ data could boost NZD.
Renewed UK political instability or weak retail sales data may pressure GBP.
Broader market risk sentiment — NZD may strengthen if risk-on returns and US yields drop.
🗓️ Key News/Events to Monitor:
UK Retail Sales (July 25)
RBNZ Governor Orr Speech (if scheduled)
US PCE (for global risk impact)
Chinese macro data (indirect NZD driver)
🔁 Leader/Lagger Perspective:
GBPNZD often leads EURNZD during GBP-specific catalysts (BoE speeches, UK CPI).
It lags NZDUSD and NZDCAD when risk sentiment or commodity cycles dominate.
📌 Summary: Bias and Watchpoints
I'm bullish on GBPNZD in the short term, especially after a strong trendline retest and recovery off the 2.2450 zone. Fundamentals support GBP resilience over NZD due to relatively hawkish BoE stance and weaker New Zealand data. The main risk to this setup would be a dovish BoE surprise or strong NZ commodity-led rebound. I'll be watching UK Retail Sales and general risk sentiment closely. This pair can act as a leader during UK-specific news but becomes a lagger when risk flows dominate broader NZD direction.
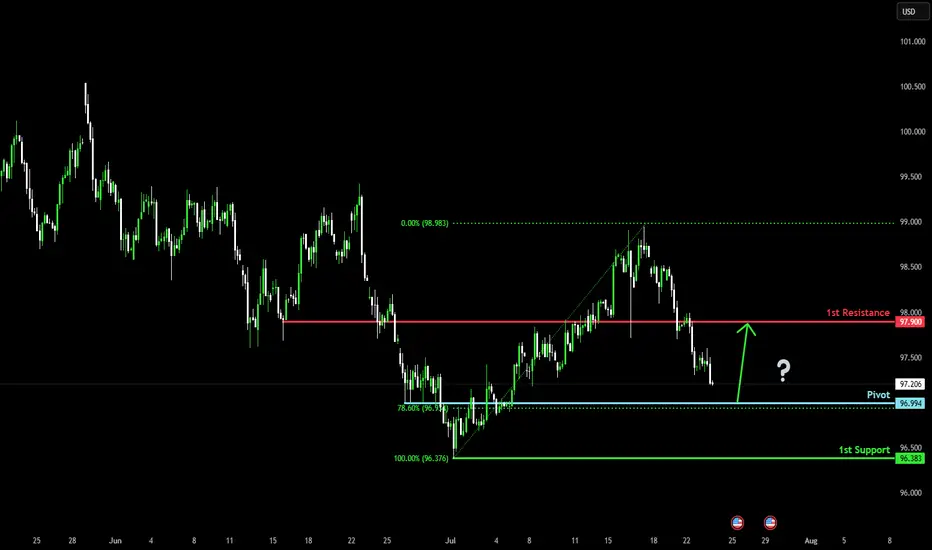
Bullish reversal?US Dollar Index (DXY) is falling towards the pivot and could bounce to the 1st resistance, which is an overlap resistance.
Pivot: 96.99
1st Support: 96.38
1st Resistance: 97.90
Risk Warning:
Trading Forex and CFDs carries a high level of risk to your capital and you should only trade with money you can afford to lose. Trading Forex and CFDs may not be suitable for all investors, so please ensure that you fully understand the risks involved and seek independent advice if necessary.
Disclaimer:
The above opinions given constitute general market commentary, and do not constitute the opinion or advice of IC Markets or any form of personal or investment advice.
Any opinions, news, research, analyses, prices, other information, or links to third-party sites contained on this website are provided on an "as-is" basis, are intended only to be informative, is not an advice nor a recommendation, nor research, or a record of our trading prices, or an offer of, or solicitation for a transaction in any financial instrument and thus should not be treated as such. The information provided does not involve any specific investment objectives, financial situation and needs of any specific person who may receive it. Please be aware, that past performance is not a reliable indicator of future performance and/or results. Past Performance or Forward-looking scenarios based upon the reasonable beliefs of the third-party provider are not a guarantee of future performance. Actual results may differ materially from those anticipated in forward-looking or past performance statements. IC Markets makes no representation or warranty and assumes no liability as to the accuracy or completeness of the information provided, nor any loss arising from any investment based on a recommendation, forecast or any information supplied by any third-party.
EURUSD Bearish Ahead as US Resilience Meets Eurozone FragilityEURUSD has shifted into bearish territory, pressured by growing divergence between a resilient US economy and a struggling Eurozone. The pair recently rejected the 1.1700 zone, forming multiple bearish structures on the 4H chart. With sticky US inflation, Trump’s renewed tariff agenda, and a dovish ECB, EUR/USD appears poised for a deeper move toward 1.1527 and possibly 1.1445 in the coming sessions. This setup is both technically and fundamentally aligned, but key event risk remains.
🔸 Technical Structure (4H)
Clear rejection from the 1.1700–1.1710 zone.
Bearish pennants and wedge patterns confirm continuation lower.
Downside targets:
🔹 First: 1.1637
🔹 Second: 1.1527
🔹 Final: 1.1445
Risk zone: Above 1.1785 (invalidates short bias if broken cleanly).
🧭 Key Fundamentals
🇺🇸 Dollar Strength: Sticky inflation, stable labor market, and geopolitical risk all favor USD demand.
🇪🇺 Euro Weakness: ECB dovish tone persists amid weak data, soft PMIs, and stagnating growth.
Yield Spread: US-Euro real yield spread supports further EUR/USD downside.
Tariff Pressure: Trump’s 50% tariff plan and tensions with the EU weigh on EUR.
⚠️ Risks to Watch
A surprise dovish pivot from the Fed.
Weak US CPI or disappointing retail sales.
Major risk-on flows that trigger broad USD weakness.
New EU fiscal stimulus or Germany/France recovery surprises.
📆 Key Events Ahead
🇺🇸 US Core CPI – A hot print supports USD strength.
🇺🇸 Retail Sales & Powell testimony – Watch tone on rate cuts.
🇪🇺 German ZEW Sentiment, Eurozone HICP inflation – Weak readings would further drag EUR.
🔄 Leader or Lagger?
EUR/USD is a lagger to GBP/USD, often following UK-driven USD moves.
Acts as a leader for EUR/JPY, EUR/AUD, EUR/CHF – weakness here cascades across EUR crosses.
Tracks broad USD sentiment – dovish Fed pricing boosts EURUSD, while rate hike fears drag it.
✅ Summary: Bias and Watchpoints
EUR/USD is bearish below 1.1700 as economic divergence, sticky US inflation, and rising geopolitical tensions favor the dollar. ECB policy remains soft, offering little support to the euro. Key risk lies in a dovish Fed pivot or softer US data. Watch US CPI and Powell for clues. This pair is likely to lag GBP/USD moves, but will lead EUR crosses lower if the downside momentum continues.

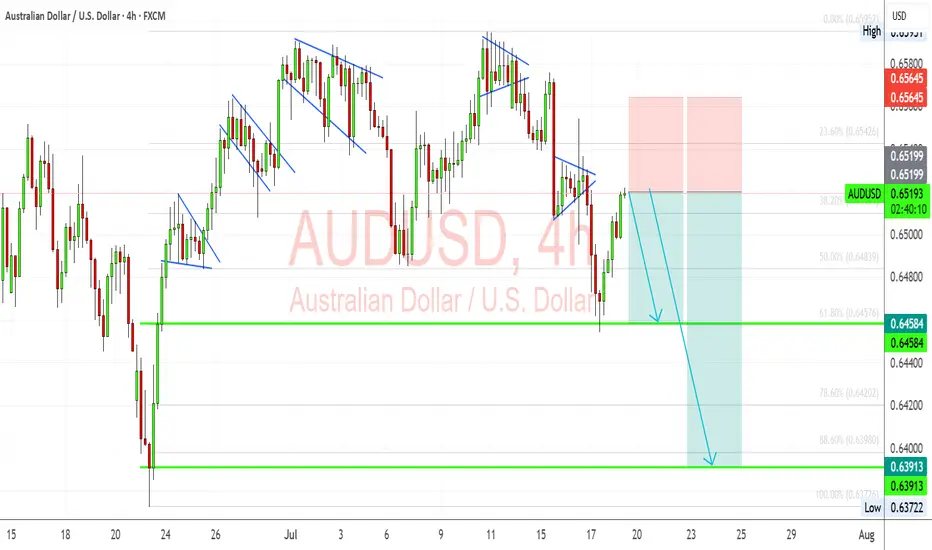
AUDUSD: Bearish Flag Retest Within Macro HeadwindsAUDUSD is developing a clean bearish technical setup just as macro fundamentals increasingly weigh on the Australian dollar. The pair recently completed a rising wedge breakout and is now retesting broken structure within a larger downtrend. With risk sentiment shaky due to U.S. tariff threats and dovish repricing of the RBA’s outlook, Aussie bulls may struggle to sustain momentum. A confirmed breakdown below 0.6458 could open the door toward June’s swing low near 0.6390.
🧠 Technical Breakdown:
✅ Bearish Flag Structure:
The chart shows a sequence of bearish flags and rising wedges, all of which have historically broken lower. The latest breakout to the downside was sharp, and the current rally appears corrective.
✅ Fib Levels & Confluence:
Price is hovering near the 38.2% retracement (0.6510) from the last leg down. The invalidation zone around 0.6565 aligns with a supply zone, making it an ideal SL area.
✅ Target Zones:
First support: 0.6458
Measured move: 0.6390 - 0.6370
These coincide with Fib 61.8% & 100%, adding technical confluence.
📉 Fundamental Drivers:
Dovish RBA Signals: Labour data missed expectations, and June inflation slowed (4.8% vs. 4.9% expected), softening the RBA’s hawkish stance.
Stronger USD Outlook: Powell’s reappointment risk and rate-cut delay pricing have supported the dollar. U.S. data (Retail Sales, CPI) still signal sticky inflation and strong labor.
Tariff Risk from Trump: With the U.S. floating global 10% tariffs, risk assets like AUD (a high-beta currency) face downside pressure.
⚠️ Risks to Bearish Bias:
Stronger-than-expected China stimulus could support AUD as a proxy.
A dovish Fed pivot or soft U.S. data might undercut USD strength.
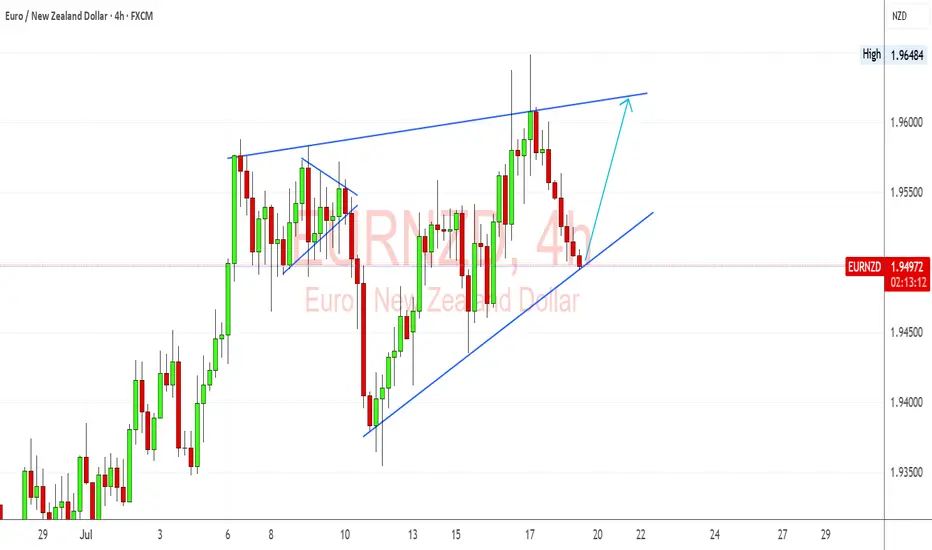
EURNZD Trendline & Hawkish ECB Bias Support Bullish ContinuationEURNZD is holding beautifully above the ascending trendline on the 4H, and I’m watching this level closely for a bounce continuation setup. Fundamentally, the euro remains supported by sticky inflation and hawkish ECB commentary, while the kiwi is showing softness after dovish signals from the RBNZ and mixed jobs data. If this trendline holds, I’ll be targeting a retest of the upper wedge resistance near 1.9640.
🔍 Technical Setup (4H):
Structure: Ascending triangle forming – price is pressing into dynamic support.
Support Zone: Around 1.9480 trendline area – price rejected this level several times in July.
Resistance Target: 1.9640 highs – double top and triangle resistance.
Bullish Confirmation: Rebound with bullish engulfing or strong 4H close above 1.9525 could trigger long setup.
Invalidation: Clean break below trendline and 1.9440 invalidates bullish scenario short-term.
💡 Fundamental Insight:
EUR Drivers:
ECB members remain cautious about declaring victory on inflation.
German and Eurozone CPI data remain above target, supporting higher-for-longer ECB stance.
Speculation that ECB won't cut aggressively compared to RBNZ.
NZD Weakness:
RBNZ minutes show concern over downside inflation risks.
Labor market cooling, and migration pressures remain high.
Commodity and China-linked sentiment weakening NZD.
⚠️ Key Risks:
If Eurozone inflation or PMI data surprises to the downside, EUR may weaken.
RBNZ hawkish pivot or surprise tightening would flip sentiment toward NZD.
Global risk-on could favor NZD as a high-beta currency.
🧭 Summary:
I’m bullish on EURNZD as long as price holds above the trendline near 1.9480. The technical structure shows a clean ascending pattern, and the fundamentals currently favor EUR strength over NZD. My eyes are on a potential move toward 1.9640, especially if upcoming ECB rhetoric stays hawkish. EURNZD tends to lead NZD-crosses like NZDJPY or NZDCHF in risk-off regimes and could signal euro strength if it breaks out. Watching closely for price action confirmation.
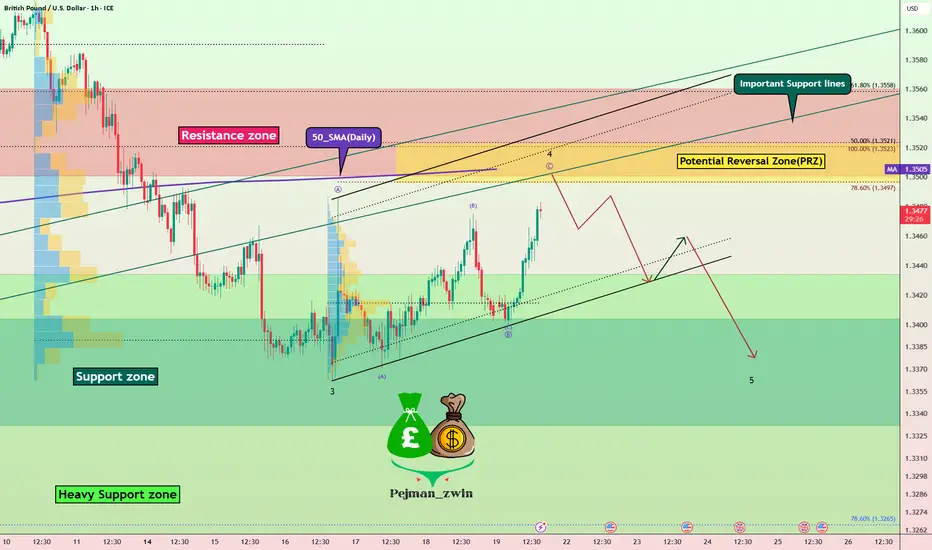
Short Opportunity on GBPUSD – Technical & Fundamentals AlignToday I want to look at the Short position opportunity in GBPUSD ( FX:GBPUSD ). So let's take a look at the GBPUSD pair from a fundamental and technical perspective.
Fundamental Analysis:
The British Pound remains under pressure due to growing expectations of a 25–50 bps rate cut by the Bank of England in early August. Markets are increasingly leaning toward easing as UK inflation hit 3.6% in June, the highest in over a year, while economic growth weakened and consumer confidence dropped to its lowest since early 2024
Ongoing fiscal concerns, including potential tax hikes and budget instability, continue to weigh on the pound. In contrast, the US Dollar( TVC:DXY ) remains relatively robust—supported by strong economic data and a safe-haven preference amid global uncertainty
Summary:
BoE easing becomes more likely due to weak UK data and inflation.
Fiscal risks and low consumer sentiment add downward pressure on GBP.
USD strength from solid data and safe-haven demand supports further GBPUSD downside.
-------------------------
In terms of technical analysis , in the 1-hour timeframe , GBPUSD is approaching the Resistance zone($1.356-$1.350) , the Potential Reversal Zone(PRZ) , and the 50_SMA(Daily) . Meanwhile, this return to Important Support lines could act as a pullback to these lines. Important support lines and 50_SMA(Daily) were broken last week.
In terms of Elliott Wave theory , GBPUSD appears to be completing a main wave 4 . Main wave 4 is likely to have a Zigzag Correction(ABC/5-3-5) .
I expect GBPUSD to start declining from the Potential Reversal Zone(PRZ) and reach the targets I have marked on the chart.
Note: Stop Loss(SL): 1.3575USD = Worst Stop Loss(SL)
Please respect each other's ideas and express them politely if you agree or disagree.
British Pound / U.S Dollar Analysis (GBPUSD), 1-hour time frame.
Be sure to follow the updated ideas.
Do not forget to put a Stop loss for your positions (For every position you want to open).
Please follow your strategy and updates; this is just my Idea, and I will gladly see your ideas in this post.
Please do not forget the ✅' like '✅ button 🙏😊 & Share it with your friends; thanks, and Trade safe.
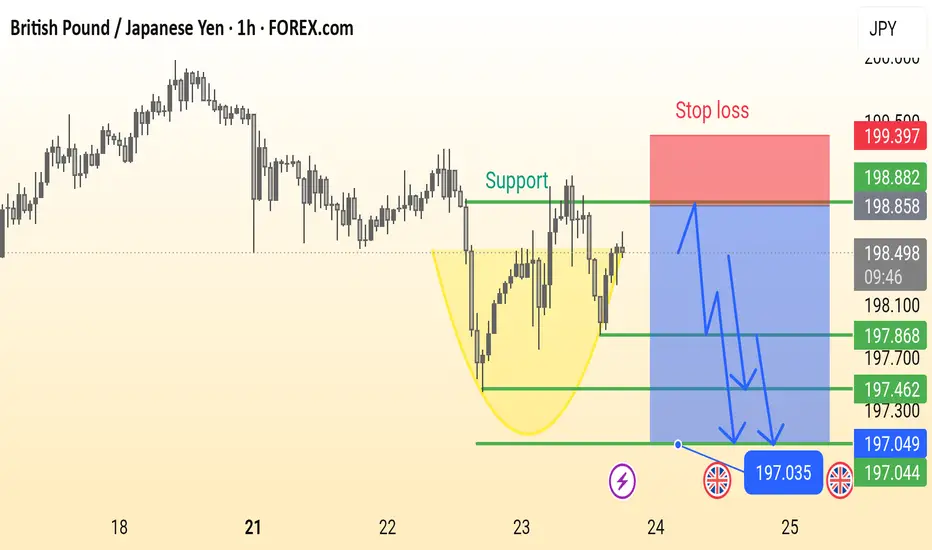
GBP/JPY Analysis is Ready This is a 1-hour chart of the GBP/JPY currency pair showing a potential bearish setup. Key elements include:
Support Zone: Around 198.000, previously tested multiple times.
Bearish Cup Pattern: Highlighted in yellow, suggesting a reversal.
Stop Loss: Marked above 199.397.
Sell Entry Zone: Near the support break at ~198.000.
Bearish Targets: 197.868 → 197.462 → 197.035 (with final support near 197.044).
Bearish Projection Arrows: Indicate expected price movement after breakdown.
This chart suggests a sell setup on breakdown, with well-defined risk and reward levels.
USD/JPY Is Ready Move Will Be Fly USD/JPY 30-min chart shows a potential buy setup from the 146.18 support zone, targeting 148.10 with stop loss at 145.82. Price is expected to rise through resistance levels at 147.00 and 147.70.

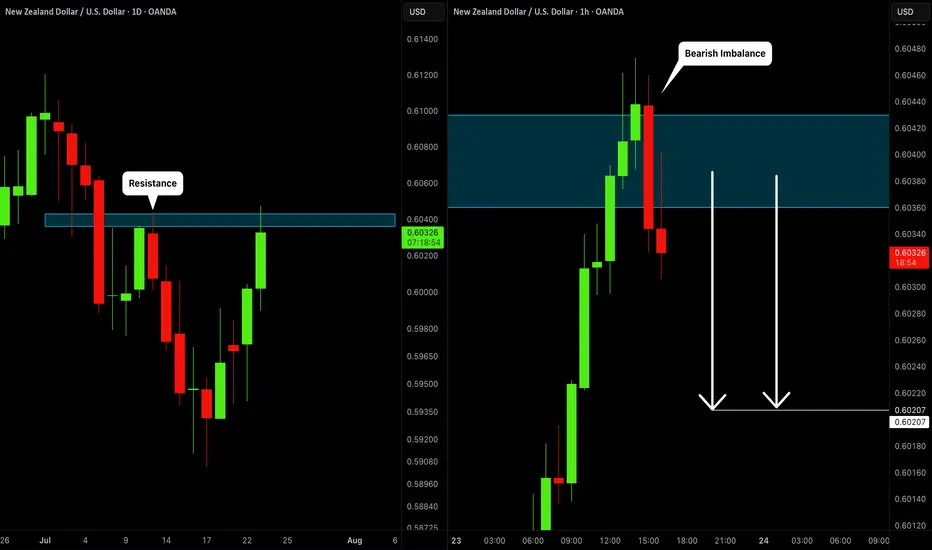
NZDUSD: Time For Pullback 🇳🇿🇺🇸
I think that NZDUSD will retrace from the underlined resistance.
As a confirmation, I spotted a bearish imbalance candle on an hourly time frame
after its test.
There is a high chance to see a retracement.
Goal - 0.602
❤️Please, support my work with like, thank you!❤️
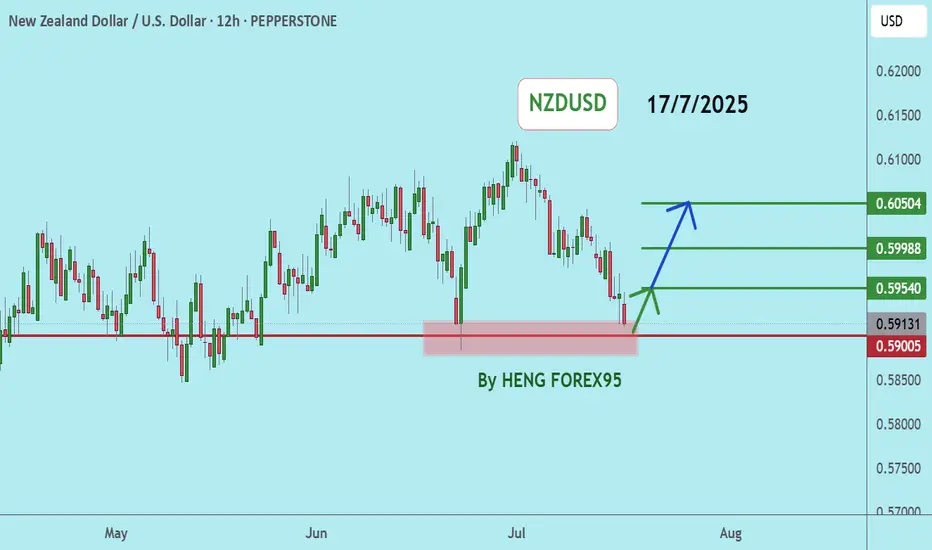
NZDUSDNZDUSD price is near the support zone 0.59197-0.58790. If the price cannot break through the 0.58790 level, it is expected that the price will rebound. Consider buying the red zone.
🔥Trading futures, forex, CFDs and stocks carries a risk of loss.
Please consider carefully whether such trading is suitable for you.
>>GooD Luck 😊
❤️ Like and subscribe to never miss a new idea!
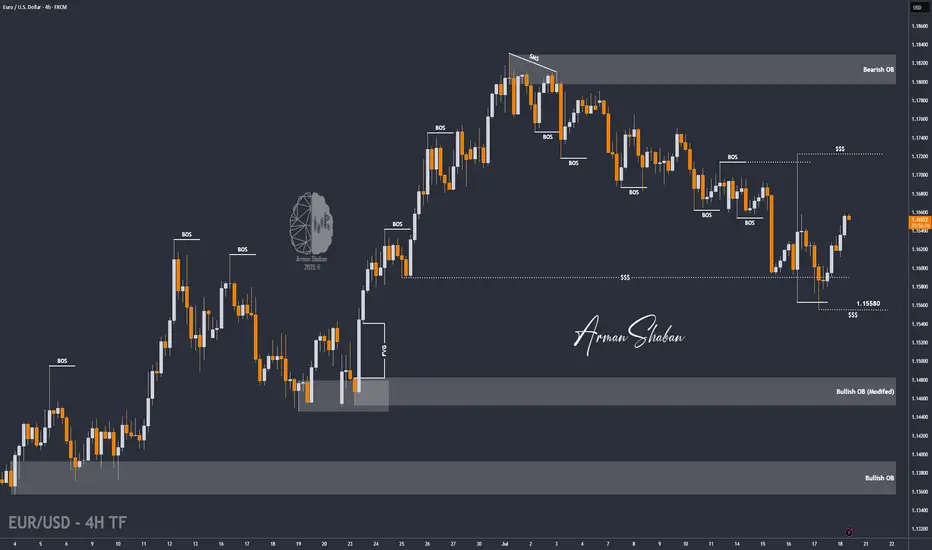
EUR/USD | Bullish Momentum Builds – Next Targets Ahead! (READ)By analyzing the EURUSD chart on the 4-hour timeframe, we can see that, as per the previous analysis, the price first made a strong move in two steps, successfully hitting the 1.15580 target. Upon reaching this key level, it reacted positively with increased demand and is now trading around 1.16520. Given the current trend, I expect further bullish movement soon, with the next potential targets at 1.16720, 1.17230, and 1.17500.
Please support me with your likes and comments to motivate me to share more analysis with you and share your opinion about the possible trend of this chart with me !
Best Regards , Arman Shaban
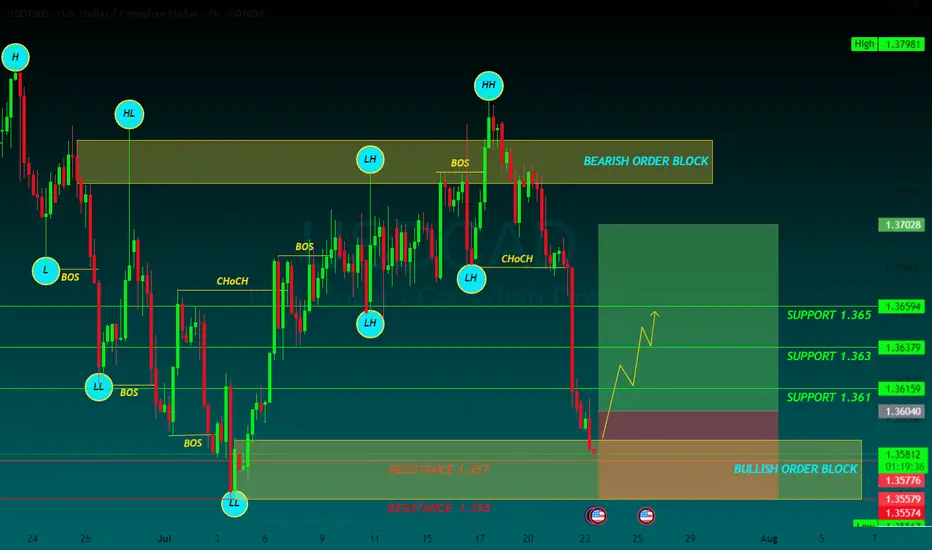
USDCAD BUYUSD/CAD returns below 1.3600, with YTD lows, at 1.3540 coming into view
The US Dollar extends its decline for the fourth consecutive day, with the Canadian Dollar supported by a brighter market mood, as the trade deal between the US and Japan provided some certainty about the outlook of global trade and boosted hopes of more such deals.
In the USD/CAD 2025 Forecast, FXStreet analyst Joshua Gibson suggests uncertainty and risk-off sentiment could strengthen the US Dollar (USD) early in 2025, while the Canadian Dollar (CAD) is expected to weaken in the first quarter. However, CAD investors may reassess prospects as the year progresses, focusing on the Federal Reserve (Fed) - Bank of Canada (BoC) policy dynamics.
From a technical point of view, USD/CAD could face a technical ceiling near the 1.4400 level after the Canadian Dollar's sharp 8.5% decline in 2024 sent the pair to 56-month highs. However, technical indicators like the MACD suggest caution, as short positions may only become viable once clear sell signals emerge, likely during the first quarter.
SUPPORT 1.361
SUPPORT 1.353
SUPPORT 1.361
RESISTANCE 1.357
RESISTANCE 1.355
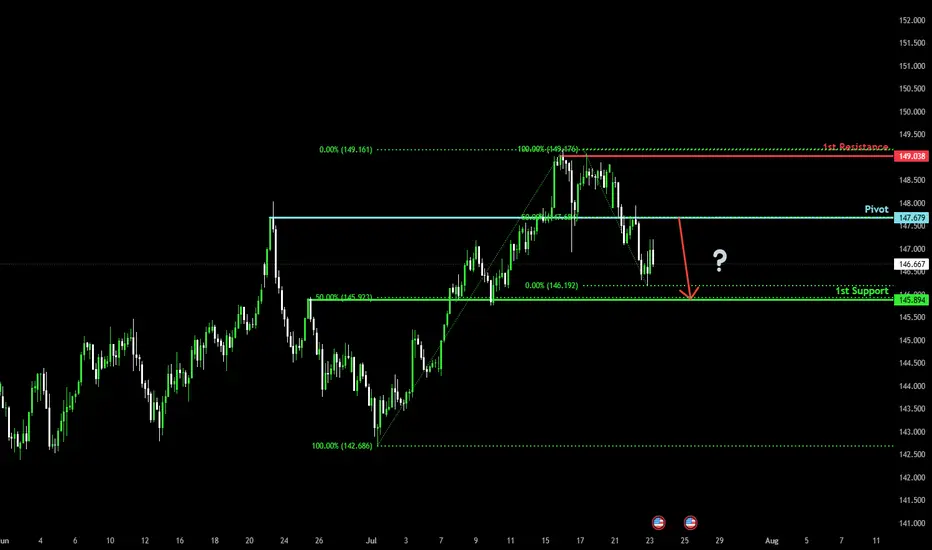
Major resistance ahead?USD/JPY is rising towards the pivot and could reverse to the 1st support which aligns with the 50% Fibonacci retracement.
Pivot: 147.67
1st Support: 145.89
1st Resistance: 149.03
Risk Warning:
Trading Forex and CFDs carries a high level of risk to your capital and you should only trade with money you can afford to lose. Trading Forex and CFDs may not be suitable for all investors, so please ensure that you fully understand the risks involved and seek independent advice if necessary.
Disclaimer:
The above opinions given constitute general market commentary, and do not constitute the opinion or advice of IC Markets or any form of personal or investment advice.
Any opinions, news, research, analyses, prices, other information, or links to third-party sites contained on this website are provided on an "as-is" basis, are intended only to be informative, is not an advice nor a recommendation, nor research, or a record of our trading prices, or an offer of, or solicitation for a transaction in any financial instrument and thus should not be treated as such. The information provided does not involve any specific investment objectives, financial situation and needs of any specific person who may receive it. Please be aware, that past performance is not a reliable indicator of future performance and/or results. Past Performance or Forward-looking scenarios based upon the reasonable beliefs of the third-party provider are not a guarantee of future performance. Actual results may differ materially from those anticipated in forward-looking or past performance statements. IC Markets makes no representation or warranty and assumes no liability as to the accuracy or completeness of the information provided, nor any loss arising from any investment based on a recommendation, forecast or any information supplied by any third-party.
Could the Kiwi reverse from here?The price is rising towards the pivot, which acts as an overlap resistance that aligns with the 61.8% Fibonacci retracement and could reverse to the 1st support which is an overlap support.
Pivot: 0.6038
1st Support: 0.5979
1st Resistance: 0.6115
Risk Warning:
Trading Forex and CFDs carries a high level of risk to your capital and you should only trade with money you can afford to lose. Trading Forex and CFDs may not be suitable for all investors, so please ensure that you fully understand the risks involved and seek independent advice if necessary.
Disclaimer:
The above opinions given constitute general market commentary, and do not constitute the opinion or advice of IC Markets or any form of personal or investment advice.
Any opinions, news, research, analyses, prices, other information, or links to third-party sites contained on this website are provided on an "as-is" basis, are intended only to be informative, is not an advice nor a recommendation, nor research, or a record of our trading prices, or an offer of, or solicitation for a transaction in any financial instrument and thus should not be treated as such. The information provided does not involve any specific investment objectives, financial situation and needs of any specific person who may receive it. Please be aware, that past performance is not a reliable indicator of future performance and/or results. Past Performance or Forward-looking scenarios based upon the reasonable beliefs of the third-party provider are not a guarantee of future performance. Actual results may differ materially from those anticipated in forward-looking or past performance statements. IC Markets makes no representation or warranty and assumes no liability as to the accuracy or completeness of the information provided, nor any loss arising from any investment based on a recommendation, forecast or any information supplied by any third-party.

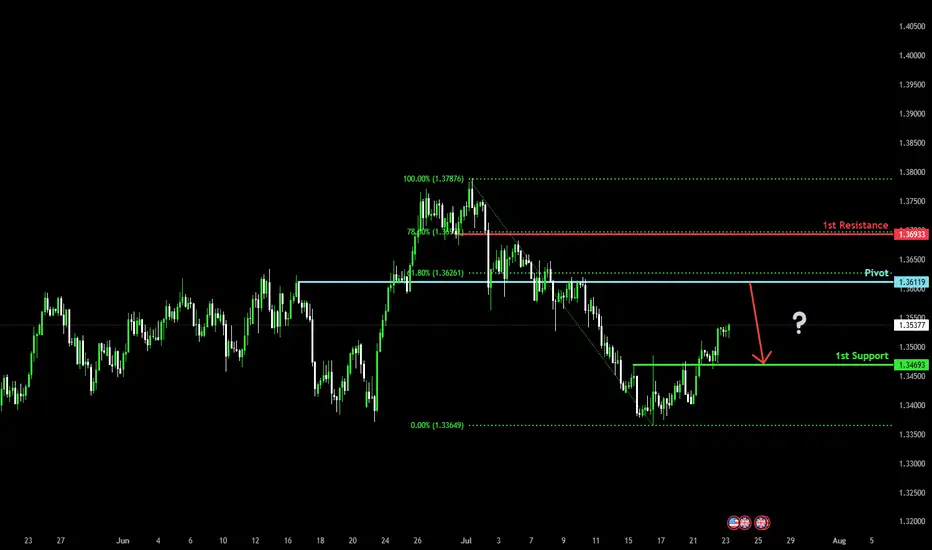
Bearish reversal off overlap resistance?The Cable (GBP/USD) is rising towards the pivot, which acts as an overlap resistance and could reverse to the 1st support.
Pivot: 1.3611
1st Support: 1.3469
1st Resistance: 1.3693
Risk Warning:
Trading Forex and CFDs carries a high level of risk to your capital and you should only trade with money you can afford to lose. Trading Forex and CFDs may not be suitable for all investors, so please ensure that you fully understand the risks involved and seek independent advice if necessary.
Disclaimer:
The above opinions given constitute general market commentary, and do not constitute the opinion or advice of IC Markets or any form of personal or investment advice.
Any opinions, news, research, analyses, prices, other information, or links to third-party sites contained on this website are provided on an "as-is" basis, are intended only to be informative, is not an advice nor a recommendation, nor research, or a record of our trading prices, or an offer of, or solicitation for a transaction in any financial instrument and thus should not be treated as such. The information provided does not involve any specific investment objectives, financial situation and needs of any specific person who may receive it. Please be aware, that past performance is not a reliable indicator of future performance and/or results. Past Performance or Forward-looking scenarios based upon the reasonable beliefs of the third-party provider are not a guarantee of future performance. Actual results may differ materially from those anticipated in forward-looking or past performance statements. IC Markets makes no representation or warranty and assumes no liability as to the accuracy or completeness of the information provided, nor any loss arising from any investment based on a recommendation, forecast or any information supplied by any third-party.
Bearish reversal off overlap resistance?USD/JPY is rising towards the resistance level which is an overlap resitance that is slightly above the 50% Fibonacci retracement and could reverse from this level to our take profit.
Entry: 147.88
Why we like it:
There is an overlap resistance that is slight.y above the 50% Fibonacci retracement.
Stop loss: 149.18
Why we like it:
There is a swing high resistance.
Take profit: 145.85
Why we like it:
There is an overlap support that lines up with the 50% Fibonacci retracement.
Enjoying your TradingView experience? Review us!
Please be advised that the information presented on TradingView is provided to Vantage (‘Vantage Global Limited’, ‘we’) by a third-party provider (‘Everest Fortune Group’). Please be reminded that you are solely responsible for the trading decisions on your account. There is a very high degree of risk involved in trading. Any information and/or content is intended entirely for research, educational and informational purposes only and does not constitute investment or consultation advice or investment strategy. The information is not tailored to the investment needs of any specific person and therefore does not involve a consideration of any of the investment objectives, financial situation or needs of any viewer that may receive it. Kindly also note that past performance is not a reliable indicator of future results. Actual results may differ materially from those anticipated in forward-looking or past performance statements. We assume no liability as to the accuracy or completeness of any of the information and/or content provided herein and the Company cannot be held responsible for any omission, mistake nor for any loss or damage including without limitation to any loss of profit which may arise from reliance on any information supplied by Everest Fortune Group.

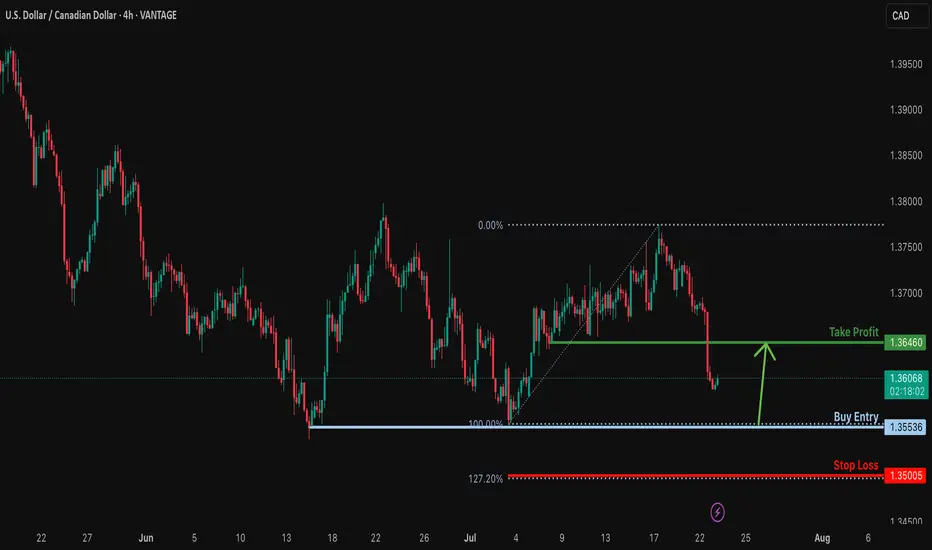
Bullish reversal?USD/CAD is faalling towards the support level which is a multi swing low support and could bounce from this level to our take profit.
Entry: 1.3553
Why we like it:
There is a multi swing low support.
Stop loss: 1.3500
Why we like it:
There is a support at the 127.2% Fibonacc extension.
Take profit: 1.3646
Why we like it:
There is a pullback resistance.
Enjoying your TradingView experience? Review us!
Please be advised that the information presented on TradingView is provided to Vantage (‘Vantage Global Limited’, ‘we’) by a third-party provider (‘Everest Fortune Group’). Please be reminded that you are solely responsible for the trading decisions on your account. There is a very high degree of risk involved in trading. Any information and/or content is intended entirely for research, educational and informational purposes only and does not constitute investment or consultation advice or investment strategy. The information is not tailored to the investment needs of any specific person and therefore does not involve a consideration of any of the investment objectives, financial situation or needs of any viewer that may receive it. Kindly also note that past performance is not a reliable indicator of future results. Actual results may differ materially from those anticipated in forward-looking or past performance statements. We assume no liability as to the accuracy or completeness of any of the information and/or content provided herein and the Company cannot be held responsible for any omission, mistake nor for any loss or damage including without limitation to any loss of profit which may arise from reliance on any information supplied by Everest Fortune Group.
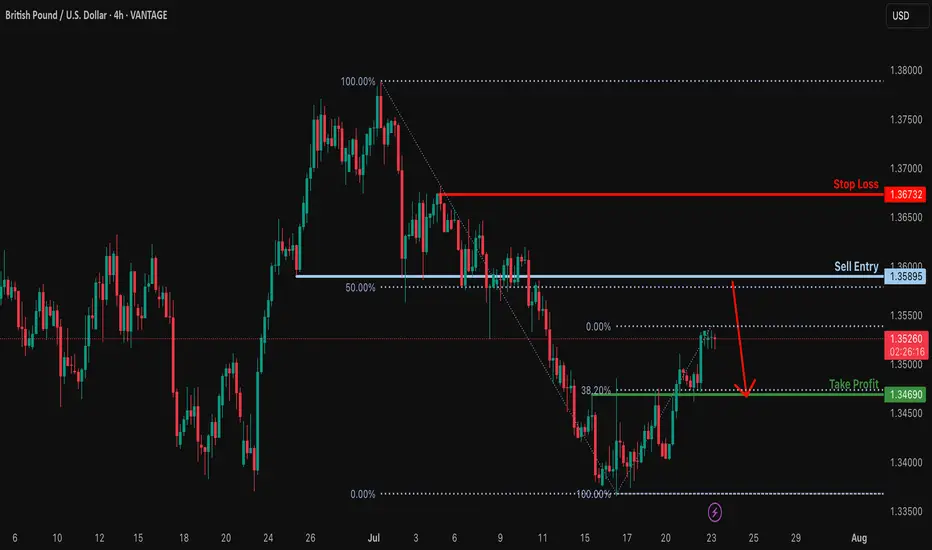
Bearish reversal off 50% Fibonacci resistance?GBP/USD is rising towards the resistance level which his a pullback resistance that lines up with the 50% Fibonacci retracement and could reverse from this level to our take profit.
Entry: 1.3589
Why we like it:
There is a pullback resistance that lines up with the 50% Fibonacci retracement.
Stop loss: 1.3673
Why we like it:
There is a pullback resstance.
Take profit: 1.3469
Why we like it:
There is an overlap support that aligns with the 38.2% Fibonacci retracement.
Enjoying your TradingView experience? Review us!
Please be advised that the information presented on TradingView is provided to Vantage (‘Vantage Global Limited’, ‘we’) by a third-party provider (‘Everest Fortune Group’). Please be reminded that you are solely responsible for the trading decisions on your account. There is a very high degree of risk involved in trading. Any information and/or content is intended entirely for research, educational and informational purposes only and does not constitute investment or consultation advice or investment strategy. The information is not tailored to the investment needs of any specific person and therefore does not involve a consideration of any of the investment objectives, financial situation or needs of any viewer that may receive it. Kindly also note that past performance is not a reliable indicator of future results. Actual results may differ materially from those anticipated in forward-looking or past performance statements. We assume no liability as to the accuracy or completeness of any of the information and/or content provided herein and the Company cannot be held responsible for any omission, mistake nor for any loss or damage including without limitation to any loss of profit which may arise from reliance on any information supplied by Everest Fortune Group.
Bullish bounce?EUR/USD is falling towards the support level which is a pullback support that aligns with the 50% Fibonacci retracement and could bounce to from this level to our take profit.
Entry: 1.1660
Why we like it:
There is a pullback support that lines up with the 50% Fibonacci retracement.
Stop loss: 1.1593
Why we like it:
There is a multi swing low support that is slightly below the 78.6% Fibonacci retracement.
Take profit: 1.1813
Why we like it:
There is a swing high resistance.
Enjoying your TradingView experience? Review us!
Please be advised that the information presented on TradingView is provided to Vantage (‘Vantage Global Limited’, ‘we’) by a third-party provider (‘Everest Fortune Group’). Please be reminded that you are solely responsible for the trading decisions on your account. There is a very high degree of risk involved in trading. Any information and/or content is intended entirely for research, educational and informational purposes only and does not constitute investment or consultation advice or investment strategy. The information is not tailored to the investment needs of any specific person and therefore does not involve a consideration of any of the investment objectives, financial situation or needs of any viewer that may receive it. Kindly also note that past performance is not a reliable indicator of future results. Actual results may differ materially from those anticipated in forward-looking or past performance statements. We assume no liability as to the accuracy or completeness of any of the information and/or content provided herein and the Company cannot be held responsible for any omission, mistake nor for any loss or damage including without limitation to any loss of profit which may arise from reliance on any information supplied by Everest Fortune Group.
