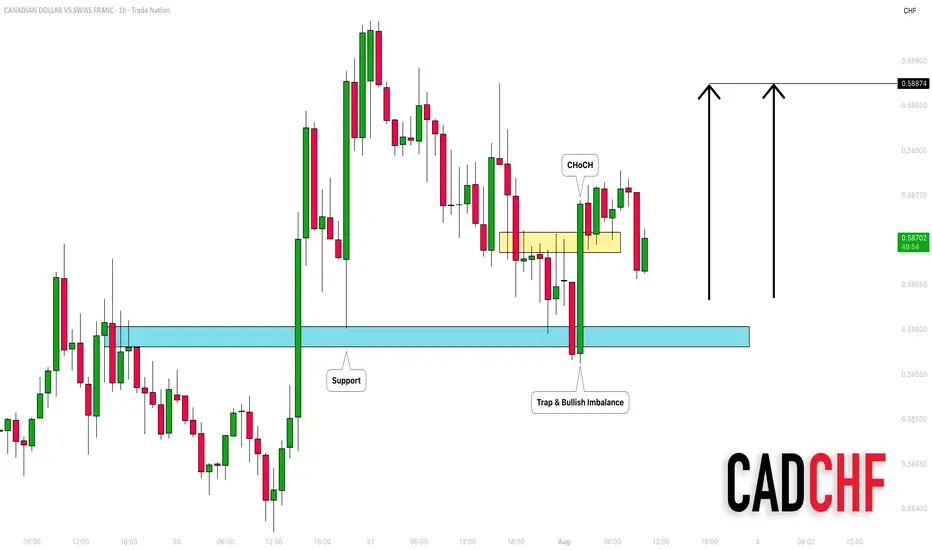
CADCHF: Bullish Move After the Trap 🇨🇦🇨🇭
There is a high chance that CADCHF will go up today.
After a test of a key horizontal support, the price formed
a liquidity grab with a consequent bullish imbalance.
We can expect growth to 0.5887
❤️Please, support my work with like, thank you!❤️
I am part of Trade Nation's Influencer program and receive a monthly fee for using their TradingView charts in my analysis.
Forextrader
GBP/USD Professional Analysis – “Trap Trigger at Support”GBP/USD Professional Analysis – “Trap Trigger at Support”
📈 Market Overview:
• Pair: GBP/USD
• Timeframe: Likely 1H or 2H based on candle spacing
• Date: July 28, 2025
• Current Price: 1.33529
⸻
🔍 Technical Breakdown
🔴 Resistance Zone: 1.35800 – 1.36200
• Strong supply area where the last bullish impulse failed.
• Price got rejected hard, initiating a new downtrend.
• Sell-side pressure was confirmed with Supertrend turning red.
🟤 Support Zone: 1.32860 – 1.33400
• Major demand area where price previously reversed sharply.
• Currently being tested again after a clean sweep into the Trap Trigger zone.
⚠ Trap Trigger Zone (Liquidity Sweep Area):
• Price wicked just below support, tapping into a low-volume/high-liquidity area.
• This wick likely cleared sell-side liquidity and trapped breakout sellers.
• Followed by a bullish rejection wick, implying smart money accumulation.
⸻
🛠 Indicators & Tools:
• Supertrend (10,3): Currently red, indicating short-term bearish momentum.
• However, if price closes above 1.34032 (Supertrend level), it could flip bullish.
• Volume Profile (VRVP):
• Low-volume node under support suggests a quick “stop hunt” move, not genuine selling.
• High-volume acceptance area sits higher, near 1.34500–1.35000.
⸻
🎯 Forecast:
🔴 Bearish Invalidations:
• Price closing below 1.32860 with volume would invalidate this setup.
• That could signal continuation to deeper liquidity (1.32500 or below).
⸻
🧠 Smart Money Perspective:
• Liquidity engineered beneath support
• Trap Trigger activated — ideal for institutional reversal setups
• This is a classic “Stop Hunt → Reclaim → Expand” model

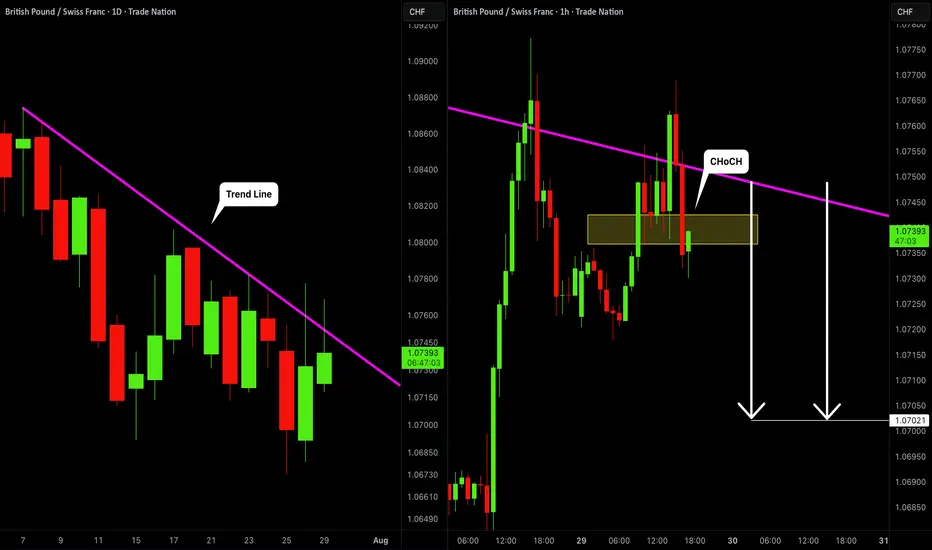
GBPCHF: Bearish Movement Confirmed 🇬🇧🇨🇭
GBPCHF looks bearish after the news today.
The price tested a solid rising trend line on a daily
and formed a confirmed bearish Change of Character
on an hourly time frame.
I think that the price will continue falling and reach 1.0702 level.
❤️Please, support my work with like, thank you!❤️
I am part of Trade Nation's Influencer program and receive a monthly fee for using their TradingView charts in my analysis.
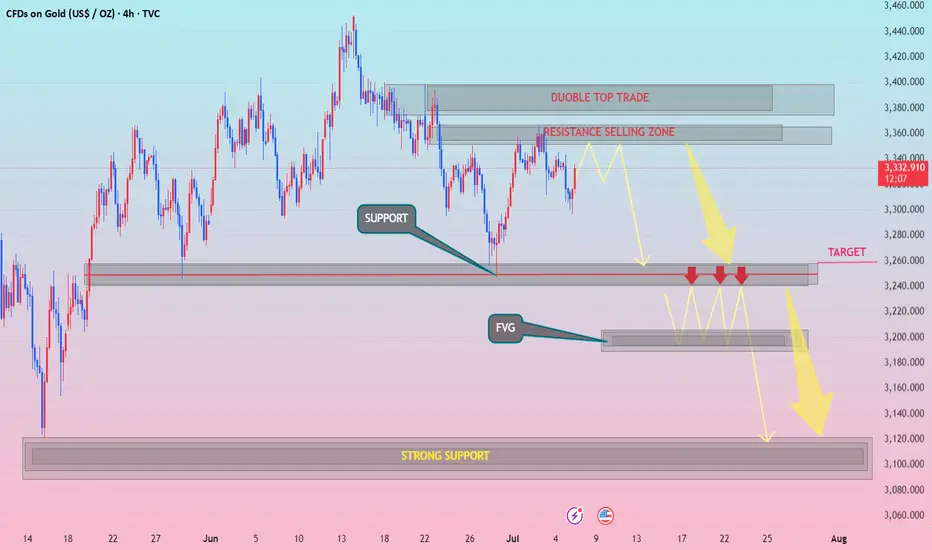
XAUUSD h4 down pattranDouble Top Yes Break above neckline = Bullish invalidation
Resistance Selling Zone Yes May flip to support
Target Zone (3,260) Yes Over-tested support may trigger reversal instead
FVG (~3,200) Yes May not fill if bullish momentum sustains
Strong Support (~3,100) Yes Price might not drop that far before buyers
WITH ZARA..FVG
GBP/CAD (Two Trade Recaps) EUR/NZD Long and GBP/JPY LongEUR/NZD Long
Minimum entry requirements:
- If tight non-structured 15 min continuation forms, 5 min risk entry within it if the continuation is structured on the 5 min chart or reduced risk entry on the break of it.
- If tight structured 15 min continuation forms, reduced risk entry on the break of it or 15 min risk entry within it.
- If tight non-structured 1H continuation forms, 15 min risk entry within it if the continuation is structured on the 15 min chart or reduced risk entry on the break of it.
- If tight structured 1H continuation forms, 1H risk entry within it or reduced risk entry on the break of it.
GBP/JPY Long
Minimum entry requirements:
- Tap into area of value.
- 1H impulse up above area of value.
- If tight non-structured 15 min continuation follows, 5 min risk entry within it if the continuation is structured on the 5 min chart or reduced risk entry on the break of it.
- If tight structured 15 min continuation follows, reduced risk entry on the break of it or 15 min risk entry within it.

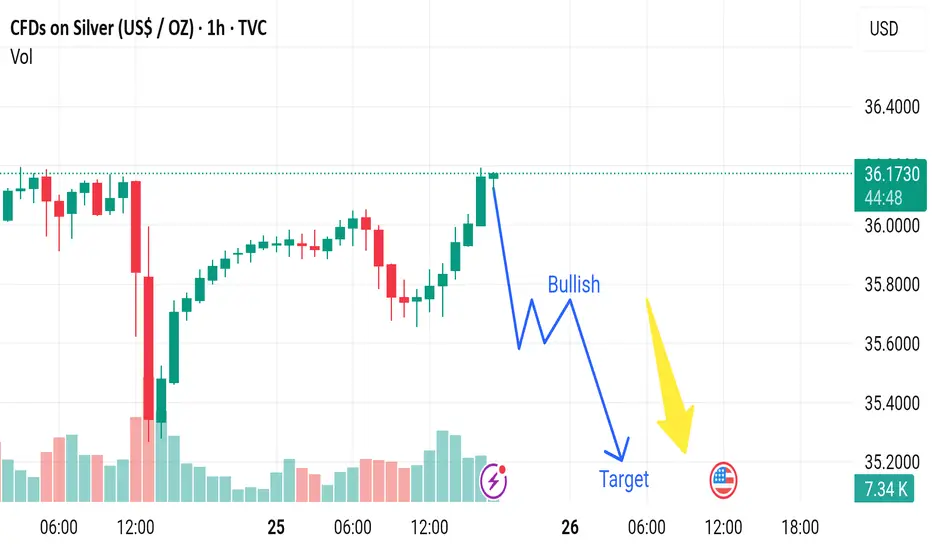
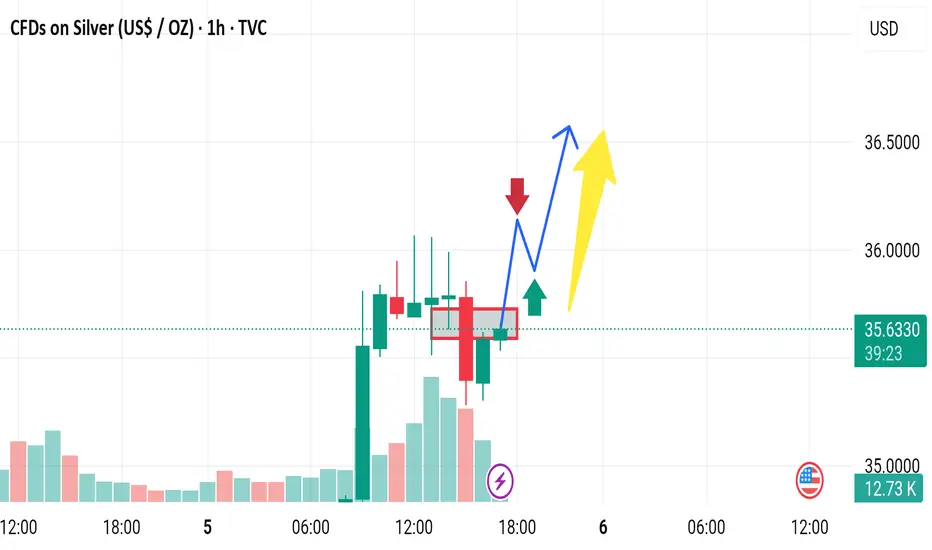
Market next target 🚀 Bullish Disruption Analysis
1. Support Holds Above 35.80
The market may dip slightly but find strong support around the 35.90–36.00 zone.
Instead of continuing lower, buyers absorb the selling pressure, leading to a sharp bullish reversal.
2. Bullish Continuation After Consolidation
The current pullback could just be a healthy retracement following the strong recovery move from the previous dip.
This could form a bullish flag or ascending triangle, eventually breaking above 36.20 and pushing higher.
3. Volume Clue
If the pullback happens with declining red volume, while previous green candles had strong volume, it signals a temporary correction rather than a trend reversal.
Watch for a bullish engulfing candle backed by strong volume to confirm.
4. Macro Trigger / Fundamental Support
Any dovish signal from the Fed, rising inflation, or weakening USD could increase investor demand for silver, pushing prices back up.
A news-driven reversal could invalidate the bearish path quickly.
5. Bullish Price Target
If buyers take control, silver could retest and break above 36.30–36.40, aiming toward 36.60 or even 36.80.
EUR/AUD Short, EUR/NZD Short, NZD/USD Long and AUD/NZD ShortEUR/AUD Short
Minimum entry requirements:
- If tight non-structured 1H continuation forms, 15 min risk entry within it if the continuation is structured on the 15 min chart or reduced risk entry on the break of it.
- If tight structured 1H continuation forms, 1H risk entry within it or reduced risk entry on the break of it.
EUR/NZD Short
Minimum entry requirements:
- If tight non-structured 1H continuation forms, 15 min risk entry within it if the continuation is structured on the 15 min chart or reduced risk entry on the break of it.
- If tight structured 1H continuation forms, 1H risk entry within it or reduced risk entry on the break of it.
NZD/USD Long
Minimum entry requirements:
- If tight non-structured 1H continuation forms, 15 min risk entry within it if the continuation is structured on the 15 min chart.
- If tight structured 1H continuation forms, 1H risk entry within it.
AUD/NZD Short
Minimum entry requirements:
- If tight non-structured 1H continuation forms, 15 min risk entry within it if the continuation is structured on the 15 min chart.
- If tight structured 1H continuation forms, 1H risk entry within it.

EUR/AUD ShortEUR/AUD Short
Minimum entry requirements:
- 1H impulse down below area of interest.
- If tight non-structured 5 min continuation follows, reduced risk entry on the break of it.
- If tight structured 5 min continuation follows, reduced risk entry on the break of it or 5 min risk entry within it.
- If tight non-structured 15 min continuation follows, 5 min risk entry within it if the continuation is structured on the 5 min chart or reduced risk entry on the break of it.
- If tight structured 15 min continuation follows, reduced risk entry on the break of it or 15 min risk entry within it.

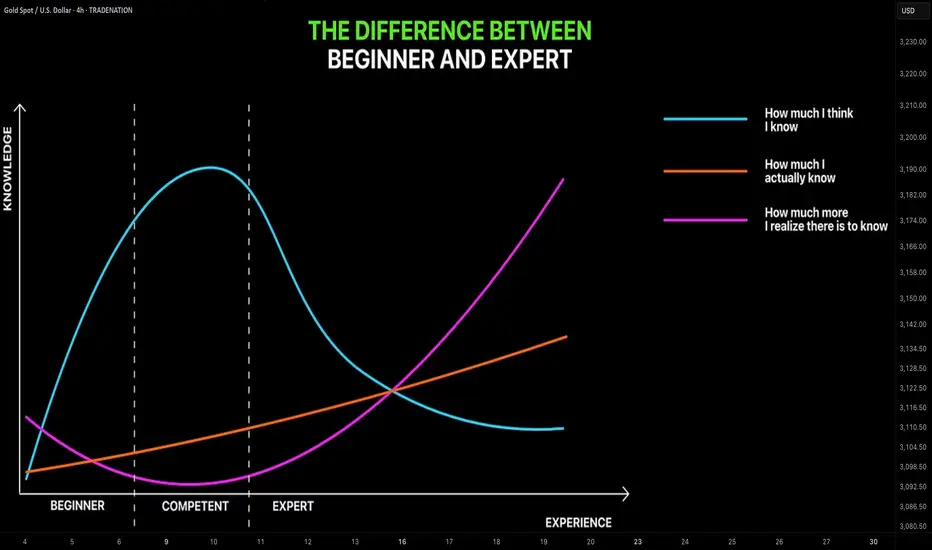
Learn The Difference Between Beginner and Expert in Trading
In the today's post, we will discuss the evolution of a mindset of a trader as he matures in trading.
✔️Beginner
For some unknown reasons, beginners assume that a couple of educational videos and books about trading is more than enough to start trading successfully.
They believe that they got a comprehensive knowledge and that very few things remain to learn.
They start trading, but quickly realize that their knowledge is not enough to make even small gains.
✔️COMPETENT
After practicing a couple of years, traders come to the conclusion
that they know everything in that field. That they learned, tested and tried all concepts and techniques that are available.
They consider themselves to be the experts in the field BUT
for some unknown reasons, these traders still are not able to trade profitably.
✔️EXPERT
After many years of learning, training and practicing, eyes finally open.
Traders realize how limited is their knowledge and how much more there is to learn .
While they already have the skills to trade in profits, they understand now that even the entire life is not enough to learn all the subtleties of trading.
And here is a little lifehack for you:
if you are a beginner, embrace a mindset of an expert.
Start from realizing how little you actually know and how much more there is to know, that will help you a lot in your trading journey.
❤️Please, support my work with like, thank you!❤️
I am part of Trade Nation's Influencer program and receive a monthly fee for using their TradingView charts in my analysis.
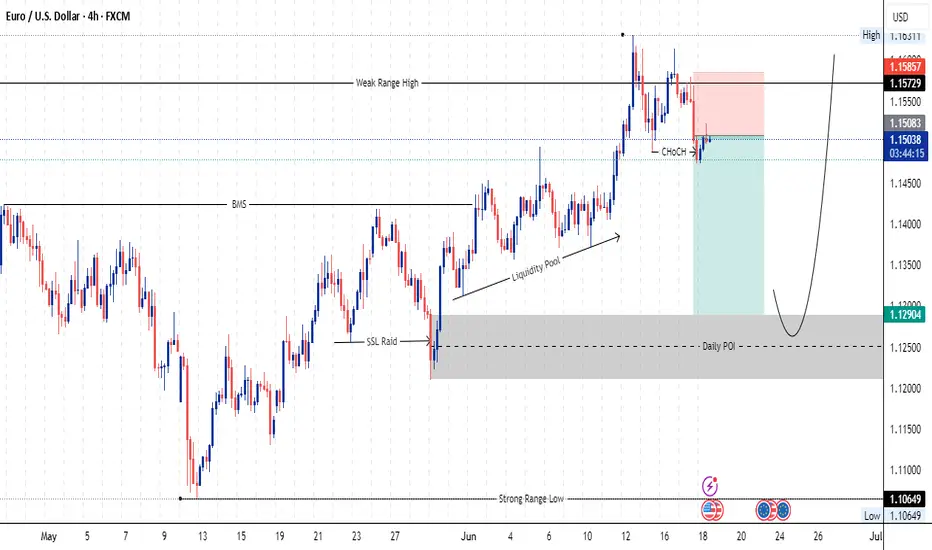
This is my views on EURUSD so far.I have not yet taken a single position on this pair because price has not yet met my execution requirements. Overall views on the pair are short term bullish to the Weekly/Monthly POI's then I will be looking for a long term bearish structure.
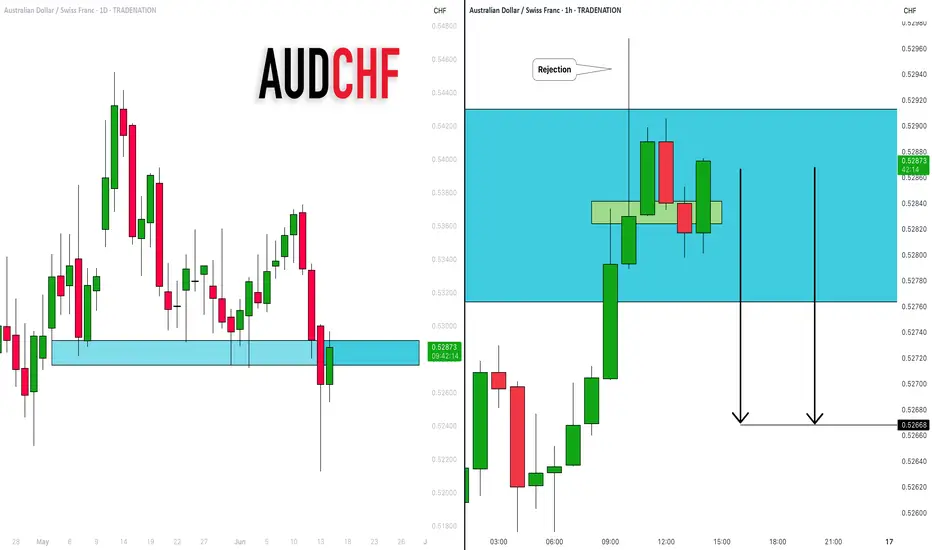
AUDCHF: Pullback From Resistance 🇦🇺🇨🇭
There is a high chance that AUDCHF will retrace from a key daily resistance.
As a confirmation, I see a strong rejection on an hourly time frame.
Goal - 0.5267
❤️Please, support my work with like, thank you!❤️
I am part of Trade Nation's Influencer program and receive a monthly fee for using their TradingView charts in my analysis.
EUR/USD Short and GBP/USD ShortEUR/USD Short
Minimum entry requirements:
- If tight non-structured 15 min continuation forms, 5 min risk entry within it if the continuation is structured on the 5 min chart or reduced risk entry on the break of it.
- If tight structured 15 min continuation forms, reduced risk entry on the break of it or 15 min risk entry within it.
- If tight non-structured 1H continuation forms, 15 min risk entry within it if the continuation is structured on the 15 min chart or reduced risk entry on the break of it.
- If tight structured 1H continuation forms, 1H risk entry within it or reduced risk entry on the break of it.
GBP/USD Short
Minimum entry requirements:
- If tight non-structured 1H continuation forms, 15 min risk entry within it if the continuation is structured on the 15 min chart.
- If tight structured 1H continuation forms, 1H risk entry within it.

USD/CHF ShortUSD/CHF Short
Minimum entry requirements:
- Corrective tap into area of value.
- 4H risk entry or 1H risk entry after 2 x 1H rejection candles.
Minimum entry requirements:
- Tap into area of value.
- 1H impulse down below area of value.
- If tight non-structured 5 min continuation follows, reduced risk entry on the break of it.
- If tight structured 5 min continuation follows, reduced risk entry on the break of it or 5 min risk entry within it.
- If tight non-structured 15 min continuation follows, 5 min risk entry within it if the continuation is structured on the 5 min chart or reduced risk entry on the break of it.
- If tight structured 15 min continuation follows, reduced risk entry on the break of it or 15 min risk entry within it.

AUD/JPY Short, EUR/JPY Short, GBP/JPY Short and USD/CHF ShortAUD/JPY Short
Minimum entry requirements:
- 1H impulse down below area of value.
- If tight non-structured 5 min continuation follows, reduced risk entry on the break of it.
- If tight structured 5 min continuation follows, reduced risk entry on the break of it or 5 min risk entry within it.
- If tight non-structured 15 min continuation follows, 5 min risk entry within it if the continuation is structured on the 5 min chart or reduced risk entry on the break of it.
- If tight structured 15 min continuation follows, reduced risk entry on the break of it or 15 min risk entry within it.
EUR/JPY Short
Minimum entry requirements:
- If structured 1H continuation forms, 1H risk entry within it.
GBP/JPY Short
Minimum entry requirements:
- If tight non-structured 1H continuation forms, 15 min risk entry within it if the continuation is structured on the 15 min chart.
- If tight structured 1H continuation forms, 1H risk entry within it.
USD/CHF Short
Minimum entry requirements:
- Corrective tap into area of value.
- 4H risk entry or 1H risk entry after 2 x 1H rejection candles.
Minimum entry requirements:
- Tap into area of value.
- 1H impulse down below area of value.
- If tight non-structured 5 min continuation follows, reduced risk entry on the break of it.
- If tight structured 5 min continuation follows, reduced risk entry on the break of it or 5 min risk entry within it.
- If tight non-structured 15 min continuation follows, 5 min risk entry within it if the continuation is structured on the 5 min chart or reduced risk entry on the break of it.
- If tight structured 15 min continuation follows, reduced risk entry on the break of it or 15 min risk entry within it.

USD/JPY Short, AUD/NZD Short, AUD/JPY Neutral and EUR/USD ShortUSD/JPY Short
Minimum entry requirements:
- If tight non-structured 5 min continuation forms, reduced risk entry on the break of it.
- If tight structured 5 min continuation forms, reduced risk entry on the break of it or 5 min risk entry within it.
- If tight non-structured 15 min continuation forms, 5 min risk entry within it if the continuation is structured on the 5 min chart or reduced risk entry on the break of it.
- If tight structured 15 min continuation forms, reduced risk entry on the break of it or 15 min risk entry within it.
AUD/NZD Short
Minimum entry requirements:
- If tight non-structured 15 min continuation forms, 5 min risk entry within it if the continuation is structured on the 5 min chart or reduced risk entry on the break of it.
- If tight structured 15 min continuation forms, reduced risk entry on the break of it or 15 min risk entry within it.
AUD/JPY Neutral
Minimum entry requirements:
- If structured 1H continuation forms, 1H risk entry within it.
Minimum entry requirements:
- 1H impulse down below area of value.
- If tight non-structured 5 min continuation follows, reduced risk entry on the break of it.
- If tight structured 5 min continuation follows, reduced risk entry on the break of it or 5 min risk entry within it.
- If tight non-structured 15 min continuation follows, 5 min risk entry within it if the continuation is structured on the 5 min chart or reduced risk entry on the break of it.
- If tight structured 15 min continuation follows, reduced risk entry on the break of it or 15 min risk entry within it.
EUR/USD Short
Minimum entry requirements:
- Tap into area of value.
- 1H impulse down below area of value.
- If tight non-structured 15 min continuation follows, 5 min risk entry within it if the continuation is structured on the 5 min chart or reduced risk entry on the break of it.
- If tight structured 15 min continuation follows, reduced risk entry on the break of it or 15 min risk entry within it.

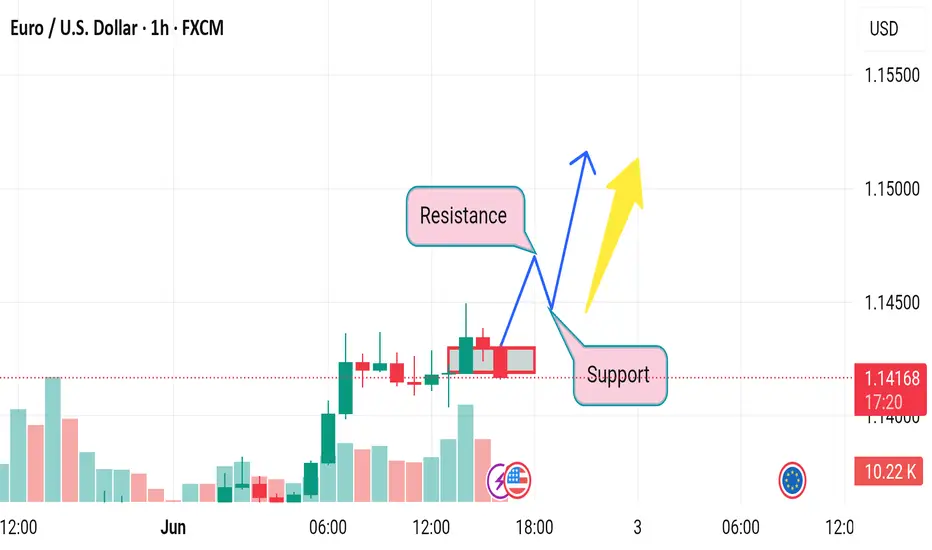
Market next move 🧨 Disruption Points:
1. Overbought Condition / RSI Divergence
Even though the price is surging (+3.30%), there could be an overbought condition forming.
If RSI or other momentum indicators (not shown here) diverge, it might signal weakness in bullish momentum.
> Disruptive idea: Price may fake the breakout (blue arrow) and then sharply reverse, trapping late buyers.
---
2. False Breakout Trap
The red-box area could be a liquidity zone where smart money might induce a fake breakout before dumping.
> Alternative path: Price breaks above temporarily (as in blue path), but then reverses violently back into the range, forming a “bull trap.”
---
3. Volume Anomaly
The volume appears to be decreasing on recent bullish candles after the initial spike.
This suggests that the uptrend may be losing strength, making the yellow arrow scenario less likely.
> Contrary outlook: Lack of volume confirmation could mean a sideways consolidation or reversal is more probable.
Market next move 🔻 Disruptive Bearish Analysis:
🧱 1. Failed Breakout Attempt
Price is hovering at resistance but showing indecisive candles (small bodies, wicks on both sides).
This hints at buyer exhaustion rather than breakout momentum.
📉 2. Bearish Divergence (Possible)
If momentum indicators (e.g., RSI or MACD—not shown here) are diverging from price, it could signal a reversal.
Price rising while momentum flattens or drops suggests a fakeout is likely.
🕳️ 3. Liquidity Grab Trap
The chart may show a classic “bull trap”:
Price broke resistance briefly but quickly fell back.
This signals institutional liquidity grab, possibly before a downward push.
🔽 4. Volume Imbalance
The spike in volume earlier may be followed by decreasing bullish volume, indicating weak follow-through.
Sellers could take over if bulls can’t sustain pressure.
Market next target 🟢 Disruptive Bullish Scenario:
🔁 1. Healthy Bull Flag or Consolidation
The steep rally (+4.5%) may not lead to a breakdown.
The current pause near $34.50 could be a bull flag or tight range consolidation, common in continuation patterns.
🔼 2. Volume Supports the Move
Notice the strong rising volume on the breakout candles.
This shows genuine buyer interest, not a pump-and-dump move.
🧲 3. Breakout Holding Above Previous Highs
Price is holding above previous resistance, which now acts as support around $34.00–$34.20.
Holding this zone can lead to a retest and breakout to new highs.
📈 4. Strong Macro Bullish Catalyst
The U.S. event icon suggests important data is near.
If the data (like weaker dollar or inflation concerns) supports metals, Silver could surge further rather than drop.

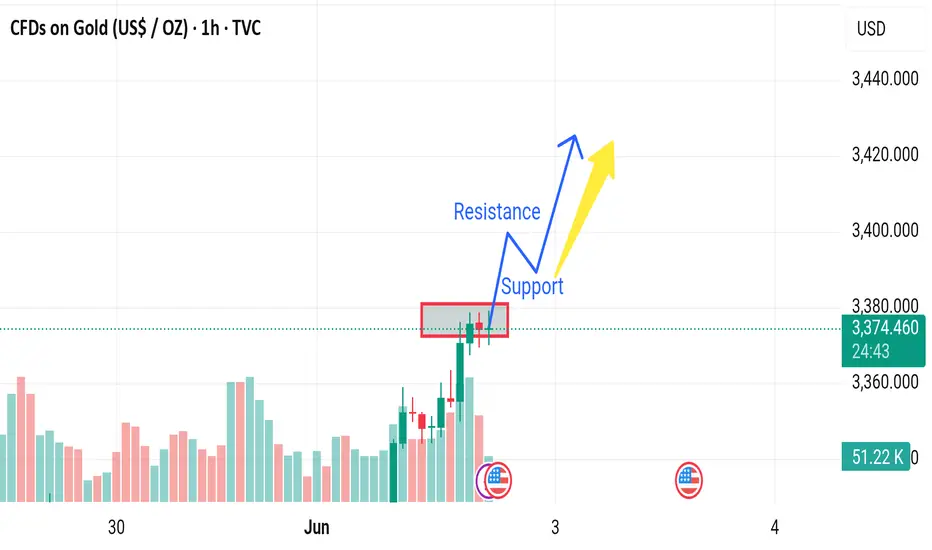
Market next move 🔻 1. False Breakout Risk
Price is hovering right at the resistance-turned-support zone.
The candles above this zone have long upper wicks, signaling rejection and selling pressure.
This may be a bull trap before reversal.
---
📉 2. Decreasing Bull Volume
Volume peaked earlier, but the most recent green candles are showing lower volume, suggesting weakening bullish momentum.
Lack of strong follow-through volume often precedes reversals.
---
🕳️ 3. Overextended Rally
Gold has moved sharply upward recently (over +2.5%).
There may be a need for a cooldown or retracement, especially if no fresh catalysts emerge.
---
⚠️ 4. Macro Factors Unpriced
The chart includes a U.S. event icon, likely representing upcoming economic data (e.g., Fed comments, job reports).
Any hawkish surprise (rate hike concerns, strong jobs report) could cause a sharp reversal in gold due to rising yields and a stronger USD.
Market next move 1. Bearish Rejection Zone
The red box highlights a consolidation/resistance zone.
BTC is struggling to break and close above this area.
Multiple candle wicks into the zone suggest seller strength.
---
📉 2. Volume Weakness
The recent upward candles show lower volume compared to the selling candles before it.
This indicates that the buying pressure may be weak, lacking momentum for a breakout.
---
🕳️ 3. False Breakout Trap Risk
A fakeout above the resistance box is possible if big players trigger buy orders and then reverse the market, trapping retail traders.
---
🟠 4. Bearish Divergence (if confirmed by RSI or MACD)
Without indicators shown, if momentum indicators like RSI/MACD display divergence (price up but momentum down), it’s a bearish signal.

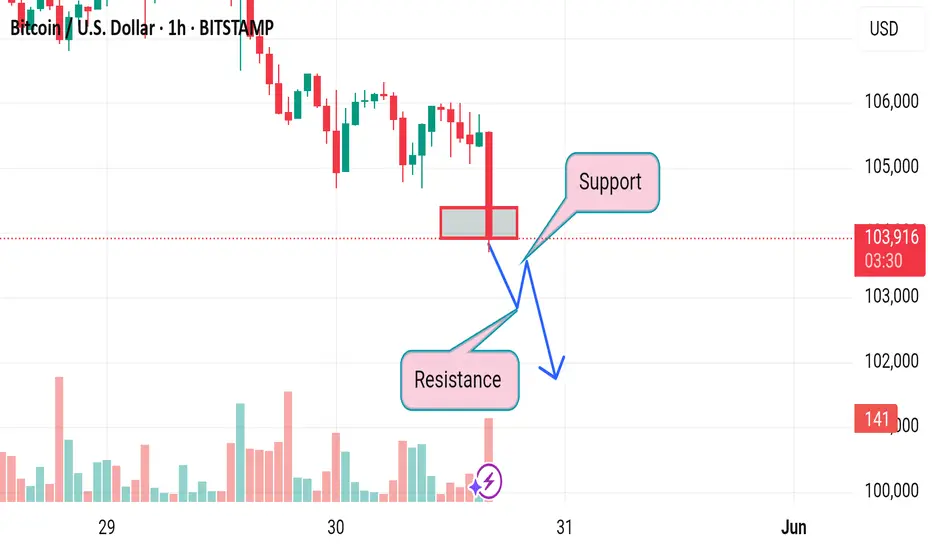
Market next move 🔍 Disruption of the Current Bearish Setup:
1. Mislabeling of Levels:
The chart labels a newly broken support as "Support" still, even though price has clearly broken below that zone.
In proper technical analysis, once support is broken, it often turns into resistance, so the labels should be reversed.
2. Premature Downside Projection:
The bearish arrow assumes continued downside immediately after the breakdown, but there’s no confirmation candle or retest yet.
This could easily be a false breakdown or a liquidity sweep below support before a bounce.
3. No Confirmation from Volume:
Volume spiked on the breakdown, but the follow-up candle doesn’t confirm seller continuation.
Absence of sustained volume makes the move questionable. It could be a trap for breakout traders.
4. Lack of Trend Context:
The chart doesn't consider the broader trend. If BTC was in a strong uptrend before this pullback, this could be a bullish retracement, not a true reversal.
Drawing a trendline or checking a higher timeframe would help validate the direction.
Market next move ⚠️ 1. Weak Bullish Continuation Signal
The current price action shows a rejection wick on a red candle, signaling selling pressure near the recent highs.
Despite the upward move earlier, this could be a short-term exhaustion rather than strength for further upside.
---
📉 2. No Follow-Through After Bullish Spike
There was a strong bullish candle earlier, but:
No significant follow-up to break past that level convincingly.
Price appears to have stalled or even reversed after that spike — possibly forming a bull trap.
---
🔄 3. Overhead Resistance at Target Area
The "TARGET" label sits near recent highs, which have already been rejected once.
Without clear breakout volume, this zone might act as resistance, not a logical next stop.

Market next target ⚠️ 1. Bearish Momentum Remains Intact
The last few candles are strongly bearish, with steep declines and high red candle volume.
Attempting to project an upside target amid this current bearish drive lacks alignment with actual market sentiment.
---
📉 2. Lack of Reversal Candlestick Patterns
There is no clear bullish reversal pattern visible at the point of target placement:
No hammer, bullish engulfing, or morning star pattern.
The price may just be pausing before continuing its downward trend.
---
🔊 3. Volume Discrepancy
The rising volume on red candles vs. low volume on recent green candles shows selling pressure outweighs buying interest.
A reliable bullish setup would typically come with higher buying volume after a selloff, which is not yet seen.
---
🧭 4. Misleading “Target” Location
The marked target is at a higher high, near 33.75–34.00 area, which:
Is not supported by immediate technical breakout
Seems to ignore the last failed attempt to break above that level
Appears overly optimistic given the current trend direction
