Market next move 🧠 Disruptive Analysis:
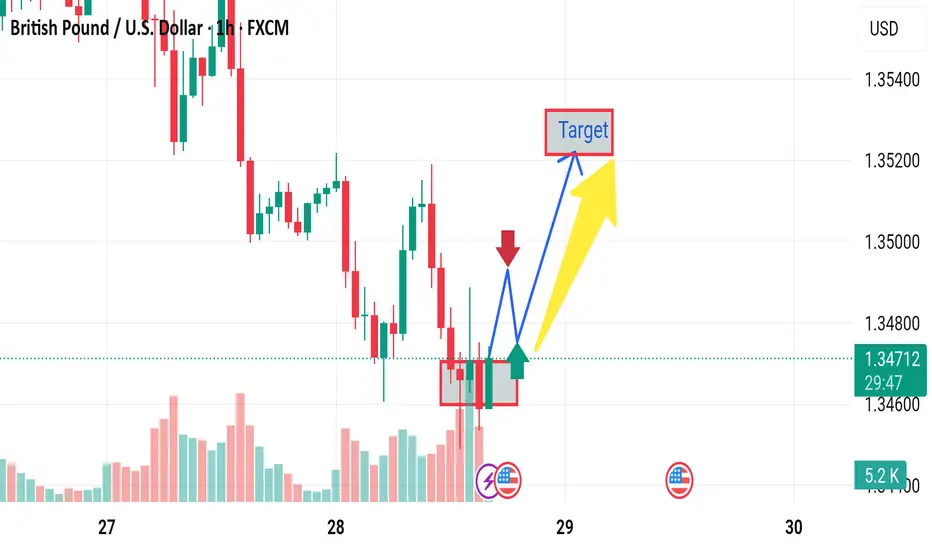
🔴 1. False Breakout Potential
The marked box shows a consolidation zone. While the green candle breaks slightly above it, this might be a trap (false breakout). If there's no strong follow-through, price may sharply retest or drop back inside the box—a classic bull trap.
🔴 2. Bearish Volume Profile
Volume spiked on the initial drop, and even though there's some green candle volume, it’s not convincingly higher than previous bars. This could imply weak buyer commitment at this level, suggesting a potential reversal downward.
🔴 3. Overhead Resistance
Even if price breaks out, it faces immediate resistance around 1.3485–1.3500, where multiple wicks formed earlier. This could stall or reject the move, invalidating the bullish "Target."
🔴 4. Economic Risk
The U.S. economic event icons below suggest incoming USD-related news. If the data is USD-positive (e.g., strong employment or inflation), it could strengthen the dollar and push GBP/USD lower, negating the bullish move entirely.
Forextrader
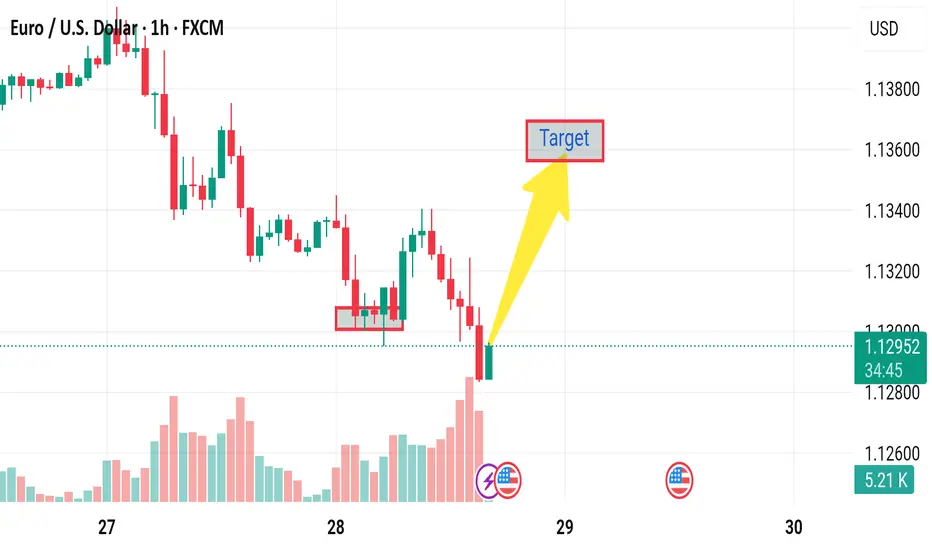
Market next move Current Analysis Breakdown:
Pair: EUR/USD on a 1-hour timeframe.
Recent Action: Sharp decline with a small bullish reversal candle.
Assumption: A potential bounce or reversal targeting the area marked as "Target."
Volume: Increased during the decline and slightly bullish at the last candle.
Technical Area: The “Target” is set above the current price, implying a bullish move is expected.
---
Disrupting the Analysis:
Let’s introduce potential bearish or contrarian scenarios to question the bullish target assumption:
1. False Reversal / Dead Cat Bounce
The small green candle after a strong red volume drop could simply be a temporary retracement or a dead cat bounce—a short-lived recovery before the price resumes falling.
2. Volume Analysis Contradiction
While volume has increased, the spike occurred mostly during red candles (bearish). This indicates strong selling pressure, not accumulation. The green candle’s volume is relatively small, suggesting weak buyer interest.
Silver (XAG/USD) Analysis Using Mirror Market Concepts + Target📌 Overview:
In this analysis, I’ve applied MMC (Mirror Market Concepts) to Silver’s recent price action. MMC helps traders like us identify symmetry, psychological zones, and repetitive structures in the market. This chart is a textbook example of how buyers and sellers leave patterns behind that we can mirror to predict what comes next.
Let’s dig deep into this elegant setup 👇
📈 1. The Curve Zone Support – Foundation for the Move
At the base of the chart, you’ll notice a curved support zone drawn in black. This isn’t just any random support—this is a rounded structure that shows how price gradually transitioned from bearish to bullish over time.
This Curve Zone Support indicates:
Sellers are getting exhausted.
Buyers are quietly stepping in, absorbing all sell-side pressure.
The market is preparing for an upside breakout.
This zone also aligns with mirror behavior—what price did before, it's setting up to do again.
🟣 2. Mirror Market Concepts in Action
MMC teaches us to reflect past structures into the future. Here’s how it plays out:
Previous dips into the curve zone were followed by strong bullish pushes.
Recent price action mimics earlier structures, forming mini-cups and curved bases.
This behavior suggests that Silver is mirroring its own bullish reversal structure again.
It’s like watching history repeat itself—with new energy.
🟡 3. Demand Zone + Break of Structure (BOS)
Around the $33.00 level, price dipped into a marked demand zone (highlighted in light purple). This is where buyers jumped back in and pushed price up again—proving strong interest at this level.
You’ll also notice a Minor Break of Structure (BOS) above this demand zone, showing:
A small, but significant shift in market sentiment.
Short-term trend change from bearish to bullish.
Fuel for the next leg up.
This BOS acts as confirmation that price is ready to move toward the target.
🎯 4. Targeting Major Resistance – $34.50 Zone
The ultimate goal is the Major Resistance Zone around $34.50. This zone has been tested before and caused strong rejections. But here’s the key difference now:
Price is approaching this level with momentum, structure, and buyer interest.
If MMC continues to play out, this zone could be taken out or at least retested for potential breakout continuation.
This area is marked as your Target Zone and is aligned with the mirrored projection.
🧠 5. What the Market Psychology Tells Us
Let’s not just read candles—let’s read the mind of the market:
Buyers are patiently absorbing every dip.
Sellers are losing control at each attempt to push price down.
The curve base structure is signaling accumulation.
Demand zones are holding perfectly.
Minor BOS adds more weight to bullish bias.
All these are classic MMC psychological footprints.
⚙️ Trade Plan (Educational Purpose Only):
🔹 Bullish Bias:
Entry: On confirmation above the minor BOS or demand retest.
Stop: Below the recent demand zone.
Target: $34.50 Major Resistance area.
🔹 Bearish Watch:
If price rejects from the curve or fails to hold above demand zone…
Price could revisit $32.50 or lower to re-test curve zone again.
📘 Final Thoughts:
This chart is a masterclass in how Mirror Market Concepts work. From the curve zone support to the demand hold, and now a clear target in sight, everything is lining up beautifully.
If you’re a price action trader, this is the kind of structure you wait weeks for.
If the bullish scenario plays out, we could see Silver make a strong run toward the $34.50 resistance zone in the coming days.
Keep your eyes on:
Curve zone support holding
Demand confirmation

Market next target
⚠️ Disruption Points:
1. Dubious Support Zone
The boxed zone (highlighted as support) shows multiple rejections but no clear bullish rejection candles (e.g., no hammer, bullish engulfing).
This may be a false base forming before another breakdown, especially with declining volume.
2. No Confirmed Reversal Pattern
The chart lacks a proper reversal structure like a double bottom, inverse head-and-shoulders, or bullish divergence.
A few sideways candles ≠ trend reversal—this might just be consolidation before further drop.
3. Weak Buyer Commitment
Volume has steadily decreased as the price attempted to base out.
If buyers were serious, we’d expect to see surging green volume bars, not this tapering activity.
4. Downtrend Still Dominant
The overall market structure is still lower highs and lower lows.
Jumping into a long trade against the trend without a confirmed break above the last swing high (≈1.13250) is premature.
5. Risk-Reward Imbalance
The arrowed path assumes an ideal rise without considering realistic pullbacks or market resistance.
If a stop is set below 1.12800 (support low) and the target is 1.13400, reward is tight compared to the risk, especially if price continues chopping sideways.
EUR/NZD Short and CAD/JPY ShortEUR/NZD Short
Minimum entry requirements:
• If tight non-structured 5 min continuation forms, reduced risk entry on the break of it.
• If tight structured 5 min continuation forms, reduced risk entry on the break of it or 5 min risk entry within it.
• If tight non-structured 15 min continuation forms, 5 min risk entry within it if the continuation is structured on the 5 min chart or reduced risk entry on the break of it.
• If tight structured 15 min continuation forms, reduced risk entry on the break of it or 15 min risk entry within it.
CAD/JPY Short
Minimum entry requirements:
• Tap into area of value.
• 1H impulse down below area of value.
• If tight non-structured 5 min continuation follows, reduced risk entry on the break of it.
• If tight structured 5 min continuation follows, reduced risk entry on the break of it or 5 min risk entry within it.
• If tight non-structured 15 min continuation follows, 5 min risk entry within it if the continuation is structured on the 5 min chart or reduced risk entry on the break of it.
• If tight structured 15 min continuation follows, reduced risk entry on the break of it or 15 min risk entry within it.

Market next move Original Analysis Summary:
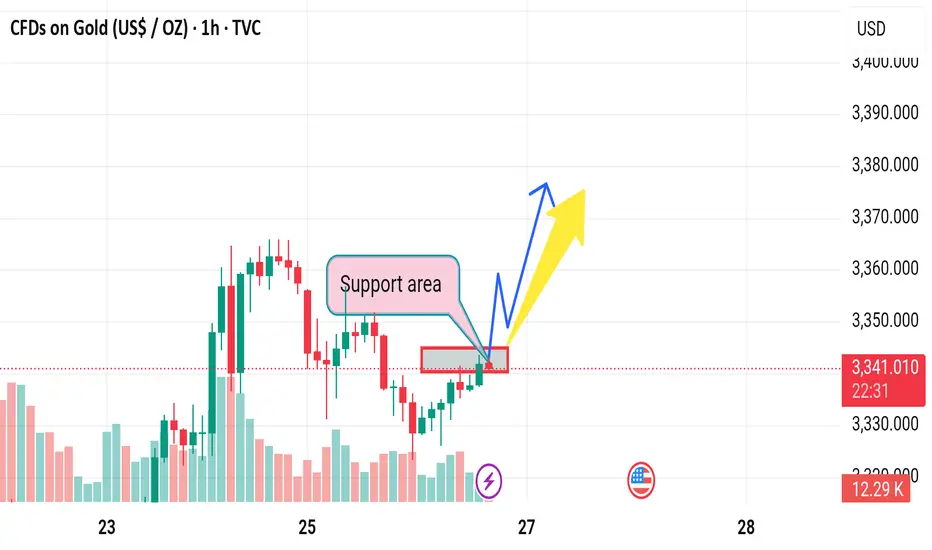
The chart shows a support area around the 3340 USD level.
There are two bullish scenarios outlined with blue and yellow arrows, implying a price increase from the support zone.
---
Disruption/Critical Analysis:
1. Overreliance on Short-Term Support:
The chart assumes the marked support area will hold, but no confirmation (like a bullish candlestick pattern or strong buying volume) is evident yet. A break below that zone could lead to a bearish move instead.
2. Volume Weakness:
Recent candles near the support zone are not backed by significantly increasing volume. This suggests weak buying interest, making the bullish forecast potentially over-optimistic.
3. No Consideration of Macroeconomic Events:
The chart doesn't factor in fundamental drivers (like U.S. economic data, Fed announcements), which can easily invalidate technical patterns.
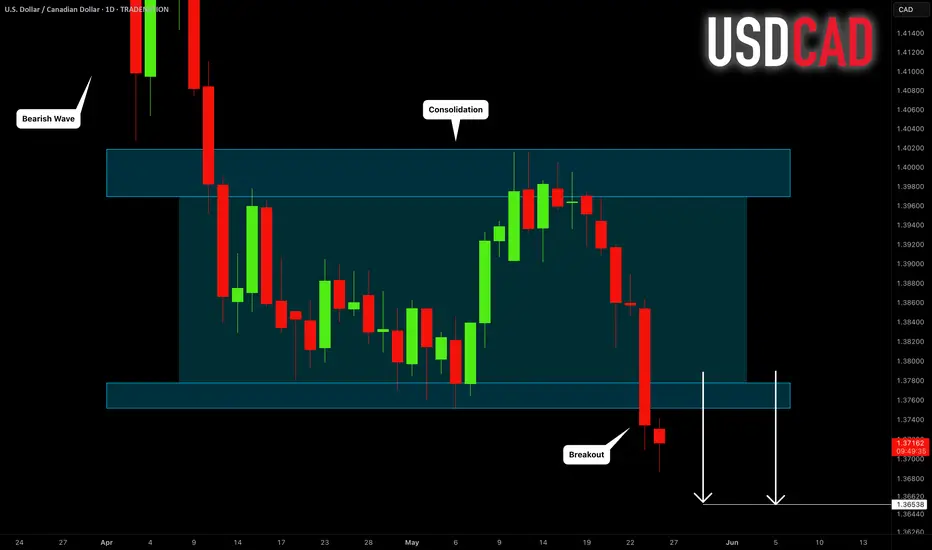
USDCAD: Bearish Outlook For This Week Explained 🇺🇸🇨🇦
USDCAD will likely continue a bearish trend that the market
established in February.
A bearish breakout of a support line of a horizontal parallel
channel on a daily provides a strong confirmation.
Next goal - 1.3655
❤️Please, support my work with like, thank you!❤️
I am part of Trade Nation's Influencer program and receive a monthly fee for using their TradingView charts in my analysis.
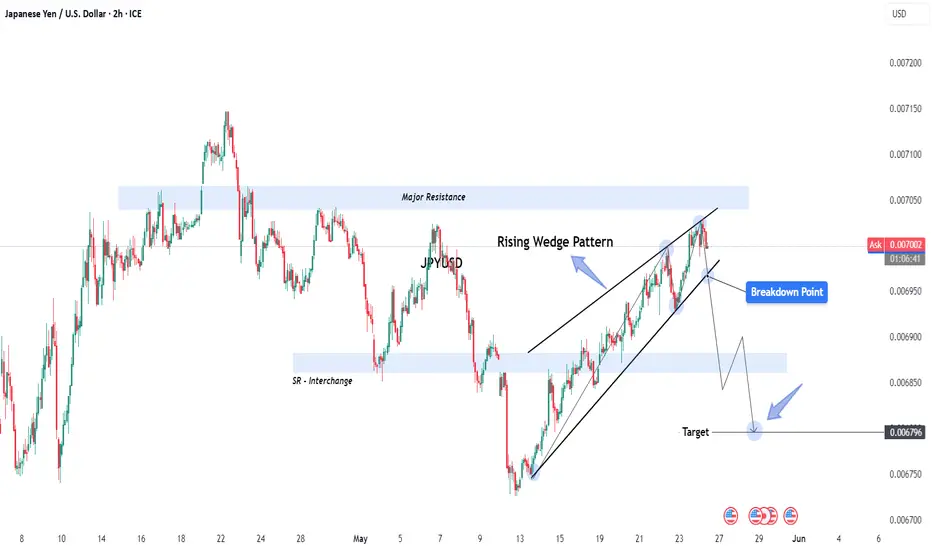
JPY/USD Rising Wedge Breakdown – Bearish Reversal in Play🔎 Technical Breakdown:
1. Rising Wedge Formation:
The pair has been trading within a Rising Wedge, a bearish reversal pattern that forms when price makes higher highs and higher lows but with diminishing momentum. The wedge is visible from the swing low on May 13, where price began to climb aggressively but within increasingly narrow price action. This narrowing range signals weakening bullish strength.
2. Key Resistance Zone:
The wedge forms right below a Major Resistance Zone marked earlier in the chart (around 0.007050), where price had previously faced heavy selling pressure. This adds confluence to the bearish bias, as the zone historically acted as a turning point.
3. SR Interchange Zone:
Below the wedge lies a Support-turned-Resistance (SR) Interchange level, a critical price area where past support may now act as resistance if the price attempts to retrace. This is a commonly watched level by institutional and technical traders.
4. Breakdown Confirmation:
The price has broken below the wedge's lower trendline, which is often considered the breakdown signal. A valid breakdown typically includes a close outside the wedge body followed by a retest or continuation.
5. Bearish Target:
The projected move is toward 0.006796, derived by measuring the wedge height and applying it from the breakdown point. This level aligns with a historical support zone, adding more confluence to the target.
🧠 Psychological & Structural View:
Bullish exhaustion: Buyers pushed price higher into resistance, but momentum slowed, signaling exhaustion.
Trapped longs: Traders who entered late in the wedge may now be trapped, potentially accelerating a sell-off as they exit.
Smart money behavior: Rising wedges near resistance often signal distribution by smart money before a drop.
🛠️ Trading Plan Suggestion (Not Financial Advice):
Entry: After a clear wedge breakdown, consider short entries on a retest of the broken trendline or a bearish candle confirmation.
SL: Above the wedge high or major resistance zone.
TP: Staggered exits below 0.006850 and final target around 0.006796.
🔁 What to Watch For:
Retest of the wedge breakdown (potential short entry zone)
Momentum confirmation via volume or bearish candles
Price reaction at SR Interchange and final support target
🧠 Minds Section – Condensed Summary
JPY/USD formed a Rising Wedge below major resistance, signaling bullish exhaustion. Price has broken down from the wedge, confirming bearish momentum. A clean breakdown targets 0.006796, with SR interchange acting as a minor support. A retest of the wedge breakdown could offer a good short opportunity.
EUR/AUD Short, CAD/JPY Short and GBP/AUD LongEUR/AUD Short
Minimum entry requirements:
• If structured 1H continuation forms, 1H risk entry within it.
CAD/JPY Short
Minimum entry requirements:
• Break above area of value.
• 1H impulse down below area of interest.
• If tight non-structured 15 min continuation follows, 5 min risk entry within it if the continuation is structured on the 5 min chart or reduced risk entry on the break of it.
• If tight structured 15 min continuation follows, reduced risk entry on the break of it or 15 min risk entry within it.
GBP/AUD Long
Minimum entry requirements:
• Break below area of value.
• 1H impulse up above area of value.
• If tight non-structured 5 min continuation follows, reduced risk entry on the break of it.
• If tight structured 5 min continuation follows, reduced risk entry on the break of it or 5 min risk entry within it.
• If tight non-structured 15 min continuation follows, 5 min risk entry within it if the continuation is structured on the 5 min chart or reduced risk entry on the break of it.
• If tight structured 15 min continuation follows, reduced risk entry on the break of it or 15 min risk entry within it.
EUR/USD Short
Minimum entry requirements:
• 1H impulse down below area of value.
• If tight non-structured 5 min continuation follows, reduced risk entry on the break of it.
• If tight structured 5 min continuation follows, reduced risk entry on the break of it or 5 min risk entry within it.
• If tight non-structured 15 min continuation follows, 5 min risk entry within it if the continuation is structured on the 5 min chart or reduced risk entry on the break of it.
• If tight structured 15 min continuation follows, reduced risk entry on the break of it or 15 min risk entry within it.

GOLD Short Setup – OB Rejection + FVG Play to Weak Low 📉 XAUUSD | 4H Short Setup – Classic Smart Money Reversal Zone
Gold is giving us a prime reversal opportunity off a stacked supply zone, aligning with:
🔵 79% Fibonacci Retracement
🟪 High-Timeframe Order Block (OB)
🚫 Failure to create a new high (bearish intent confirmed)
Let’s break it down:
🔻 1. Price Structure Insight
Clean swing high printed near 3400
Retraced down to a discount zone, then sharply reversed
Price now tapping into a premium supply zone between 70.5% – 79% Fib
🟣 2. Key Zone Confluence
📍 Order Block: The final up-candle before a massive drop = institutional sell zone
📍 Fibonacci Levels: 70.5%–79% = premium sell levels
📍 Internal Liquidity: Price swept local highs before stalling
📍 Strong High Above: Untouched = inducement for future sweep (or rejection fuel)
Everything screams Smart Money Sell Setup 📉
🎯 3. Trade Idea
Sell Entry: Around 3,348
Stop Loss: Above OB & Strong High ~ 3,390
Take Profit: 3,120 (clear weak low = liquidity pool)
⚖️ 4. Risk-Reward Ratio (RRR)
📥 Entry: 3,348
🔒 SL: 3,390
💰 TP: 3,120
✅ RRR ≈ 1:5.4
Perfect textbook SMC setup—high confluence + asymmetric RRR = 🔑
🧠 5. Why This Setup Works
Retail traders are lured into longs after bullish push
Smart Money taps OB, rejects hard at premium
Target: internal liquidity resting at weak low (3120)
This creates a controlled sell-off that avoids grabbing the strong high
🟢 Drop a “GOLDEN SHORT 🪙💥” if you caught this setup before the crowd
💾 Save it for reference – this is how institutions trap liquidity
📤 Share with your trading fam — this setup is 🔥🔥🔥

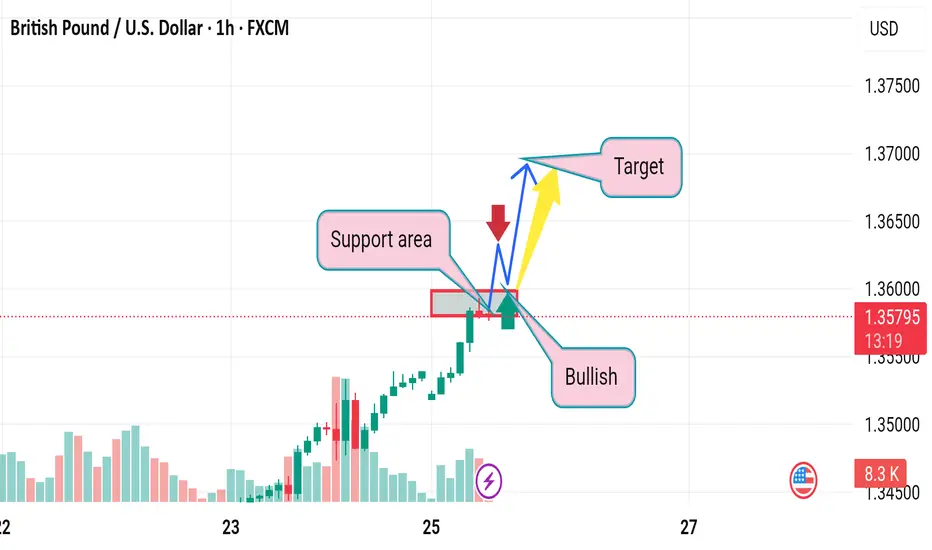
Market next move Original Analysis Summary:
Identifies a bullish structure breaking above a support area.
Projects a potential continuation to higher targets.
Suggests consolidation and bounce from support before climbing.
---
Disruptive Bearish Interpretation:
1. Lower High Possibility:
Recent price action might be forming a lower high rather than a continuation signal, signaling weakness in buying pressure.
2. Volume Imbalance:
Notice how the large green candle was followed by lower bullish volume, suggesting buying momentum is fading.
3. Breakout Trap:
The "Support area" may instead be a liquidity zone where breakout traders entered long positions and could now be trapped. A break below this area could cause a panic sell-off.
4. Trendline Respect (Rejection):
Price is currently retesting the underside of a descending trendline — a common reversal spot.

Market next target
Original Analysis Summary:
Identifies a bullish breakout above a support zone.
Expects continuation upward to a target zone after minor pullback.
Assumes support holds and bullish trend continues.
---
Disruptive Bearish Interpretation:
1. Fakeout Risk (Bull Trap):
Price broke above the support area, but this could be a false breakout designed to lure in long positions before a reversal.
2. Trendline Retest Failure:
The price is testing a trendline or resistance zone. Failure to break above this area could indicate rejection and reversal.
3. Bearish Divergence:
If momentum indicators (e.g., RSI or MACD, not shown here but inferred) show divergence, it may warn of weakening bullish strength despite price rising.
4. Candlestick Exhaustion:
Recent candles show upper wicks and slowing momentum — a common sign of potential exhaustion.
Market next move Original Analysis Summary (Bearish):
Support area is being tested.
Arrows suggest a breakdown below support with targets around 3,280–3,240.
Volume shows a slight increase, possibly hinting at selling pressure.
---
Disruptive Bullish Interpretation:
1. False Breakdown Trap:
Price may briefly dip below support (bear trap) to flush out weak holders before bouncing back strongly.
This would invalidate the bearish scenario and trigger short covering.
2. Volume Analysis:
Although red candles dominate, the volume spike could also indicate buying absorption at this level.
Hidden accumulation may be underway.
3. Support Holding Well:
The support zone has been tested multiple times and still holds — which can also be interpreted as strong buying defense rather than weakness.
4. Potential Bullish Reversal Pattern:
If a bullish candlestick formation like a hammer or engulfing forms near the support zone, it could signal reversal back to the upside.
Target back to 3,380–3,400+ becomes viable.

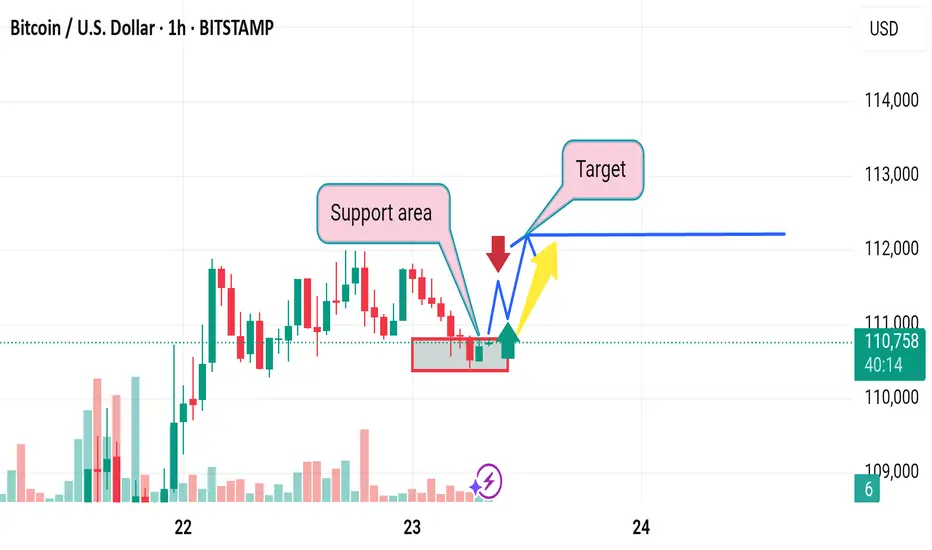
Market target 1. Support Area Assumption
Disruption: The highlighted support area is relatively narrow and based on a few candles. On a 1-hour chart, this might not provide a strong enough foundation for a meaningful bounce. The price has tested this level multiple times, suggesting weakening support rather than strength.
2. Target Projection
Disruption: The target area is drawn without showing how it was calculated—no Fibonacci level, previous resistance, or volume zone is referenced. Without clear technical justification, the target level appears speculative.
3. Pattern Expectation (Bounce Prediction)
Disruption: The blue arrow suggests a bullish reversal, but volume is declining, and there’s no strong bullish candle yet to confirm the move. In fact, multiple lower highs suggest bearish pressure.
4. Ignoring Bearish Continuation
Disruption: The red arrow suggesting a drop isn't emphasized as strongly as the bullish path. However, repeated testing of the support with no significant bounce increases the risk of a breakdown. Also, if macroeconomic conditions or broader crypto sentiment is bearish, this chart setup could break down easily.
5. Lack of Context
Disruption: The chart analysis is isolated to a short timeframe (1 hour). Without higher timeframe confluence (e.g., 4H, Daily), any short-term pattern can easily be a false signal.
GBP/JPY (Trade Recap) and EUR/JPY ShortEUR/JPY Short
Minimum entry requirements:
• If structured 1H continuation forms, 1H risk entry within it.

Market next move Original Analysis Summary:
Price has entered a support area and is expected to bounce.
Two possible bullish paths (blue & yellow arrows) suggest a continuation toward the marked target zone.
---
Disruption Thesis: Bearish Reversal Setup
1. Overextended Rally Into Resistance
The move up into the “support area” is sharp and fast, suggesting it's a liquidity grab.
This zone might actually be a supply zone, where smart money is offloading.
Disruption Call: Price could stall or reverse sharply from this area due to lack of follow-through volume.
---
2. Volume Profile Weakness
Volume peaked earlier in the rally and is now diminishing, which often signals buyer exhaustion.
Disruption Call: Fading bullish momentum implies a fakeout, not a breakout.
---
3. False Breakout / Bull Trap
The green arrow assumes a bounce, but price may just be hovering to bait longs before dropping.
Previous swing highs near 1.1320 may act as a strong rejection point.
Disruption Call: A sudden drop below 1.1300, with a new bearish wave back to 1.1250 or lower.

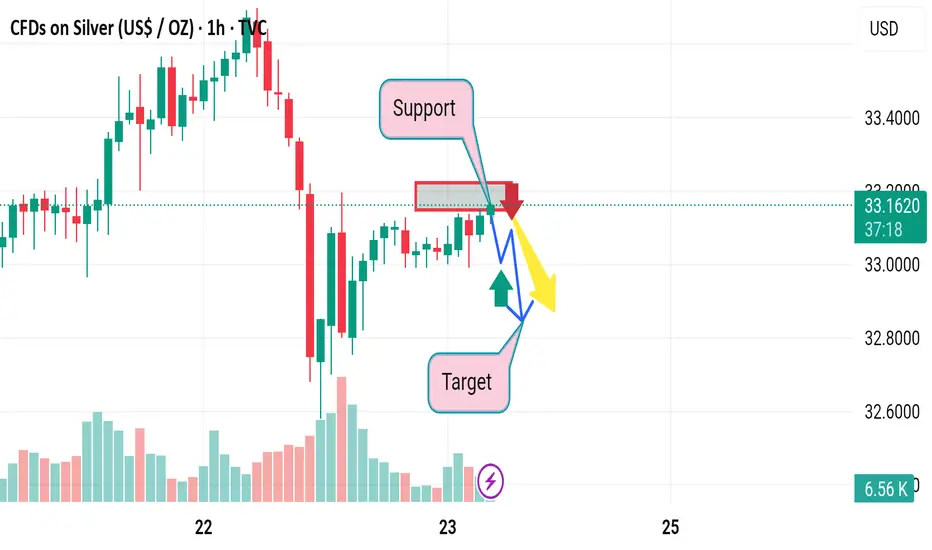
Market next move Original Analysis Recap:
Support Zone marked just below the current price.
Bearish Move Expected (red arrow) from current resistance.
Bullish Bounce Expected after initial drop (blue and yellow arrows).
Target is placed lower than current price, implying expected downward movement.
---
Disruption / Contrarian Thesis:
1. Fakeout to the Downside (Bear Trap)
The analysis assumes a rejection at resistance and a drop, but:
After the large red candle previously, the market may have absorbed all selling pressure.
Current consolidation shows higher lows—suggesting hidden buying.
Disruption Call: A quick dip below support (triggering stops), followed by a strong bullish reversal breaking through the resistance zone.
---
2. Volume Insight Ignored
Note that recent volume spiked on green candles during recovery.
Current retracement has lower volume, suggesting it may be a pause in uptrend (not a reversal).
Disruption Call: This is accumulation, not distribution. A breakout above 33.20 could happen, aiming for 33.40 or higher.
---
3. Structural Misinterpretation
The “support” identified may not be valid—it’s part of the consolidation range.
True demand zone could be deeper, around 32.90–33.00.
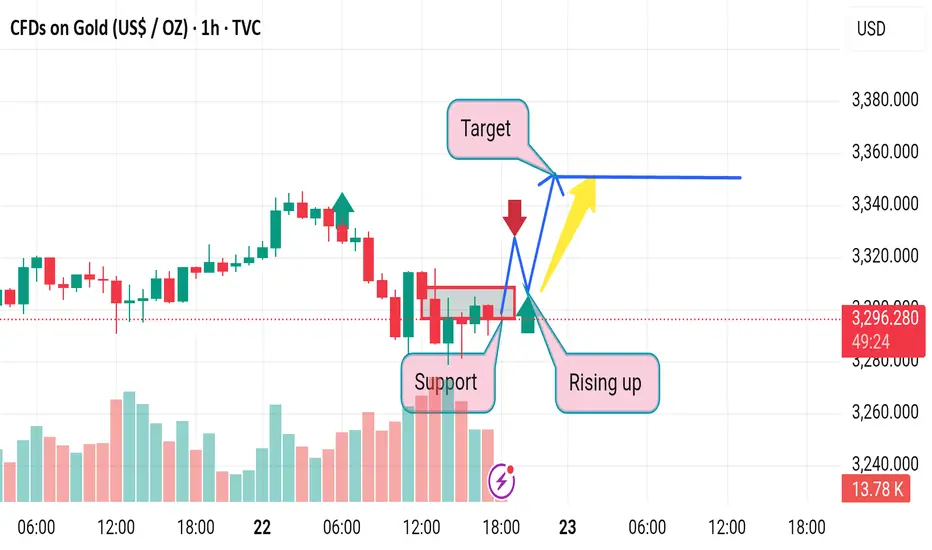
Market rising up Original Analysis Overview:
Support Zone: Clearly marked.
"Flying" Point: Suggests a bullish breakout.
Target: Indicates price will rise significantly.
Arrows: Imply breakout is likely to follow bullish momentum.
---
Disruption / Contrarian Viewpoint:
1. False Breakout Risk
The tight consolidation just above the support line might indicate a bull trap—a false breakout intended to lure in long positions before a sharp reversal. The “flying” point might instead be a liquidity hunt.
Disruption Call: Expect price to briefly break above resistance and then drop below support, invalidating the bullish thesis.
2. Volume Divergence
Volume is not significantly increasing at the breakout point. True breakouts typically come with a volume surge.
Disruption Call: Weak volume suggests lack of conviction. Price may revert back into the range or breakdown.
3. Macro Sentiment Shift
If macroeconomic news (e.g., Fed policy, USD strength) flips bearish for gold, technical setups may get invalidated.

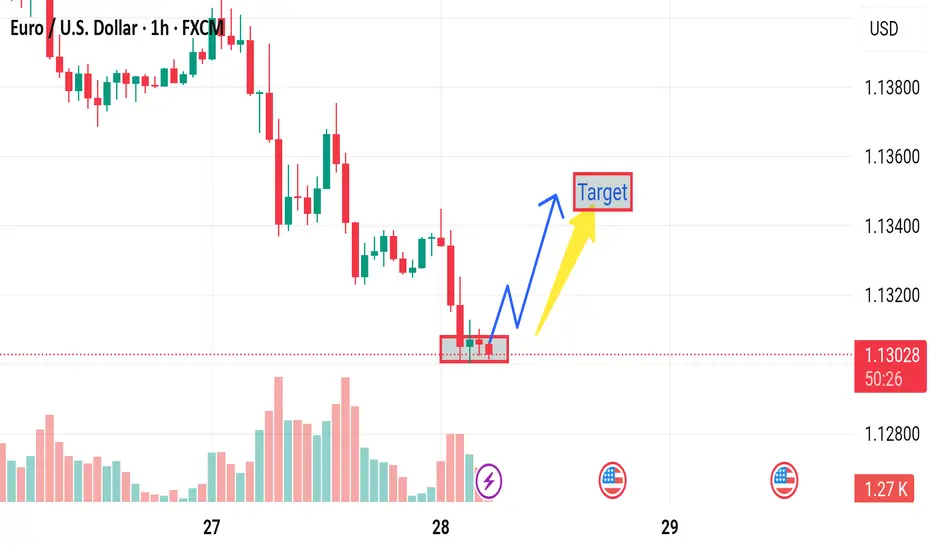
Market next move
1. Support Zone Validation
Observation: Price is reacting from a labeled “Support area.”
Disruption: The support zone is based on very recent price action with limited prior structure. No confirmed double bottom, bullish engulfing, or strong rejection candle is present to confirm it as strong support yet.
---
2. Volume Context Ignored
Observation: Volume has declined during recent candles.
Disruption: A genuine reversal from support typically comes with a volume spike. The current volume profile shows weakening participation, which questions the strength of the bounce.
---
3. Premature Long Target Projection
Observation: A bullish arrow targets the 1.134–1.135 zone.
Disruption: This target is overly optimistic given the lack of a trend change signal. Price is still in a clear lower-high and lower-low structure, suggesting bearish momentum remains intact unless a breakout above 1.1300 occurs.
---
4. Bearish Scenario Underdeveloped
Observation: Only a single red arrow shows bearish rejection.
Disruption: There is no defined breakdown zone or bearish continuation pattern shown (e.g., flag or wedge). If support breaks, price could rapidly move to 1.1200, but this scenario is underrepresented.
---
5. No Confirmation Candlestick for Bullish Entry
Observation: A bullish move is anticipated from current levels.
Disruption: The current candle structure does not confirm bullish control—no hammer, engulfing, or clear reversal pattern. Entering long here could be premature without that confirmation.
---
6. Lack of EMA or RSI Confluence
Observation: Analysis is purely price-action based.
Disruption: No exponential moving averages (EMAs) or RSI are shown to validate trend change. These tools could help confirm divergence or trend reversal.

Market falls downward
1. Resistance Zone May Be Weak
Observation: A red rectangle marks a resistance area.
Disruption: This "resistance" level is based on a short-term bounce and may not have strong historical confluence. It lacks multiple rejections to establish it as a true resistance zone.
---
2. Overemphasis on Bearish Bias
Observation: Two bearish paths (blue and yellow) dominate the projection, indicating an expected drop.
Disruption: This may be prematurely bearish. There's no confirmation of rejection yet—no strong bearish candlestick pattern (like a shooting star, engulfing, or evening star) is visible in that zone.
---
3. Lack of Bullish Consideration
Observation: A small green arrow is shown but not given much weight.
Disruption: The recent candles show higher lows, indicating potential bullish pressure. If price breaks above the marked zone, it may trigger a short squeeze rally.
---
4. Volume Misalignment
Observation: Volume spikes during the bounce, especially on the green candles.
Disruption: Rising volume on a recovery typically supports continuation upward. This analysis ignores the bullish volume context and instead forecasts reversal.
---
5. No Higher Timeframe Confluence
Observation: 1-hour chart used in isolation.
Disruption: A strong bearish or bullish direction on the 4H or Daily chart would validate or invalidate this local setup. Without it, the trade thesis lacks broader context.
Flying upward 1. Assumption of Support
Observation: The "Support" zone is marked around the 3,285–3,290 level.
Disruption: This area has only a few touches and lacks clear validation. Support should be confirmed with multiple bounces and strong volume reactions. Here, volume is present but inconclusive.
2. Overly Optimistic Target
Observation: The target area is set around 3,350, which assumes a clean breakout.
Disruption: This ignores potential resistance levels between 3,310–3,330 that could act as hurdles. The price might stall or reverse before reaching that far.
3. Breakout Path Assumptions
Observation: The blue arrows suggest a bullish breakout, possibly after a retest.
Disruption: There's a strong red rejection candle marked by a red arrow—suggesting bearish momentum. Without strong bullish confirmation (like a bullish engulfing or volume spike), this breakout path is speculative.
4. Lack of Broader Context
Observation: The chart is isolated to a 1-hour timeframe.
Disruption: No higher timeframe trend is considered. If the 4H or Daily chart shows a downtrend, this small support could be insignificant and might break.
5. Volume Analysis Gaps
Observation: Volume bars are visible but not integrated into the analysis.
Disruption: No divergence or volume support is identified. Rising prices without rising volume can indicate a weak move, increasing failure chances.
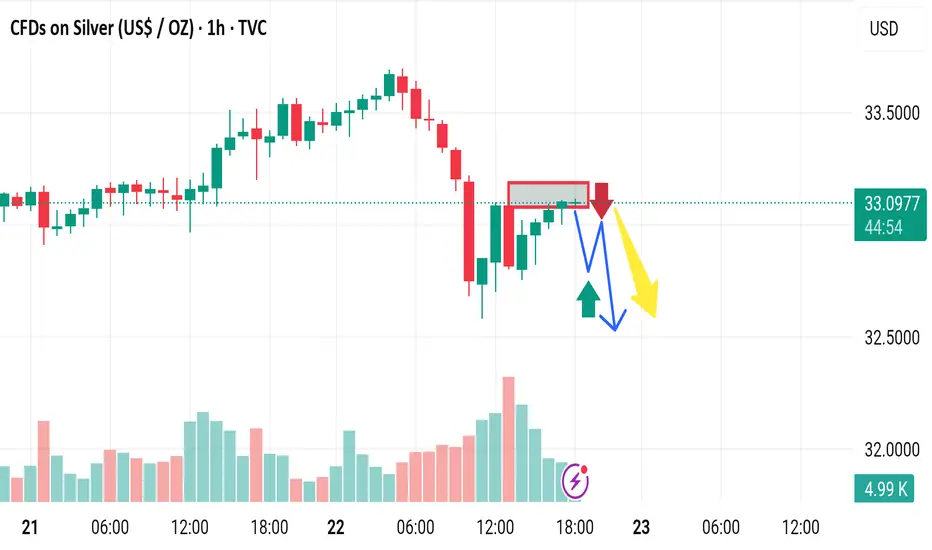
Market fall down 1. Weak Bearish Confirmation
Issue: The red arrow implies a confirmed downtrend, but the price action doesn’t show a strong breakdown—just a slight dip through a thin support zone.
Disruption: Without strong bearish candles or volume spikes, the breakdown could be a false move or liquidity grab before a reversal.
---
2. Overconfidence in Double Bottom Reversal
Issue: The blue “W” pattern and green arrow suggest a possible double bottom, but no clear second bottom has formed yet.
Disruption: Assuming a reversal prematurely is risky. The price may continue dropping, invalidating the bullish reversal scenario.
---
3. Target Placement Is Vague
Issue: The "Target" is placed arbitrarily along a horizontal line without referencing key resistance levels or technical confluences.
Disruption: Without support from Fibonacci, previous highs, or indicators, the target lacks reliability and could mislead trade planning.
---
4. Lack of Volume Context
Issue: The volume histogram shows a spike during a previous down move, but no current volume analysis is integrated into the decision.
Disruption: Price action alone, especially on lower timeframes, is insufficient without volume confirmation to validate breakouts or breakdowns.
---
5. No Risk Management Displayed
Issue: The analysis includes bullish and bearish paths but omits stop-loss levels or invalidation zones.
Disruption: Without clear invalidation, the trade becomes ambiguous and exposes the trader to unnecessary risk if price deviates unexpectedly.

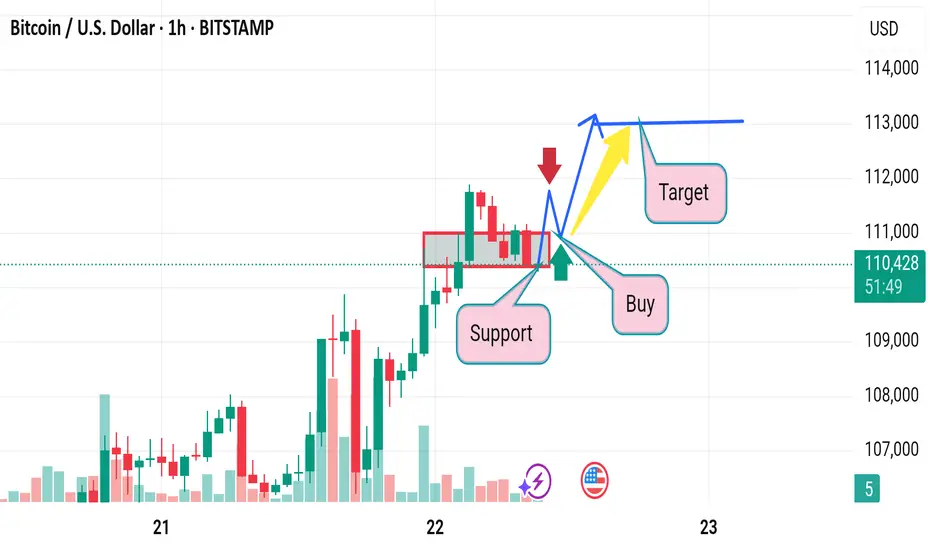
Market next move
1. Overreliance on Basic Support/Resistance
Issue: The analysis uses a simple support/resistance concept without clear validation (e.g., no multiple touches or volume confirmation).
Disruption: Support could easily break if there's insufficient volume or strong bearish sentiment, invalidating the buy signal.
---
2. Lack of Confirmation Indicators
Issue: There's no use of confirmation tools like RSI, MACD, or moving averages.
Disruption: Entering a "Buy" based purely on support without a reversal signal (like bullish divergence or candle patterns) increases risk.
---
3. Premature Target Setting
Issue: The target is drawn quickly after a minor dip, with no fib levels, pivot points, or historical resistance considered.
Disruption: The price might face resistance before reaching the “Target,” especially around previous highs or psychological levels.
---
4. Ignoring Downside Risk
Issue: The scenario assumes price will bounce back but doesn’t show a stop-loss or contingency for a breakdown.
Disruption: If price breaks the "Support" zone, it could trigger a stronger bearish move—this risk is not accounted for.
---
5. Misleading Arrows
Issue: Arrows (red, yellow, blue) seem speculative and oversimplified.
Disruption: They imply a clear path, which can mislead traders into thinking price action follows linear logic—real markets are more chaotic.