Gbpusd strong bearish read the caption Gbpusd on the 1 hour chart, we can see that we have an important zone around the 1.2581 level where the price reacted from several times. We can expect the buyers to step in again around this zone with a defined risk below it to position for a breakout above the trendline. The sellers, on the other hand, will want to see the price breaking lower to start targeting the key 1.25 support and eventually a break below it.
Forextrader
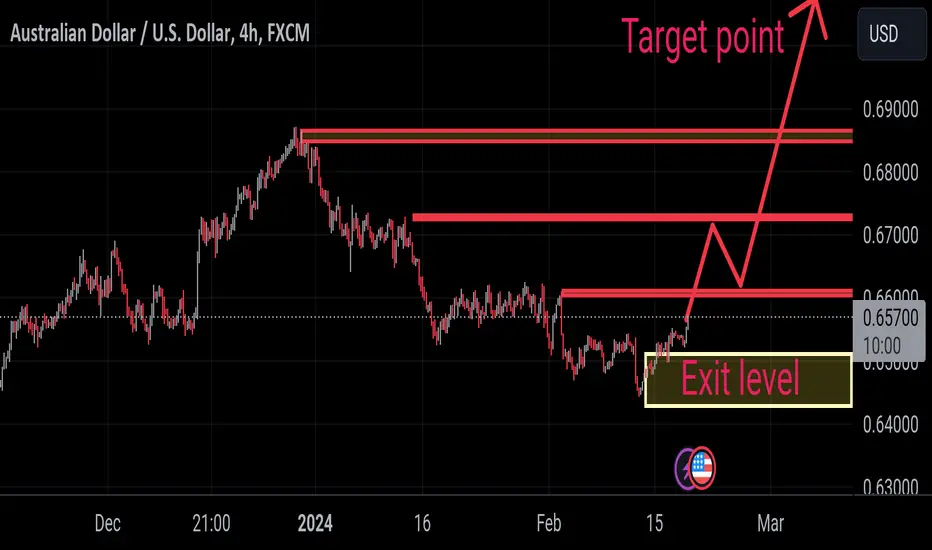
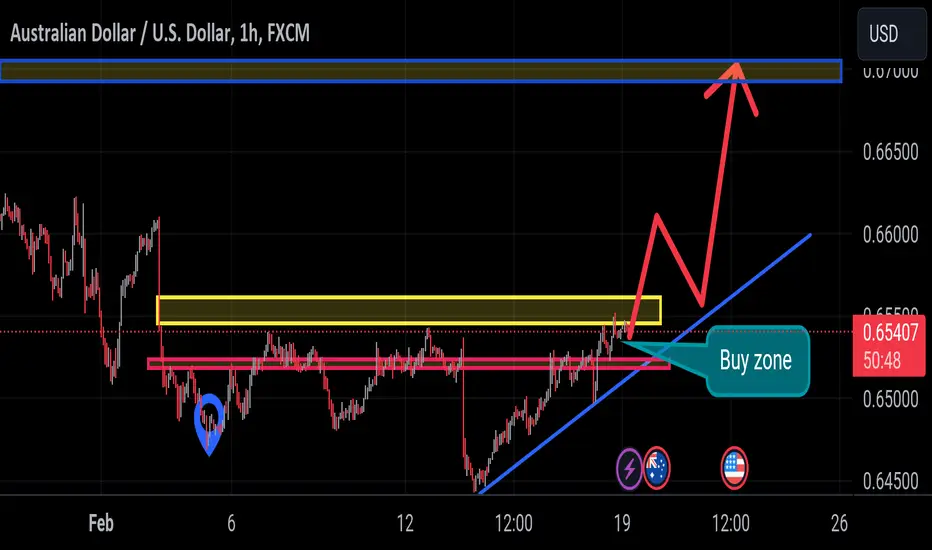
Audusd follow uptrend read the caption Audusd for quite a while. This is generally a sign of weakening momentum often followed by pullbacks or reversals. In this case, we got a pullback into the 0.6541 level but given today’s breakout, we might be in front of a reversal. We can see that the buyers kept on leaning on the red 21 moving average and if we get a pullback we can expect them to lean on it again
Usdjpy sell below downtrend read the caption USD/JPY is extending the consolidation from 150.87 and intraday bias remains neutral. Downside of retreat should be contained by 148.79 resistance turned support to bring another rally. Above 150.87 will resume the rise from 140.25 to 151.89/93 key resistance zone. Decisive break there will confirm larger up trend resumption of 155.51 projection level next. However, firm break of 148.71 will turn bias to the downside for 145.

Dxy sell break out read the caption The US Dollar I is holding its ground above 104.50 in a very calm start of the week. With US traders not present in the markets, expect very thin volumes to occur, on a Monday where volumes are often already rather on the low side compared to the rest of the week. Rather look for the middle of this week for things to finally come alive,

This week never buy usdchf only Sell read the caption Meanwhile, the Swiss franc is expected to face pressure in the longer term as investors see the Swiss National Bank (SNB) leading the rate cut cycle due to a sharp slowdown in the consumer price inflation data. Price pressures in the Swiss economy have remained below to start reducing interest rates after holding them higher for longer.

Gold going to slip on top level read the caption Gold On the 1 hour chart, we can see that the price has been consolidating ever since the big drop from the US CPI report. We now have a minor resistance zone around the 1999 level which is what the buyers will need to break to start targeting the 2015 resistance next. The sellers, on the other hand, will keep on defending the level with a defined risk above it to position for a drop into the 1977 level.

Audusd pump above go buy read the caption committee also pushed back slightly about when the first rate cut will happen. Jay Powell noted that the Fed will be less likely to start cutting in March as many analysts were expecting. The Fed is battling a situation of high inflation and strong economic growth.
The AUD/USD pair has rebounded slightly from its lowest point this month. It now sits slightly below the key resistance at 0.6541, where it has failed to move above recently. This price is along the neckline of the inverse head and shoulders pattern that has formed recently
Gbpusd down dips below read the caption On the 4 hour chart, we can see more closely the rangebound price action which is often hard to trade due to its erratic nature. The best strategy is generally to sit out and wait for a clear breakout supported by aThe GBP/USD pair retreated slightly after the latest US inflation data. According to the Bureau of Labor Statistics (BLS), the headline Consumer Price Index (CPI) rose by higher than the expected 2.7%. Core inflation rose by 3.8%, higher than the expected drop to 3.6%.
These numbers mean that inflation is still high in the country and that it will likely struggle to get to Fed’s target of 2.1%. It has remained between 3.2% and 3.3% in the past few months as the Fed has maintained rates at a 22-year high fundamental catalyst although one can also “play the range” by sell at support and selling at resistance.
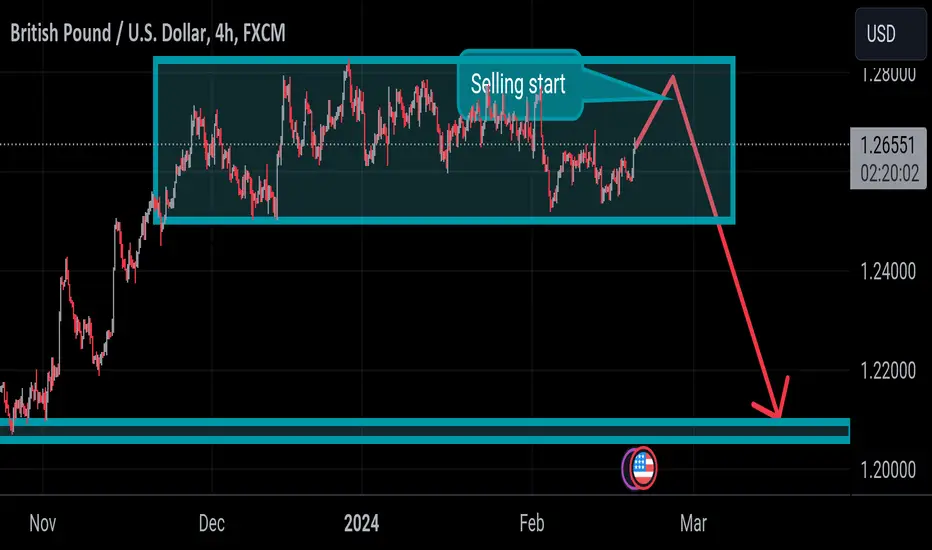
Gbpusd slip on the floor hit on the bottom read the caption Hot US inflation report justified the Fed’s pushback against early and aggressive interest rate cut expectations, triggering a fresh rally in the US Treasury bond yields and the US Dollar. In light of this, GBP/USD reversed sharply from the weekly high of 1.2681 to as low as 1.2572
The correction in the currency pair gained momentum on Wednesday after the annual CPI inflation in the UK remained unchanged at 4.0% in January, against the market forecast of an increase to 4.2%. reported month, missing estimates of 5.3%.

eurusd time short big downfall coming read the caption The EURUSD continued its run from earlier today, but did run into resistance at the 100-day MA at 1.0782. The price has since rotated lower and is now back down testing its 200 and 100-hour MAs at 1.0751 and 1.0747. Those levels are now the next barometer for this pair. Buyers have a shot to stall the fall and work back to the 100-day

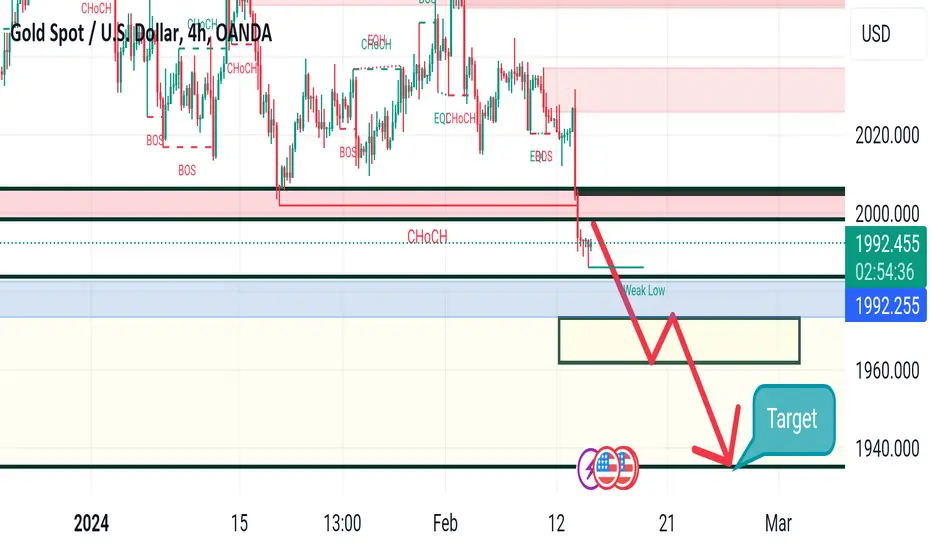
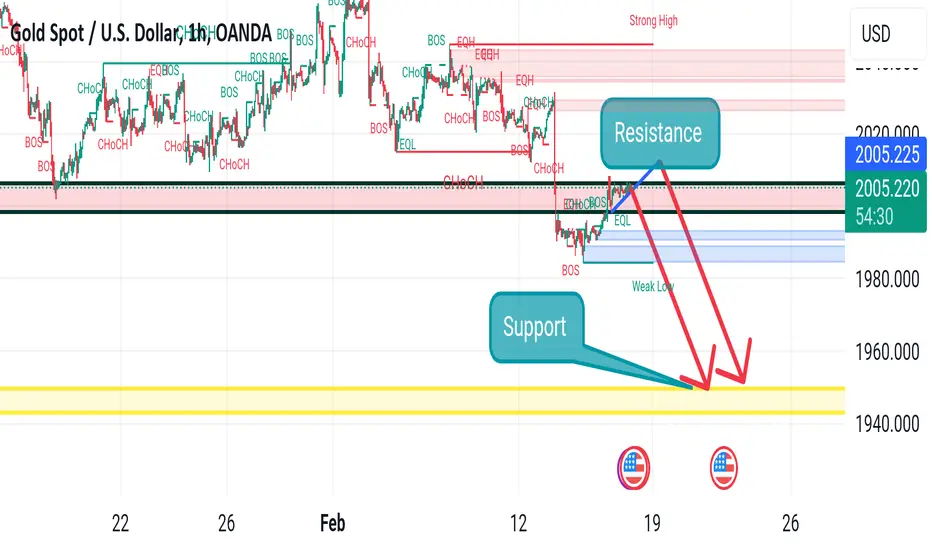
xauusd will hit below 1950 read the caption On the flip side, the 100-day SMA, currently around the $1,993-1,992 area, could act as immediate support ahead of the $1,985 region, or a two-month low touched on Wednesday. This is followed by the very important 200-day SMA, currently pegged near the $1,967 area, which if broken decisively will be seen as a fresh trigger for bearish trades. The Gold price might then accelerate the fall towards an intermediate support near the $1,955-1,951 zone en route to the November 2023 low, around the $1,938-1,935 region.
Audusd W chart always down read the caption zone around the 0.6050 level following the hot US CPI report. We continue to have a rangebound price action between the 0.6051 support and the 0.6151 resistance. The buyers will likely step in here with a defined risk below the support to position for a rally back into the resistance. The sellers, on the other hand, will want to see the price breaking lower to increase the bearish bets into the 0.56

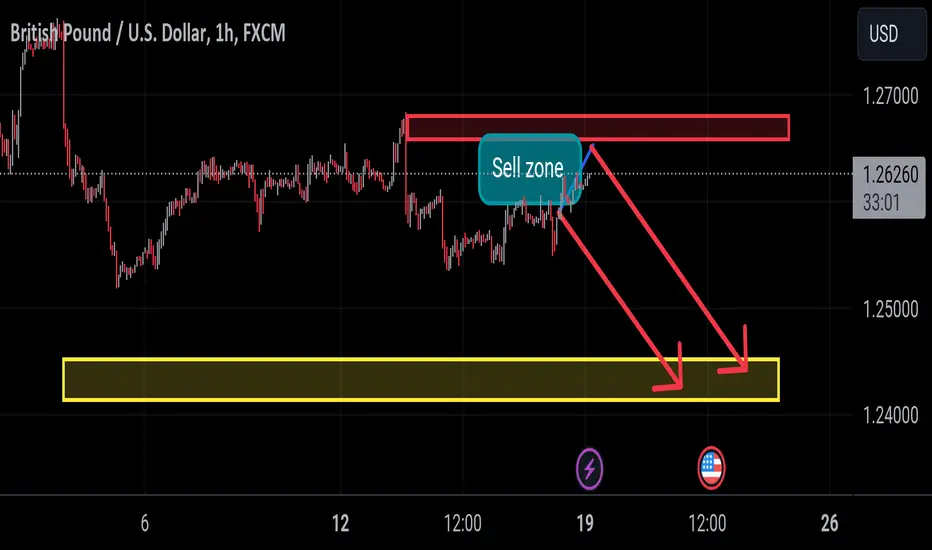
Gbpusd surely Fall down read the caption Gbpusd surely Fall down
The UK fell into recession in the second half of last year after GDP figures for the fourth quarter showed a steeper contraction than expected.
While a recession was expected ahead of the release, the fourth quarter number was slightly worse despite December performing better than anticipated.
The UK has been flirting with recession for some time but despite the inevitable headlines, today’s data doesn’t change much. The economy isn’t growing,

Usdcad ready to fly read the caption Intraday bias in USD/CAD stays on the upside at this point. Firm break of 61.8% projection of 1.3172to 1.3541 from 1.3352 at 1.3582 will pave the way to 100% projection at 1.3721. On the downside, break of 1.3437 support is needed to indicate short term topping. Otherwise, outlook will stay bullish in case of retreat

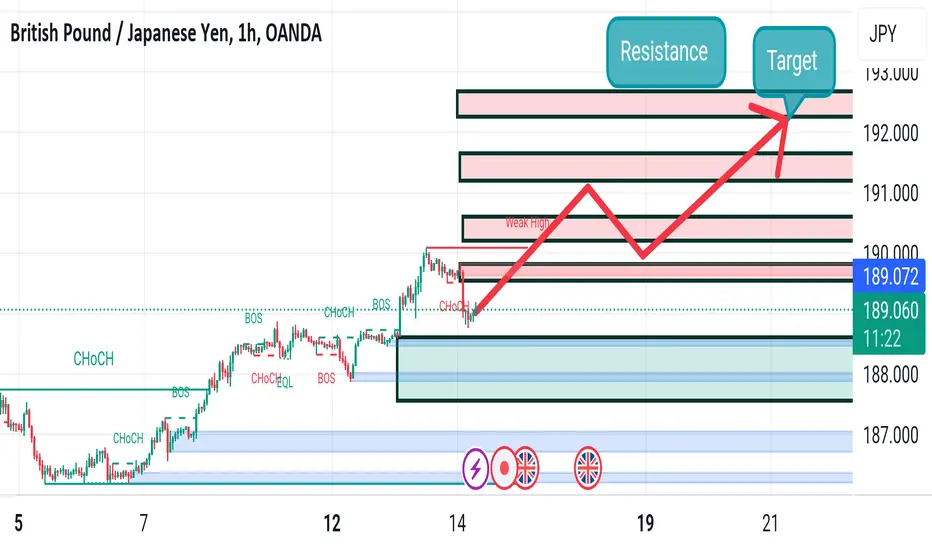
Gbpjpy going to above line read the caption Intraday bias in GBP/JPY remains neutral at this point, for consolidations below 190.05. Break 190.15 will resume larger up trend. However, break of 187.82 will turn bias to the downside for deeper correction back to 185.22 support instead.
In the bigger picture, up trend from 123.92 (2020 low) in in progress. Medium term outlook will stay bullish as long as 178.33 support holds. Next target is 195.85 long term resistance

Xauusd below 2000 best zone sell read the caption Gold On the 1 hour chart, we can see that the price has been consolidating ever since the big drop from the US CPI report. We now have a minor resistance zone around the 1999 level which is what the buyers will need to break to start targeting the 2015 resistance next. The sellers, on the other hand, will keep on defending the level with a defined risk above it to position for a drop into the 1973 level.

USDCHF: Overbought Market & Pullback 🇺🇸🇨🇭
After an impulsive bullish movement,
USDCHF stopped, approaching a key daily horizontal resistance.
The price formed a double top formation on that on a 4H time frame
and violated its neckline during the NY session yesterday.
Looks like the pair became too overbought.
I expect a retracement to 0.8823
❤️Please, support my work with like, thank you!❤️

Audusd like a snake but snake go down read the caption The AUDUSD fell sharply yesterday, and that selling continued in the Asian session today. However after reaching into a key swing area between 0.6445 and 0.6455, momentum slowed, the price bottomed and a rebound was started.
That move has now taken the price of 0.64912. Just ahead is a broken 61.8% retracement of the move-up from the October low to the December high. That level comes at 0.64992 (let's call it 0.6501). Moving above that level would have traders looking toward a swing area near 0.6524 and the 100-day moving average of 0.65325

Crude oil slip dips below sell trend read the caption Crude oil today marked a new high for February, reaching $78.73 which exceeded the 38.1% Fibonacci retracement level of the downward move from the September peak at $78.14 (see chart above). This surge represented a significant bullish momentum for the commodity and was a positive tilt for the technical bias.

Uadchf move up here is opportunity read the caption The USDCHF moved sharply higher yesterday after the stronger-than-expected CPI. The move to the upside extended above the 50% retracement of the move down from the October high. That level comes in at 0.8789. The 100-day moving average. That level comes in at 0.8805, and the 200-day moving average. The level comes in at 0.88464
The breaks of those key targets tilted the bias more in favor of the buyers. The best-case scenario going forward is for the 200-day moving average to hold support. Stay above 0.88465 is the most bullish scenario.

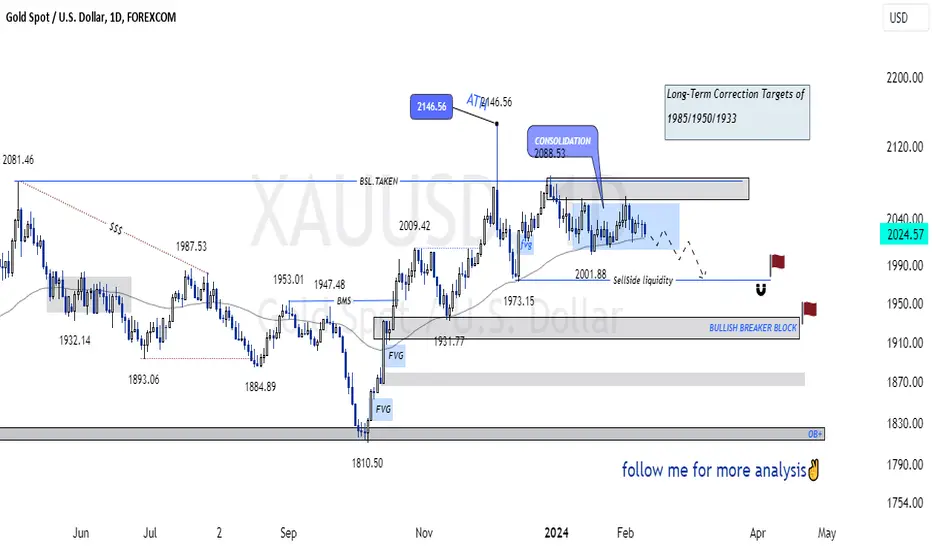
SasanSeifi 💁♂🟡GOLD Long-Term OutlookXAUUSD As you can see, after an uptrend and a new high, the price faced a correction from the 2146 range due to the liquidation of buyers. After the correction, the price rebounded slightly from the 1973 range but failed to stabilize above the 2081 liquidity range and saw another range and correction. Currently, the trend is stuck in a range.
In the long-term view, I expect the price to continue to correct to the SELL-SIDE LIQUIDITY 1985 / 1973 range after ranging and consolidating below the 2000 range. In case of correction, we need to see how the price reacts to better understand the continuation of the trend. Additionally, if it faces demand and can consolidate above the important 2075 range, the corrective scenario will be invalidated.
In the long term, the target correction ranges are 1950 / 1933, but currently, we are moving forward with the step-by-step chart.
🔵Remember, always conduct your analysis and consider other factors before making any trading decisions. Good luck!"✌️
❎ (DYOR)...⚠️⚜️
Sure, if you have any more questions or need further clarification, feel free to ask. I'm here to help!
if you found my analysis helpful, I would appreciate it if you could show your support by liking and commenting. Thank you!🙌✌
Gbpjpy big bullish up trend read the caption Gbpjpy big bullish Unfavorable base effects were expected to lift headline and core CPI last month but in both cases, they stayed at the same level. A small win but a win nonetheless for the BoE.
It was already expected to fall back to target in the second quarter before rebounding a little later in the year and this now increases the possibility of inflation undershooting the 3% target
Xauusd stay below 2000 target 1950 read the caption The sharp move higher in Treasury yields and the dollar yesterday resulted in a steep drop in gold. Of note, the fall took out the January low as well as the $2,000 mark. But at least for the time being, buyers are able to hang on as the 100-day moving average (red line) at $1,989.80 is