AUDCHF: Bearish Reversal Confirmed! 🇦🇺🇨🇭
AUDCHF may return to a global bearish trend.
A breakout of a support line of a rising parallel channel,
bearish CHoCH and a lower high on a daily indicate a changing market sentiment.
I think that the pair may drop lower soon.
Goal - 0.53
❤️Please, support my work with like, thank you!❤️
I am part of Trade Nation's Influencer program and receive a monthly fee for using their TradingView charts in my analysis.
Forextrading

Market next move
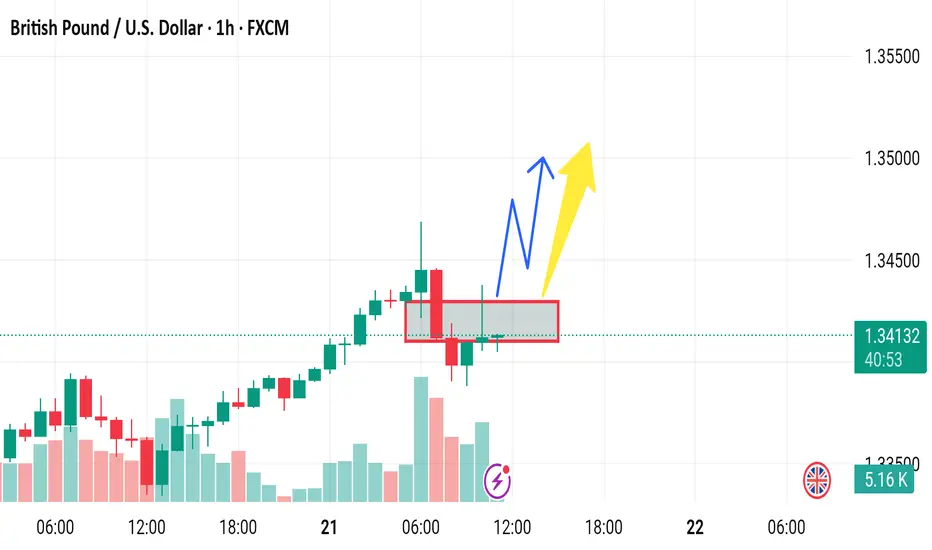
Bearish Disruption to GBP/USD Analysis:
1. Support Weakness:
The price action within the red box shows multiple bearish candles, suggesting the zone is under pressure.
A break and close below this box could invalidate the bullish thesis.
2. Exhaustion Signals:
After a sharp rally, the market often consolidates or corrects. The current stall near 1.3400–1.3420 could indicate buying exhaustion.
The latest candle shows a strong bearish push into the support, hinting at potential for deeper decline.
3. Decreasing Volume:
Recent green candles had falling volume, which shows lack of conviction by buyers.
Meanwhile, red (bearish) candles show rising volume, signaling increased selling pressure.
4. Failed Breakout Setup:
If this bounce fails and price closes below 1.3380, this will form a false breakout or bull trap, triggering stop hunts and aggressive shorting.
5. Macroeconomic Headwinds:
GBP is sensitive to UK data and BoE policy. Any hawkish Fed or weak UK numbers may lead to a USD rebound, pushing GBP/USD lower.
Market next move
Bearish Disruption to the EUR/USD Analysis:
1. Strong Resistance Zone (Red Box):
Price is struggling to hold above the resistance area. Several candles have long upper wicks, signaling rejection and selling pressure.
This may form a double-top or even a bull trap.
2. Volume Anomaly:
The upward price move shows decreasing volume, which is a classic signal of weak momentum. Without increasing volume, breakouts often fail.
3. Overextended Rally:
The pair has already made a sharp move up from below 1.1300 to near 1.1340. This type of parabolic move can lead to a snapback correction.
If bulls cannot decisively break resistance soon, profit-taking may trigger a short-term retracement.
4. Bearish Divergence Potential:
If RSI or MACD indicators are available, watch for bearish divergence (price makes higher highs while indicators make lower highs). This would reinforce downside risk.
5. Fundamental Pressure:
If any upcoming U.S. economic data (like PMI, FOMC minutes, etc.) is strong, it could boost USD and push EUR/USD down from this resistance.

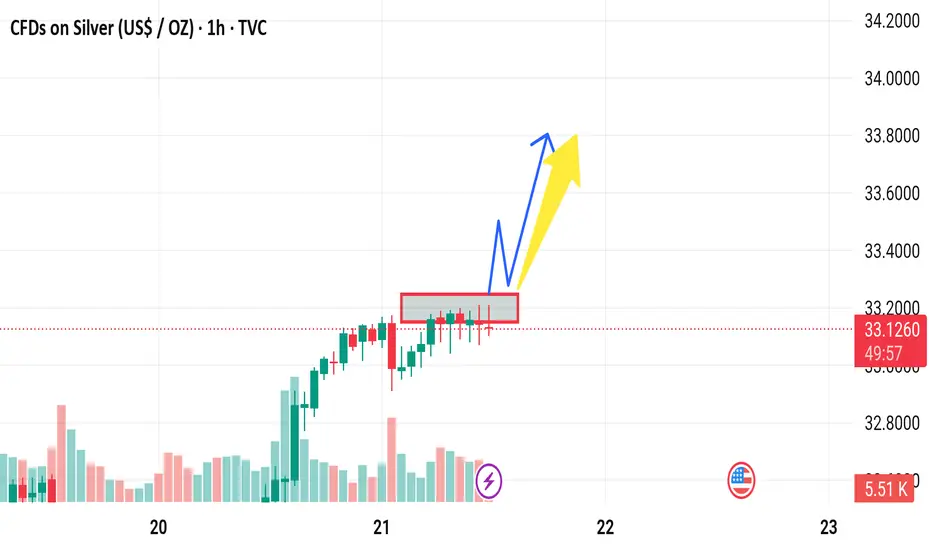
Market next move Bearish Counter-Analysis:
1. Resistance Zone Saturation:
The red box shows repeated tests of the resistance area around $33.14–$33.20. This can suggest exhaustion instead of momentum.
Multiple failed attempts to break this zone can result in bearish rejection.
2. Volume Divergence:
The volume appears to be declining even as price approaches resistance. This divergence can imply a lack of buyer strength, which is a red flag for a bullish continuation.
3. Possible Bull Trap:
A sharp move above resistance followed by a quick drop back inside (false breakout) could trap long traders.
This may be followed by a sharp sell-off toward the previous support level (~$32.60–$32.80).
4. Candlestick Patterns:
Watch closely for bearish candlestick patterns like doji, shooting star, or bearish engulfing in the red box. Their appearance would strengthen a bearish reversal case.
5. MACD/RSI (if available):
If the RSI is overbought or MACD shows a bearish crossover, it would reinforce the possibility of a downward retracement.
EUR/USD Sell – May 21 Bias: Bearish (4H / 1H / 15m all down) and in Orderblocks.
POI: 15m OB
Trigger: 1m BOS from 15m OB (means market reacted → valid)
Entry: On the last untouched 1m OB left behind after the BOS
TP: Final TP at gap (18RR), partial TP at 1:3RR
Risk: Asia high not swept → could spike into SL before dumping
⚠️ Key Notes
Asia High = liquidity → price might hunt it first, then reverse
If you entered before the sweep, SL spike risk is real
If you wait after the sweep and get a clean 1m OB + BOS again = higher probability entry

GOLD BUY NOW STRONG BULLISH NEXT MOVE1. Double Top Resistance
The chart identifies a "double top" near the current level. This is typically a strong bearish reversal pattern.
If price fails to convincingly break above this level (around 3,310–3,320), it may indicate a loss of bullish momentum.
2. Overextended Move
Recent candles show a steep rally (notably the 3.03 move), which may be overbought on lower timeframes (e.g., RSI likely >70).
Parabolic moves are often followed by sharp corrections.
3. Support Cluster Vulnerability
The red shaded support zones could act as liquidity traps. If price dips into those zones and fails to bounce, it may trigger sell-offs.
Especially the zone just below the current price — if broken — could accelerate downside toward the "Strong Support Area" around 3,270.
4. False Breakout Risk

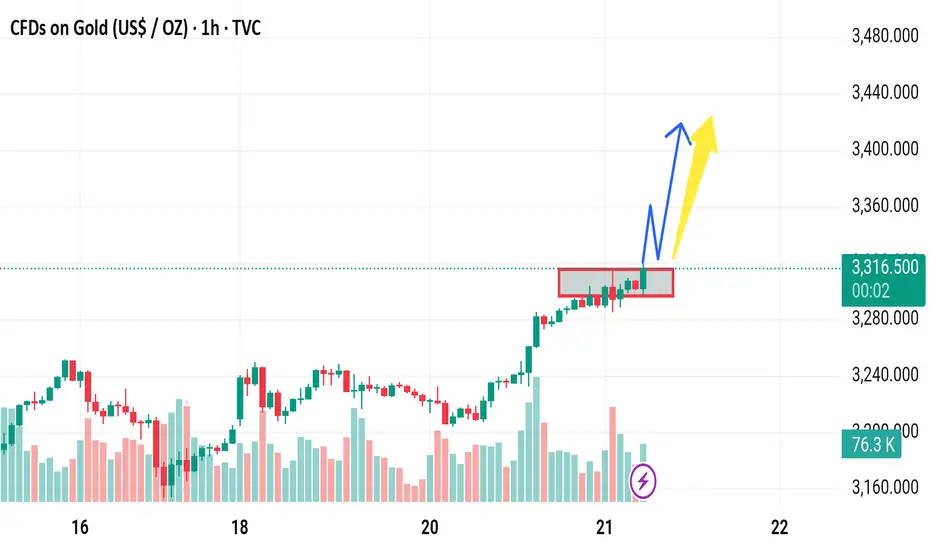
Market next move Bearish Disruption Analysis:
1. Weak Breakout Confirmation:
Although price broke above the red consolidation zone, it quickly pulled back within the range, suggesting a false breakout or bull trap.
The current red candle closing back into the range hints at bullish exhaustion.
2. Volume Divergence:
Note the declining volume on the recent upward push compared to the initial breakout on the 20th.
Lower volume during a breakout typically signals lack of conviction, weakening the bullish case.
3. Resistance Cluster:
The price is stalling just above the 3306 level — possibly facing resistance from previous highs or round-number psychological resistance.
Bears may take control if price fails to hold above 3300.
4. Potential Bearish Scenario:
Price re-enters the consolidation range and breaks below it.
Target zones could be:
3,290 (local support from the range base)
3,270 (previous minor support)
Further down toward 3,250 if momentum builds.

Market next move 1. Resistance Zone Already Tested
The price is currently testing a resistance zone (highlighted in red). Historically, prices have reversed from such levels unless there's a strong breakout catalyst. Without a clear breakout and volume confirmation above this zone, a reversal is plausible.
Bearish View:
If price fails to close decisively above 3,320–3,325, it may indicate a double top or false breakout setup, leading to a correction back toward 3,275 or lower.
---
2. Volume Divergence
Look at the declining volume bars while price pushes upward. This is a bearish divergence, suggesting weakening momentum behind the rally.
Bearish Implication:
Without increasing volume, the current move may lack the strength to sustain higher levels, opening the door for a pullback.
---
3. Overbought Short-Term RSI (not shown)
Assuming an RSI or momentum oscillator is present (often used with this type of analysis), there’s a high likelihood it is nearing overbought levels based on recent price action.
Bearish Risk:
Overbought conditions often precede short-term pullbacks or consolidations.
---
4. Potential Fake Breakout (Bull Trap)
The blue and yellow arrows suggest a breakout and continuation. However, a fakeout above resistance (bull trap) could lure buyers in before a reversal.
Disruption Scenario:
Price spikes above the resistance zone briefly, then sharply reverses and closes below the red box, leading to a fast drop as trapped longs exit.
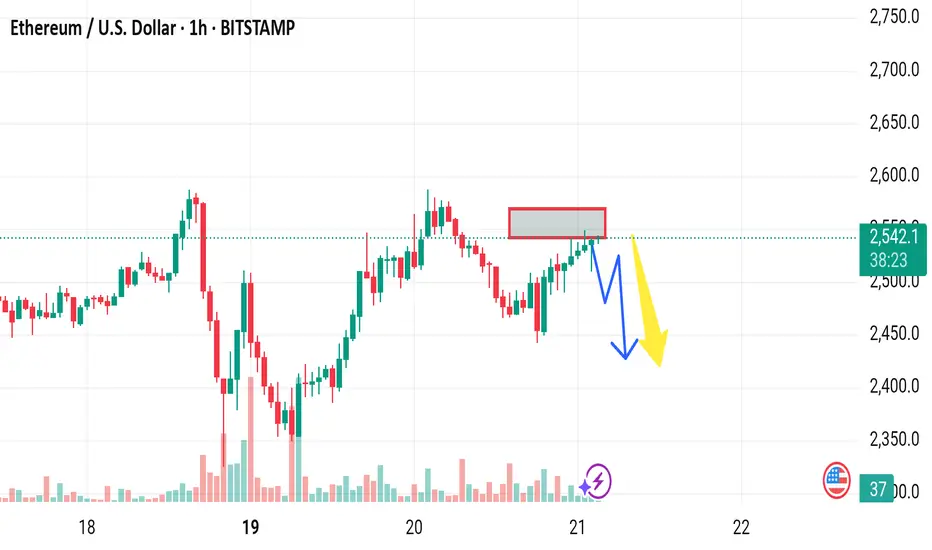
Market next move Disruptive (Contrarian/Bullish) View:
1. Higher Lows Formation:
The price is consistently forming higher lows, which could indicate building bullish momentum, not weakness.
This could suggest a breakout attempt through the resistance zone rather than a rejection.
2. Volume Analysis:
Volume seems to be stabilizing (and even increasing slightly) on green candles approaching resistance.
This might indicate accumulation rather than distribution — a possible prelude to a bullish breakout.
3. Short-term Bull Flag/Pennant:
The price pattern just before entering the red box may resemble a bull flag, a continuation pattern.
If it breaks the flag upwards, it could target levels around $2,600+.
4. Failed Bearish Setups:
The earlier sharp drop was quickly recovered, showing buyer interest below $2,500.
This invalidates the strength of previous selling pressure.
5. Psychological Level at $2,500 Holding:
ETH is hovering just above the key $2,500 psychological support.
Holding above this level increases the likelihood of testing and potentially flipping resistance to support.
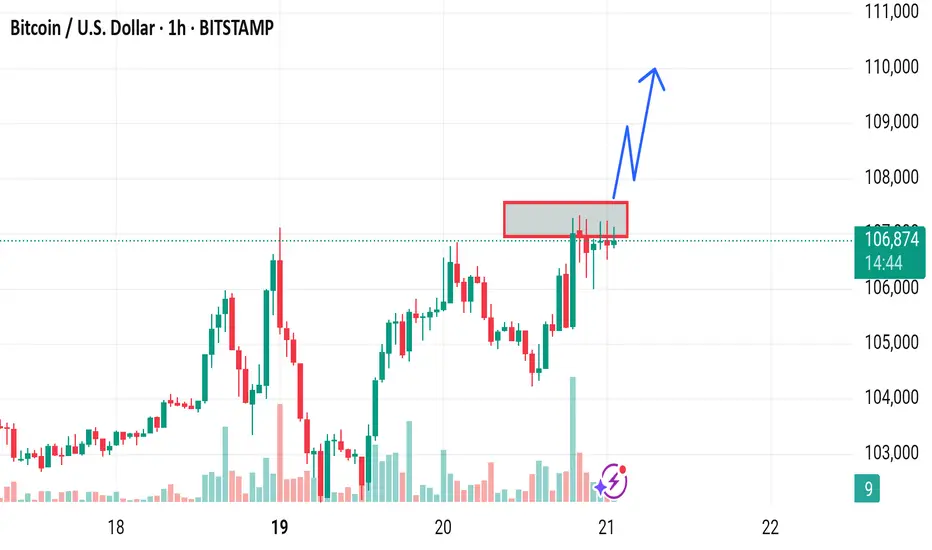
Market next move 1. Weak Momentum Into Resistance
The candles near resistance are small-bodied and lack strong bullish volume.
Disruption: This signals buying exhaustion. Price could consolidate or reverse sharply, especially if buyers fail to defend this level.
---
2. Resistance Zone Saturation
The resistance zone (highlighted in red) has already been tested multiple times.
Disruption: This could either lead to a breakout or—more likely in a weak volume context—a liquidity trap and reversal, as market makers use the expectation of a breakout to trap long positions.
---
3. Potential Double Top Pattern
Look closely at the two peaks around the resistance zone. They resemble a developing double top.
Disruption: If price fails to break out convincingly and starts dropping, this double top may trigger a fall back to $105,000 or even lower.
---
4. Bearish Divergence Possibility
While not shown on this chart, in cases like this, it's common for momentum indicators (like RSI or MACD) to show bearish divergence.
Disruption: Even if price hits slightly higher highs, a divergence could signal that momentum is fading and a deeper pullback is incoming.
---
5. High Sell Volume on the Spike (May 19)
That long wick candle with high volume around May 19 suggests strong seller interest above $107K.
Disruption: Buyers could struggle again in this zone, especially if that volume spike was from whales distributing.

Market next move 1. Overconfidence in Breakout:
The chart predicts a clean breakout, but the resistance zone has already been tested multiple times, indicating seller strength.
Disruption: Price might fake out above resistance and sharply reverse (bull trap).
2. Volume Confirmation Missing:
The breakout prediction lacks strong volume spike confirmation.
Disruption: Without increasing volume, any breakout attempt might fail and lead to a false breakout.
3. Short-Term RSI/Overbought Conditions (Not visible here):
If RSI or similar indicators are approaching overbought, it increases the chances of a pullback rather than immediate continuation.
4. Liquidity Sweep Risk:
Price may intentionally break the resistance to trigger stop-loss orders before reversing sharply (common in crypto markets).
Disruption: A stop-hunt move followed by a retrace to $105,000 or lower.
5. Macroeconomic or External Event Sensitivity:
If an external catalyst (e.g., Fed speech, ETF news, regulatory action) emerges, it can easily invalidate the bullish scenario.
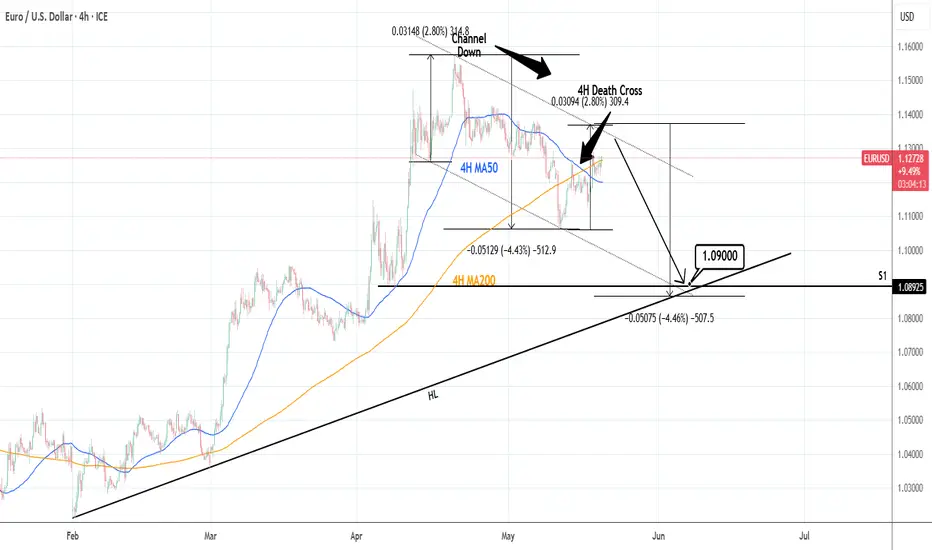
EURUSD: 4H Death Cross to push Channel Down much lower.EURUSD has turned neutral on its 1D technical outlook (RSI = 54.499, MACD = 0.002, ADX = 31.600) as the price approaches the top of the 1 month Channel Down. A rejection and LH is expected soon that will initiate the new bearish wave. The last one was -4.45%, so that gives a TP = 1.0900, which falls right on the S1 level and the HL trendline from the February 3rd low. Keep in mind also that the market formed the first 4H Death Cross since February 10th.
## If you like our free content follow our profile to get more daily ideas. ##
## Comments and likes are greatly appreciated. ##
Market next move 1. False Breakout from Resistance Zone
Disruption: The price is testing a resistance zone (marked red box). If it fails to hold above this zone and falls back below 32.70, it could signal a bull trap.
Impact: This could invalidate the projected upward move and initiate a drop toward 32.20 or lower.
---
2. Divergence Warning
Disruption: If momentum indicators (RSI, MACD—not visible here) show bearish divergence while price climbs, it’s a warning sign of weakening buying pressure.
Impact: This often precedes a pullback or reversal despite bullish chart patterns.
---
3. Lack of Volume Confirmation
Disruption: The breakout is not supported by a significant increase in volume (volume bar is relatively modest).
Impact: Weak volume may mean the breakout lacks conviction and can reverse quickly.
---
4. Overhead Liquidity Zone Near 34.04
Disruption: The projected target of 34.0448 could act as a liquidity magnet, but also a selling zone where large orders may get filled.
Impact: Price might spike into that area and reverse sharply.
---
5. Macroeconomic Uncertainty
Disruption: Unexpected Fed comments, inflation data, or geopolitical shifts can cause Silver to defy technical expectations.
Impact: Could result in abrupt volatility that wipes out structured setups.

Market next move
1. Red Zone Retest Failure
Disruption: If the price breaks back below the red highlighted zone (around 3,265–3,270), it may indicate a false breakout.
Impact: This would invalidate the bullish continuation and could lead to a sharp decline toward 3,240 or even lower.
---
2. Low Volume on the Breakout
Disruption: The breakout rally appears strong, but if upcoming candles show declining volume, it may suggest weak momentum.
Impact: A drop in volume could precede a reversal or sideways consolidation instead of the projected move to 3,306.
---
3. Double Top or Bearish Rejection at 3,306
Disruption: The price could reach the 3,306 target and form a double top, leading to bearish rejection.
Impact: This could be the start of a downtrend or extended consolidation.
---
4. Overbought Conditions
Disruption: If momentum indicators like RSI or Stochastic (not shown on chart) are in overbought territory, this could suggest a pullback is likely before continuation.
Impact: May lead to a deeper retracement than expected.
---
5. Macroeconomic or News Catalyst
Disruption: Unforeseen macro events (e.g., interest rate announcements, geopolitical tension) could cause sudden shifts against the technical outlook.
Impact: Could override technical structure entirely.

EURCHF: Bullish Wave Ahead?! 🇪🇺🇨🇭
I think that EURCHF is going to resume a bullish rally soon.
A strong bullish reaction to a rising trend line on a daily,
triggered a formation of a buying imbalance on a 4H time frame
and a Change of Character.
I expect a growth at least to 0.941 level.
❤️Please, support my work with like, thank you!❤️
I am part of Trade Nation's Influencer program and receive a monthly fee for using their TradingView charts in my analysis.

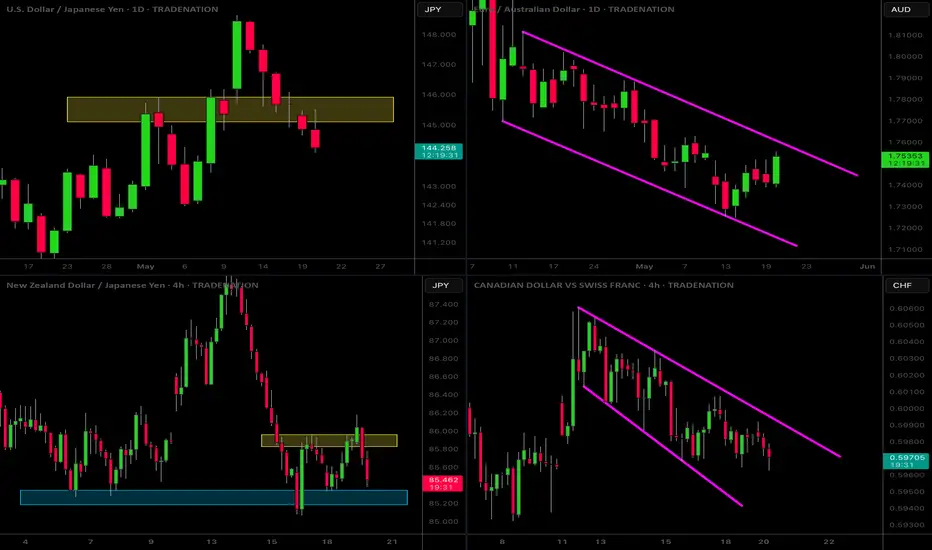
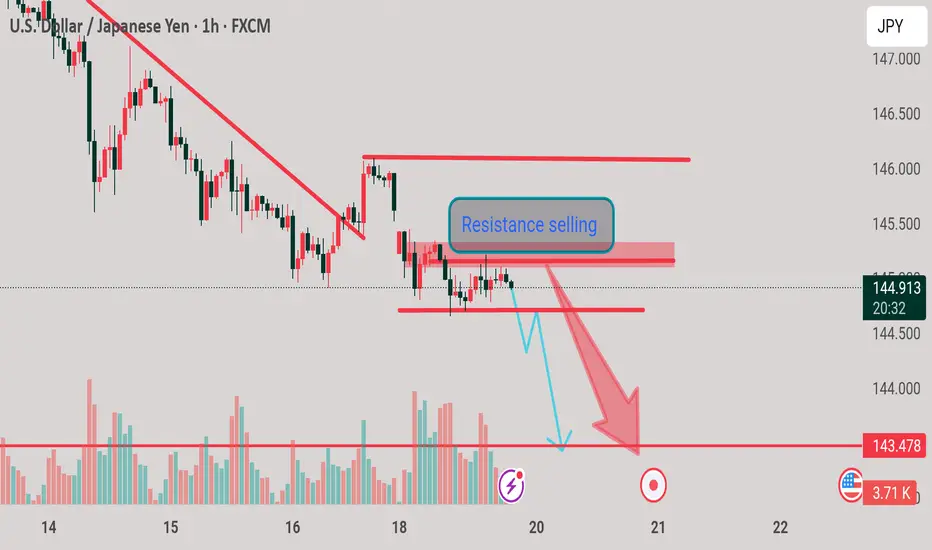
MarketBreakdown | USDJPY, EURAUD, NZDJPY, CADCHF
Here are the updates & outlook for multiple instruments in my watch list.
1️⃣ #USDJPY daily time frame 🇺🇸🇯🇵
The pair demonstrates clear strength of the sellers.
The price went way below a recently broken resistance.
With the absence of impactful fundamental news,
the market may continue falling for now.
2️⃣ #EURAUD daily time frame 🇪🇺🇦🇺
The market is trading within a wide falling parallel channel on a daily.
Its upper boundary is a strong vertical resistance.
I will look for selling from that.
Alternatively, its bullish breakout may push the prices much higher.
3️⃣ #NZDJPY 4H time frame 🇳🇿🇯🇵
Before an Australian interest rate decision at night,
the pair acted strongly bullish, following our plan.
I see a nice double bottom pattern and a confirmed bullish Change of Character CHoCH.
I think that growth will resume soon
4️⃣ #CADCHF 4H time frame 🇨🇦🇨🇭
The price formed a nice bullish flag pattern.
I am waiting for its bullish breakout to confirm a start
of a new bullish wave.
A candle close above its upper boundary will validate the violation.
Do you agree with my market breakdown?
❤️Please, support my work with like, thank you!❤️
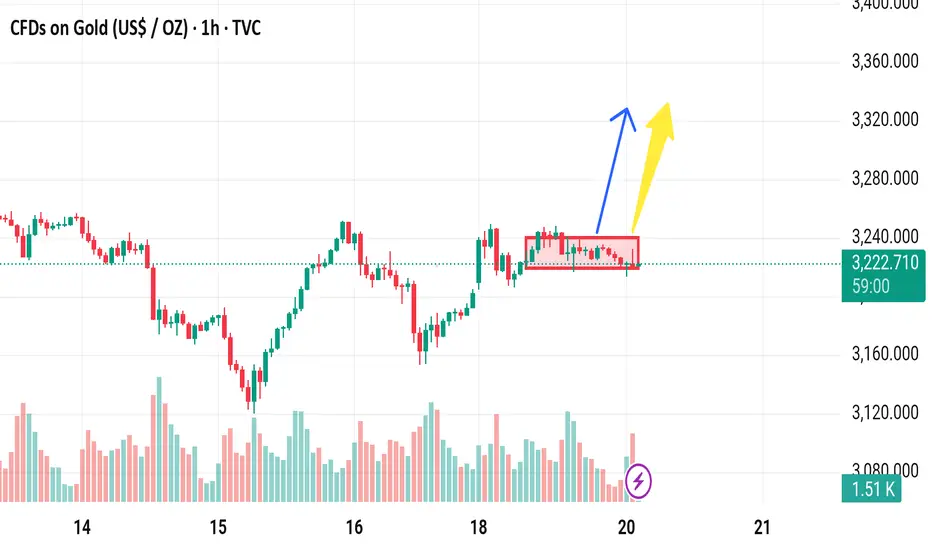
Market next moveBearish Disruption Scenario:
1. False Breakout Trap:
If the price breaks above the rectangle but lacks strong volume or fails to sustain above resistance, it may turn into a bull trap.
This could lead to a sharp reversal and shake out long positions.
2. Volume Divergence:
Notice that volume is decreasing during the consolidation. Without a spike in volume on breakout, the move could lack conviction.
This weakens the bullish case.
3. Resistance Zone Overhead:
There's likely a resistance zone just above the rectangle (around 3,240–3,260), where selling pressure could resume.
Price may test the zone, reject it, and fall back inside or below the range.
4. Double Top Risk:
The price action on the 18th and current range-top could form a double-top pattern if rejected.
A drop below the lower bound of the rectangle (~3,210) would confirm the pattern, suggesting bearish continuation.
5. Macro or Fundamental Risks:
Any unexpected strong U.S. dollar movement or interest rate expectations could push gold lower, invalidating bullish technical setups.
BTCUSD buy opportunity next target The zone near 105,998 has been marked as a key resistance. BTC has previously failed to hold above this level, leading to sharp rejections.
Without strong volume confirmation, a breakout above this level may result in another bull trap.

STRANGE down mode opportunity The price has repeatedly tested the lower red support band near 144.00 without breaking below it.
This could signal accumulation or demand absorption, not necessarily weakness.
Next move Bearish Disruption Perspective:
1. Failure to Break Above Supply
Price is struggling near 32.40–32.50, a visible resistance area from prior swing highs.
Repeated rejections here can signal seller strength or profit-taking.
2. Exhaustion Patterns
The price is forming sideways consolidation (highlighted in red).
A failure to break upward from this box and a false breakout wick would suggest buyer exhaustion.
3. Bearish Breakdown Scenario
If price breaks below the red box support (~32.30), this range could flip into resistance.
A clean drop below 32.30 would likely open the path toward 32.00 and potentially 31.80.
4. Volume Spike on Red Candle
Volume on red bars (10.64K) suggests aggressive selling pressure creeping in.
Watch for confirmation if next candles close red with high volume.

AUDCHF: More Growth Ahead 🇦🇺🇨🇭
AUDCHF strongly reacted to a rising trend line on a daily.
The price formed an ascending triangle pattern on a 4H time frame
and is now breaking its horizontal neckline.
I expect a bullish continuation to 0.540 / 0.543 levels.
❤️Please, support my work with like, thank you!❤️
I am part of Trade Nation's Influencer program and receive a monthly fee for using their TradingView charts in my analysis.

Gold next move The price is currently at a prior resistance level (~3,229) which may act as a supply zone. The market has already failed to break above this level multiple times in the past, indicating strong selling pressure.
2. Volume Divergence
If we analyze the volume at the most recent peaks, there's a possibility of lower buying volume despite higher prices—this could signal weakening bullish momentum.
3. False Breakout Risk
The chart suggests a possible pullback to the red demand zone before continuation. However, if the price fakes out into the zone and fails to hold above ~3,210, this could trigger a deeper selloff.
4. Double Top Formation Risk
There appears to be a potential double top pattern around 3,250–3,260, which may signal a bearish reversal if neckline support (~3,210) is broken.
5. Macroeconomic Influence
Unless supported by strong fundamentals (e.g., dovish Fed signals, rising inflation), any bullish breakout might lack fuel to sustain a rally beyond resistance.
Disruptive Bearish Scenario:
Price breaks below the red demand zone (~3,210).
Retests it as resistance.
Targets the next major support zone near 3,175–3,180.

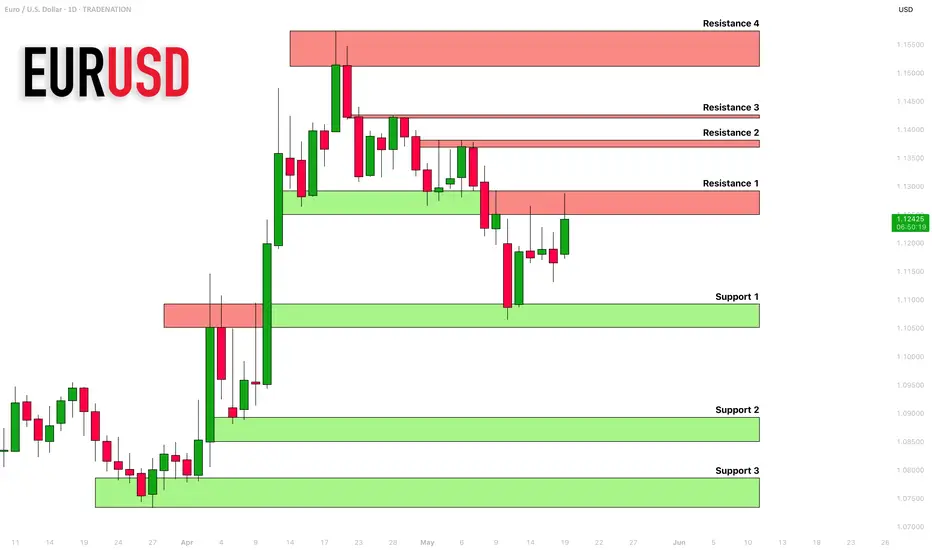
EURUSD: Support & Resistance Analysis For This Week 🇪🇺🇺🇸
Here is my latest support and resistance analysis for EURUSD.
Resistance 1: 1.1250 - 1.1295 area
Resistance 2: 1.1368 - 1.1381 area
Resistance 3: 1.1420 - 1.1427 area
Resistance 4: 1.1510 - 1.1574 area
Support 1: 1.1051 - 1.1093 area
Support 2: 1.1085 - 1.1089 area
Support 3: 1.1073 - 1.1078 area
Consider these zones for pullback/breakout trading.
❤️Please, support my work with like, thank you!❤️
I am part of Trade Nation's Influencer program and receive a monthly fee for using their TradingView charts in my analysis.