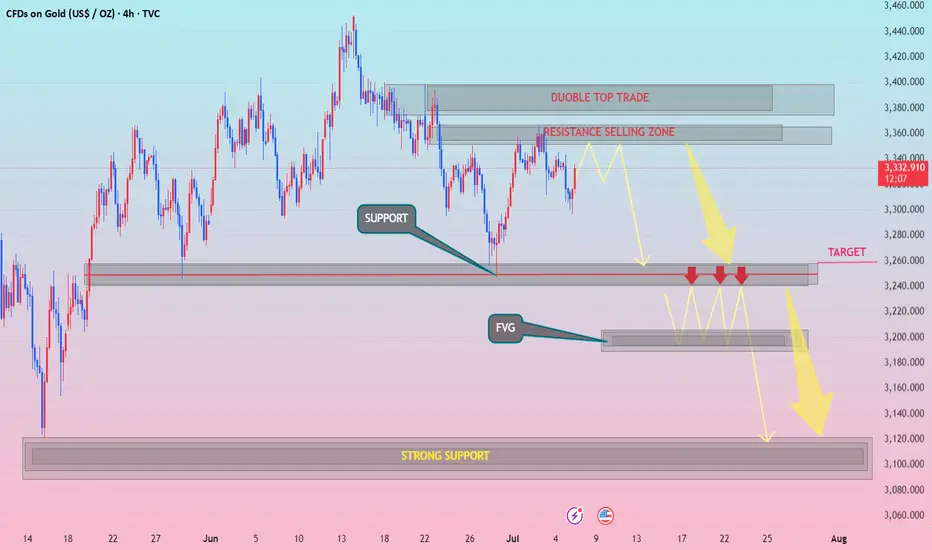
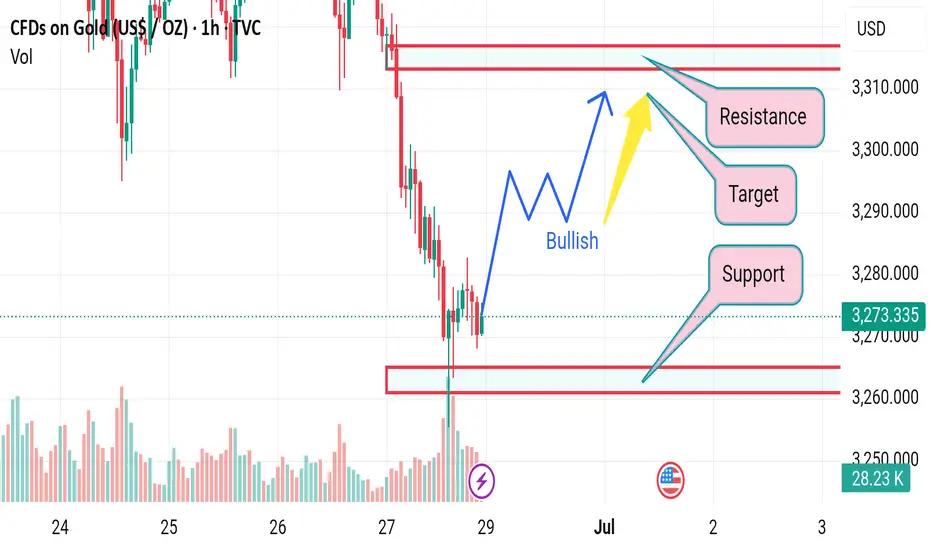
XAUUSD h4 down pattranDouble Top Yes Break above neckline = Bullish invalidation
Resistance Selling Zone Yes May flip to support
Target Zone (3,260) Yes Over-tested support may trigger reversal instead
FVG (~3,200) Yes May not fill if bullish momentum sustains
Strong Support (~3,100) Yes Price might not drop that far before buyers
WITH ZARA..FVG
Forextradingzones
Market next target 🔄 Disruption Analysis:
📌 Current Scenario:
Price is trading around 3,336.400, just below the identified resistance zone (~3,340-3,343).
A range-bound structure is visible with repeated rejections at resistance and support.
---
🚨 Disruption View:
❌ Invalidating Bearish Bias:
The chart assumes a bearish move toward the 3,320 target, but there are early signs of strength near the mid-range (3,335 area).
Failed breakdowns and higher lows indicate buying pressure below 3,330.
---
🟢 Alternative Disruption Outlook (Bullish Flip):
If price breaks and holds above 3,343 resistance, we may see:
🔼 Upside breakout toward 3,355–3,360 zone.
📈 Continuation of the larger uptrend from July 1st rally.
---
🔁 Key Disruption Levels:
Support: 3,328–3,330 (interim zone to watch before full drop)
Resistance: 3,343–3,345 (bullish breakout point)
Invalidation of Bearish Bias: Closing above 3,345 on strong volume.
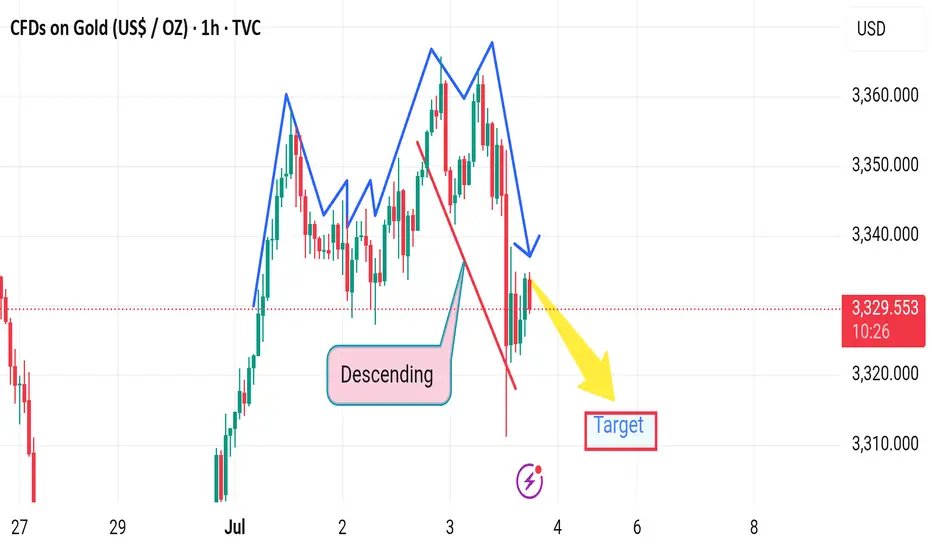
Market next target ⚠️ Disruption Analysis – Gold (1H):
🔹 Pattern Disruption Identified:
The chart previously followed a descending structure with lower highs and lower lows, confirming bearish momentum.
However, a temporary recovery (small bullish correction) appears after a sharp drop, disrupting the previous flow.
---
🔄 Disruption Points:
1. Break in Momentum (Structure Shift):
The recent bullish correction (small upward leg) challenges the consistency of the descending trend.
It signals a potential pause or trap in the current bearish move.
2. Price Rejection Area:
Price attempted to bounce but failed to break above the previous lower high, indicating bearish strength remains intact, but is facing disruption from short-term buyers.
3. Volatility Spike:
The long wick on the recent candle shows a volatility disruption, likely due to economic news or high-impact events (suggested by the ⚡ icon on the chart).
4. Target Zone Disruption:
Though the yellow arrow points toward a bearish target, the slight upward pullback adds uncertainty about whether price will reach that level immediately.
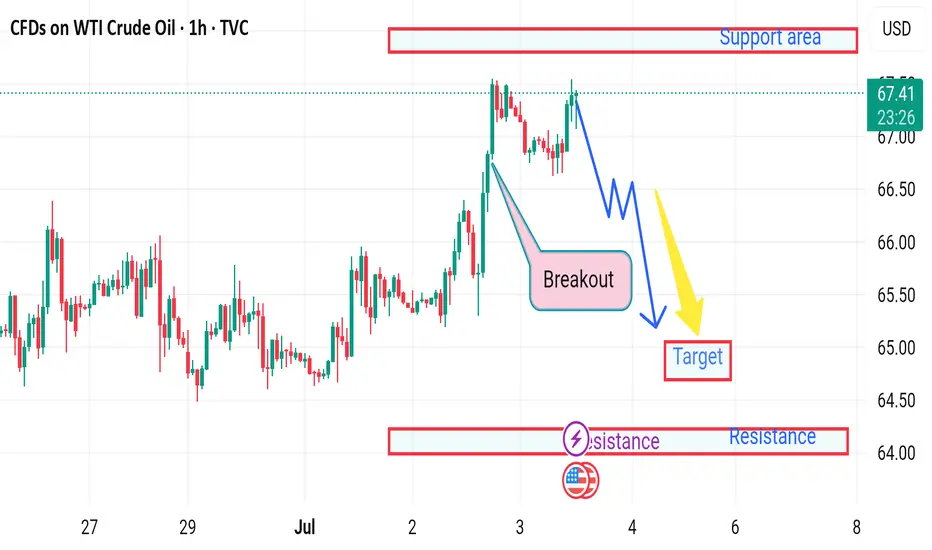
Market next move ❗ Disrupted Market Outlook:
⚠️ False Breakout Risk:
The recent "Breakout" above previous highs may be a bull trap. Although price surged, the follow-up candles are showing lower highs, suggesting weakening bullish momentum.
📉 Bearish Divergence (not shown but likely):
Based on the price action, there's a potential bearish divergence with RSI/MACD (if overlaid), as price makes higher highs while momentum likely weakens.
🔄 Resistance Reversal Zone:
The area labeled as "Support area" at the top (near $67.50) is actually acting as resistance again — the market is failing to hold above this level.
🔁 Retest Failure:
After the breakout, price failed to establish strong support and is consolidating below the highs, hinting at a potential breakdown below $66.
---
🔻 Disruption Path:
1. Drop to $66.00 - immediate pullback from failed breakout.
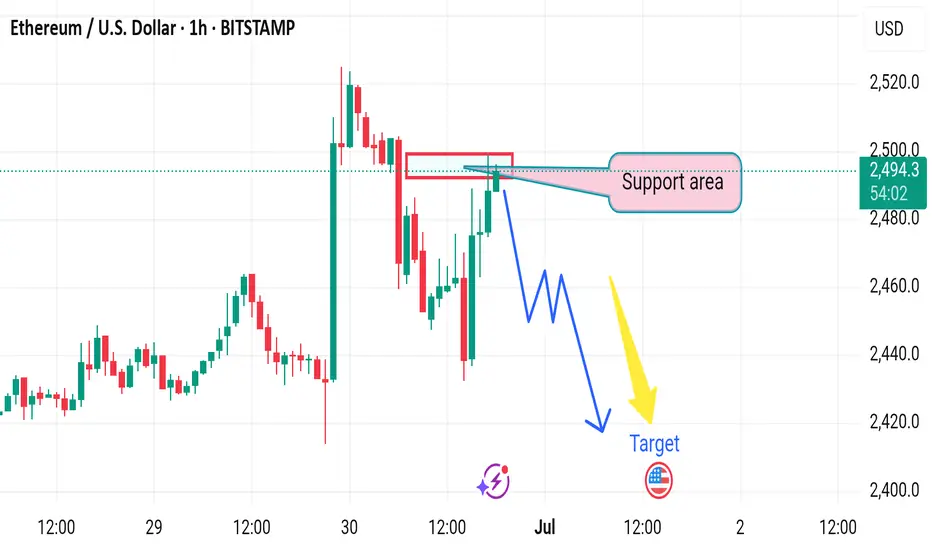
Market next target 🔀 Disruption Analysis – Bullish Alternative Scenario
The current chart suggests a bearish outlook from the resistance zone (~$2,495–$2,500), targeting a drop below $2,425. However, here’s how a bullish disruption could break this bearish narrative:
---
🟢 Bullish Disruption Possibility:
1. Support Reclaim & Strong Buyer Reaction:
If price reclaims and holds above the marked “support area” (~$2,495), it could signal strength and trap early sellers.
A strong bullish candle closing above $2,505 could invalidate the bearish scenario.
2. Higher Low Formation:
If ETH prints a higher low above $2,470, it would suggest buyers are stepping in early, reinforcing bullish momentum.
3. Target Shift – Bullish Continuation:
A confirmed breakout above $2,505 may open the path to $2,540–$2,560 as the new short-term target zone.
4. Momentum Catalyst:
A positive U.S. macroeconomic event or crypto-specific bullish news (e.g., ETF, institutional inflows) could fuel upside disruption.
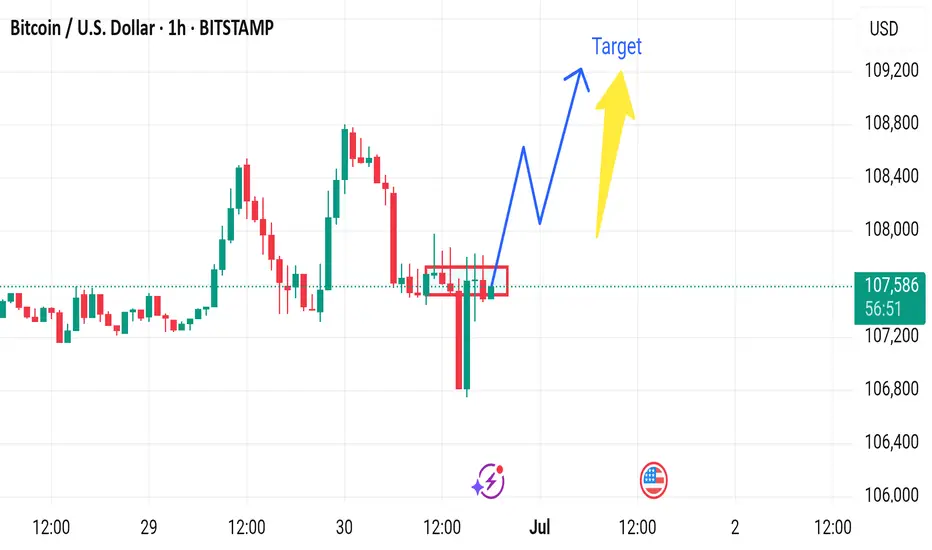
Market next target 🔀 Disruption Analysis – Bearish Alternative Scenario
The current chart suggests a bullish continuation from the consolidation zone around $107,300–$107,500, with a projected move toward $108,500+. However, the following bearish disruption could invalidate that path:
---
🔻 Bearish Disruption Possibility:
1. False Breakout Trap:
If price briefly spikes above the consolidation zone and quickly reverses, it could trap breakout buyers.
A failed bullish move around $107,800–$108,000 would be the first bearish signal.
2. Weak Volume Confirmation:
Lack of volume during the breakout would signal lack of institutional interest, increasing downside risk.
3. Break Below Support Zone:
If BTC breaks below $107,000, it would signal a loss of momentum and invalidate the bullish scenario.
This breakdown may lead to a quick move toward $106,000 or even $105,800, the recent swing low.
4. Macro Influence:
Any negative U.S. economic data or regulatory news could spark bearish sentiment and accelerate the drop.
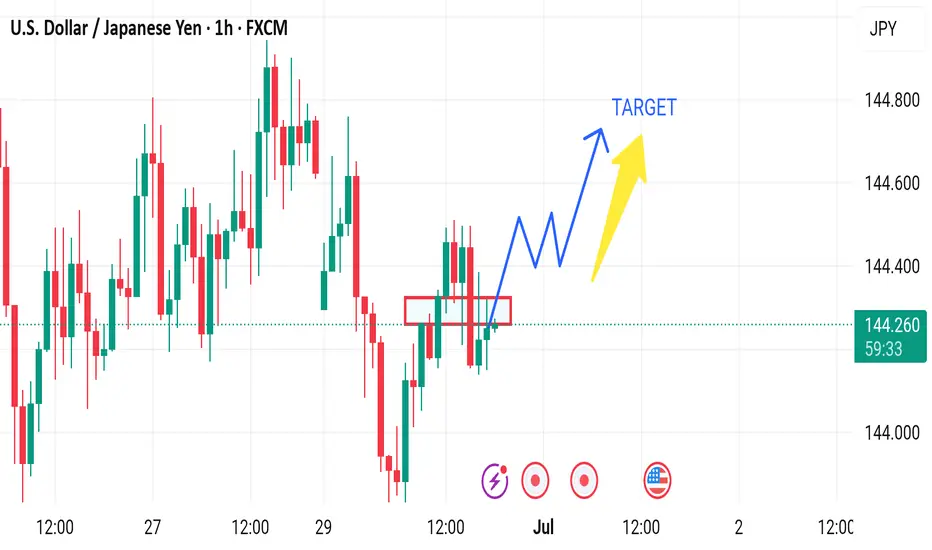
Market next move 🔀 Disruption Analysis – Bearish Alternative Scenario
While the current setup points to a bullish continuation above the support zone (around 144.10–144.20) with a projected target near 144.60, here’s how a bearish disruption could unfold instead:
---
🔻 Bearish Disruption Possibility:
1. Failed Breakout / Bull Trap:
Price may fake a move upward to trap breakout buyers near 144.40–144.50, then sharply reverse.
This would indicate a false breakout and potential reversal setup.
2. Rejection at Resistance:
Repeated failure to close above 144.40 may signal exhaustion.
Bearish divergence could form on momentum indicators (like RSI) as price rises.
3. Break Below Support Area:
A decisive break below the red support zone (around 144.10) may shift momentum bearish.
That would confirm a lower high and suggest downside continuation.
4. Next Bearish Target:
Initial support lies at 143.85, with further potential drop toward 143.60.
Market next target 🔀 Disruption Analysis – Bullish Alternative Scenario
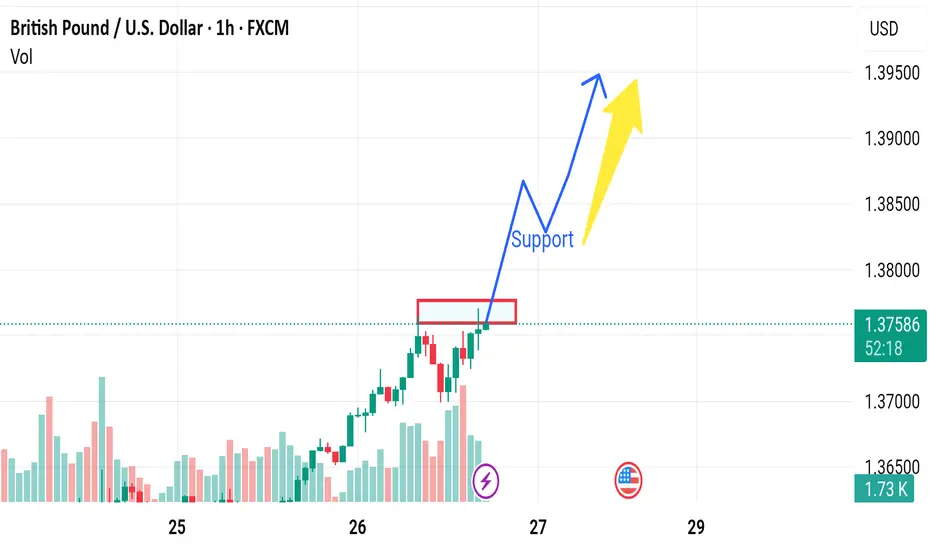
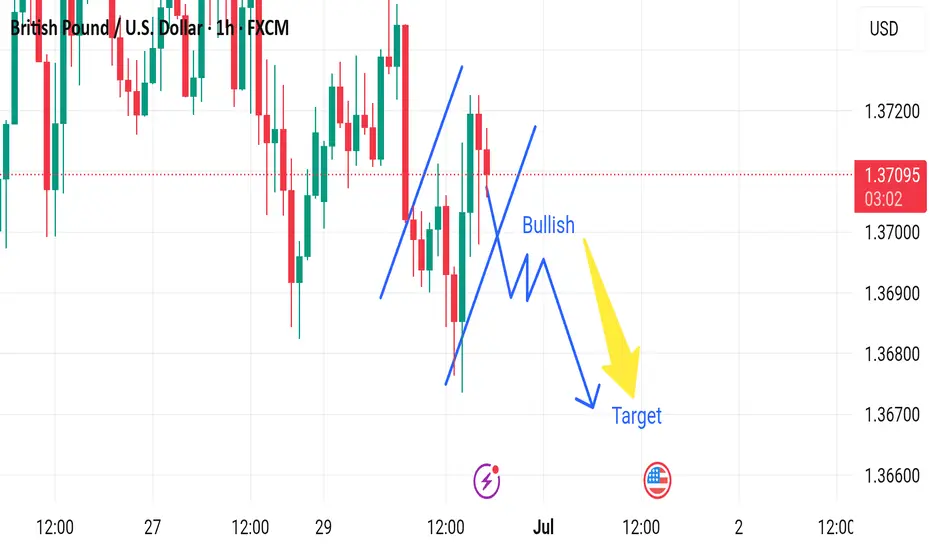
While the current chart outlines a bearish scenario after a short-term bullish correction, leading to a drop toward the target near 1.36600, here’s how a bullish disruption could unfold instead:
---
🟢 Bullish Disruption Possibility:
1. False Breakdown / Bear Trap:
The market may dip slightly below recent lows to trigger sell stops and liquidity grab, then reverse upward.
If price finds strong buying interest around 1.3690–1.3700, it could spark a bullish reversal.
2. Strong Rejection Candles:
Watch for bullish engulfing or pin bar formations on lower timeframes (15m or 30m) near the dip area.
These would signal loss of bearish momentum.
3. Break of Lower High Structure:
A break above 1.3720 would shift short-term market structure to bullish.
It could lead to a move toward 1.3750–1.3780.
4. Macro Fundamentals:
Hawkish BOE comments or weak U.S. data could reverse USD strength, lifting GBP/USD.
Market next move Disruption Analysis – Bullish Alternative Scenario
While the current chart suggests a bearish setup from a resistance zone (around 1.1765) toward a target near 1.1630, here's a potential bullish disruption that could invalidate the bearish thesis:
---
🟢 Bullish Disruption Possibility:
1. False Breakdown / Liquidity Grab:
Price may fake a dip below the red resistance-turned-support zone to trigger stop-losses before reversing.
This is known as a liquidity sweep or bear trap.
2. Higher Low Formation:
If the pair pulls back slightly but forms a higher low above 1.1700, it may signal bullish continuation.
3. Breakout Confirmation:
A strong bullish candle above 1.1775 could confirm continuation toward 1.1830–1.1850.
4. Fundamental Catalyst:
Positive EU economic news or dovish signals from the U.S. Fed could support Euro strength.

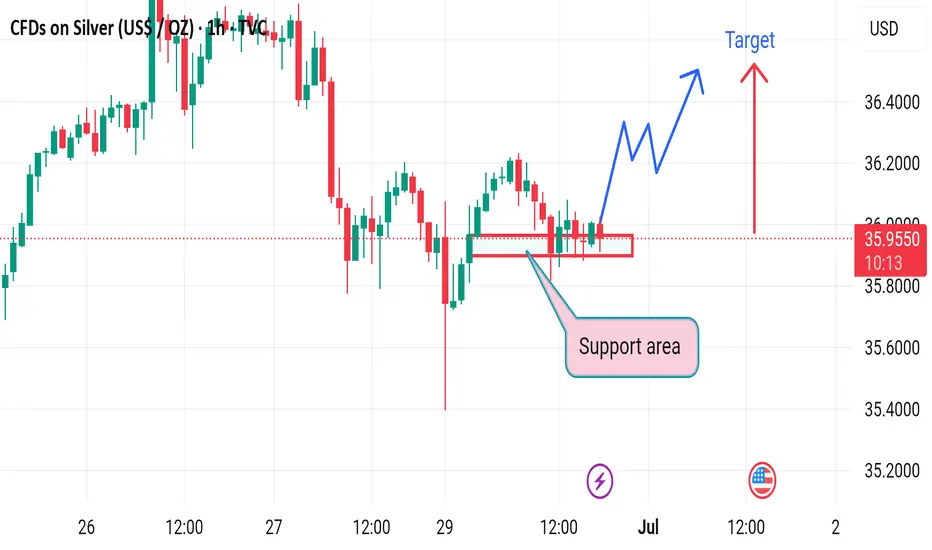
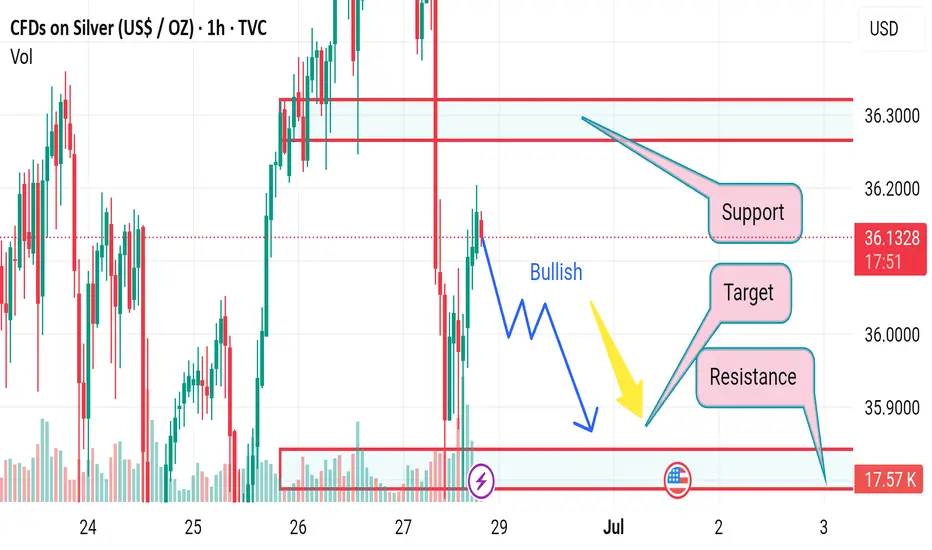
Market next target 🔀 Disruption Analysis - Alternative Scenario
While the current chart suggests a bullish breakout from the support area around $35.85–$35.90 with an upward target above $36.20, a potential bearish disruption scenario could unfold under the following conditions:
⚠️ Bearish Disruption Possibility:
1. Weakening Buying Pressure:
Price has tested the support zone multiple times, showing signs of weakening bullish momentum.
Buyers may be exhausting near the $36.00 area without strong follow-through.
2. Break Below Support:
If price breaks and closes below $35.85 support zone on high volume, it could invalidate the bullish setup.
This would create a lower low, indicating a potential trend reversal to the downside.
3. Next Downside Targets:
Immediate support lies around $35.60.
Further downside could take price to $35.40 if bearish momentum strengthens.
4. Bearish Triggers:
Negative economic data (especially U.S.-related as indicated by the calendar icon).
Rising DXY or bond yields may pressure silver prices
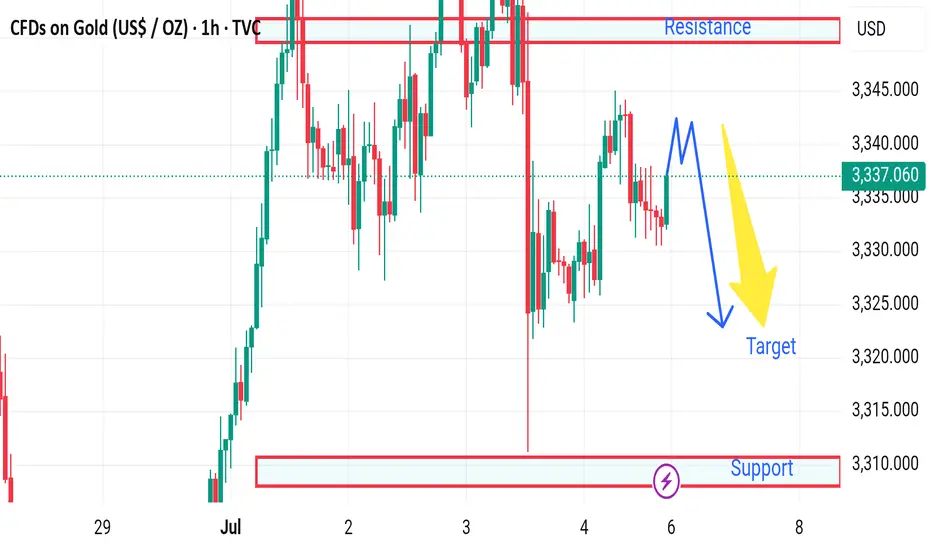
Market next move 📉 Gold Price Disruption Analysis – 1H Chart
Current Price: $3,282.880
Timeframe: 1-Hour
Trend Direction: Bearish bias with possible continuation toward $3,250
---
🔻 Bearish Scenario (Planned Path):
Support Turned Resistance: The area around $3,290 acted as strong resistance (previous support). Price failed to break above.
Lower High Formation: Price has created a lower high, indicating potential continuation to the downside.
Projected Target: A zigzag downward move is expected, with a target near $3,250, aligning with a key demand/support zone.
---
⚠️ Disruption Possibilities (Unexpected Movements):
🔁 1. Bullish Disruption Risk:
If buyers step in aggressively above $3,283–$3,285, we may see:
A break of structure
A reversal toward the $3,290+ zone
Possible formation of a double bottom or inverse head and shoulders
Disruption Target: $3,295–$3,300
🧨 2. False Breakdown at Support ($3,250):
Market could dip slightly below $3,250 to trap sellers and then reverse sharply.
A liquidity grab might lead to sudden bullish pressure, creating a disruption bounce.
📊 3. Fundamental Disruption Factors:
US Dollar strength/weakness
Fed interest rate news
Inflation data releases
These can instantly invalidate technical patterns and push price in either direction.

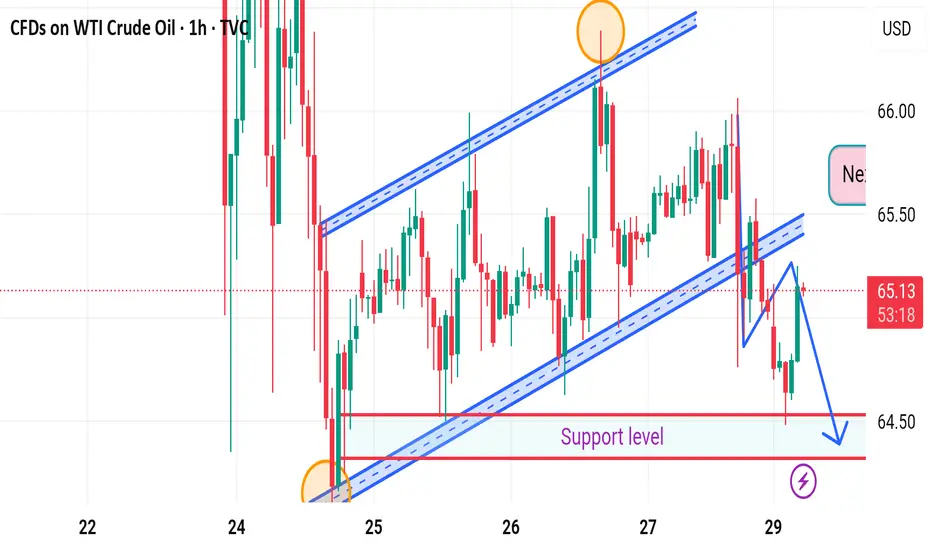
Market next move 🔄 Disruption Analysis: Contrarian View
⚠️ Original Viewpoint Summary:
The original analysis suggests a bearish breakdown from the rising channel, with a short-term target of 64.36, pointing to a move towards the support zone.
---
📉 Disrupted (Contrarian) Perspective:
🔁 Fakeout Scenario Possibility:
The sharp drop below the trendline may be a bear trap.
Price quickly bounced back into the channel region, showing buyer interest near the support.
🔎 Key Observations:
Wick rejection near the lower support suggests that demand is active around 64.50–64.36 zone.
The structure of higher lows is still valid unless there's a confirmed close below the support box.
Momentum indicators (not shown) may help validate whether this is a temporary pullback or a deeper correction.
📈 Alternative Projection:
If price holds above the support zone, it could rebound back to test 65.50–65.80 resistance.
A false breakdown followed by consolidation may lead to retest of the upper channel (near 66.00).
---
🧭 Revised Strategy Suggestion:
Avoid early shorts unless there is a confirmed candle close below 64.36.
Watch for bullish price action near support (hammer, engulfing) for a potential long re-entry.
Reevaluate if WTI forms a base around 64.40 — possible reversal setup.
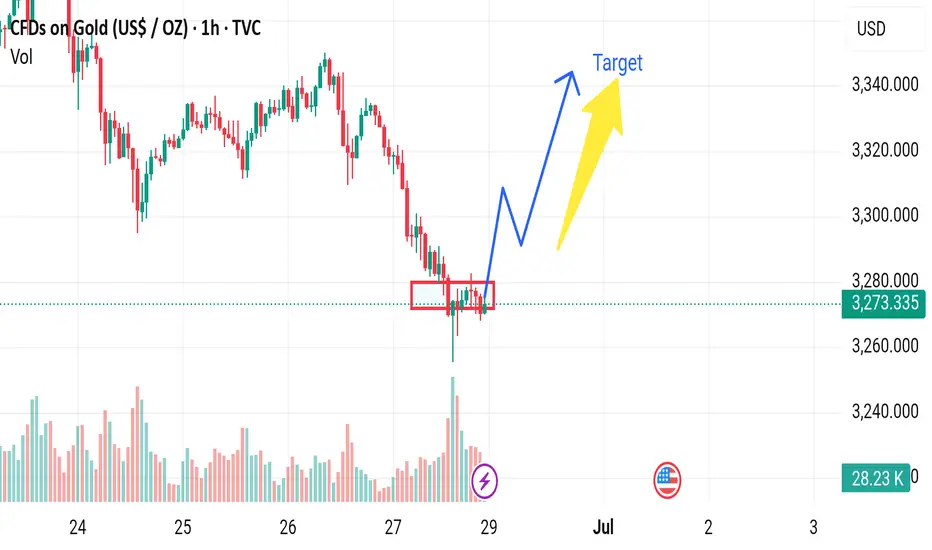
Market next target 🟥 Disrupted (Bearish or Cautious) Analysis:
1. Failed Bullish Attempt Risk
While a bounce from the support zone (~3,260 USD) is visible, the momentum lacks strong bullish confirmation. The rejection from the support area could be a dead-cat bounce, especially since the overall trend leading into this zone was sharply downward.
2. Volume Divergence
The volume spike on the large red candle suggests heavy selling pressure, not accumulation. The weak follow-up volume on the minor green recovery bars indicates a lack of buyer confidence.
3. False Breakout Possibility
If price does push toward the “Target” or even the “Resistance” zone (3,290–3,310), it might be a bull trap, luring late buyers in before a reversal back downward.
4. Bearish Continuation Scenario
Price may retest the support zone (3,260) again.
If this support breaks decisively, it could trigger a strong sell-off, with potential to test lower zones around 3,240 or even 3,200.
Market next move Disruption (Bearish Scenario):
1. False Breakout Risk:
The price has recently tested the lower support range (red boxes) several times without strong follow-through. This could suggest weak buying momentum.
2. Volume Spike Trap:
The large volume spike on the wick down may represent stop-loss hunting or a liquidity grab rather than true accumulation. If it were strong accumulation, we would expect a more sustained bounce.
3. Resistance Zone Ahead:
The price is nearing resistance around $3,275–$3,280, where previous breakdowns started. If it fails to break above this zone decisively, a rejection and continued downtrend is possible.
4. Lower High Formation:
The most recent price action could form a lower high, suggesting a continuation of the bearish trend instead of a reversal.
---
🔽 Bearish Path (Alternative Projection):
Price retests $3,275–$3,280, fails to break out.
Drops below the red box support (~$3,260).
Heads toward the next support levels around $3,240 or lower.
📉 "Target becomes invalidated if price fails to hold above the red box support zone."
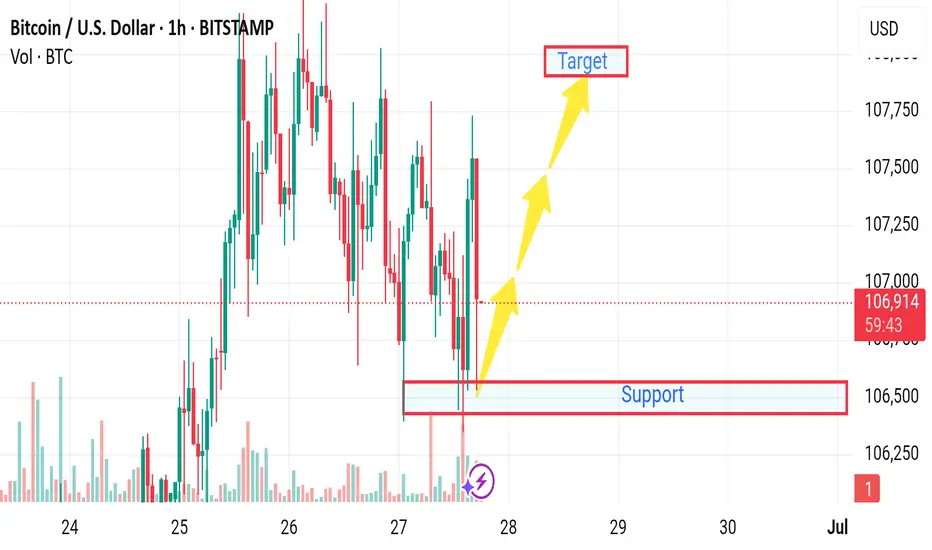
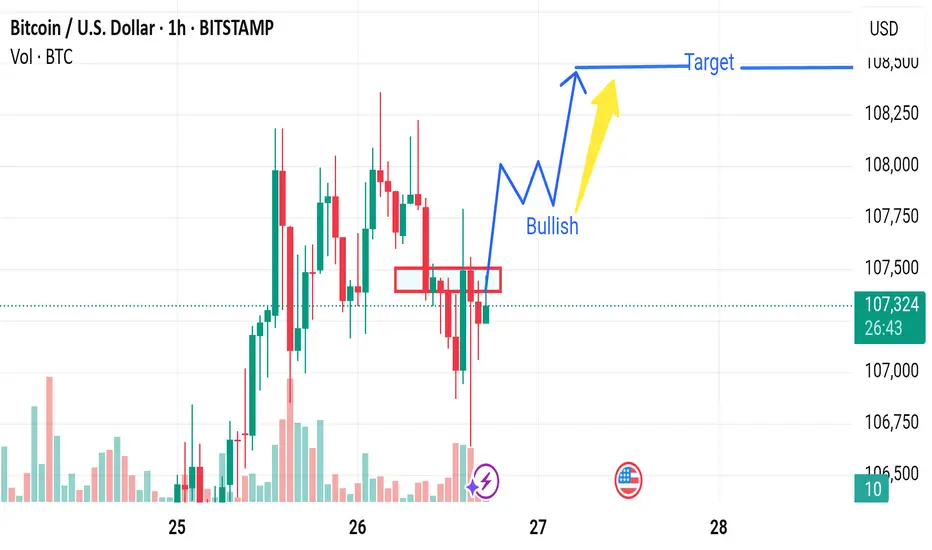
Market next target ⚠️ Disruption & Analytical Weaknesses:
1. Support Zone Already Broken (Wick Penetration):
The candlestick wick clearly pierced the support level drawn on the chart.
This indicates that buyers are weak at that level — the support is not holding firmly.
Relying on this support for a bullish bias is risky, as it may soon turn into resistance.
2. Volume Confirms Weakness, Not Strength:
The bounce from the support zone happens on low or declining volume, suggesting lack of strong buying interest.
A legitimate bullish reversal should be backed by a volume surge — here, that’s absent.
3. False Sense of Recovery:
The analysis shows arrows projecting straight up to the “Target” level, implying a smooth bullish recovery.
This is unrealistic given the recent choppy price action and repeated failures to hold gains above 107,200.
Price action suggests uncertainty or distribution, not clean bullish momentum.
4. Tight Range and High Volatility Ignored:
Price has been ranging between ~106,400 and ~107,600 with rapid whipsaws.
This kind of structure is often indicative of indecision, and setting a clear directional target without breakout confirmation is premature
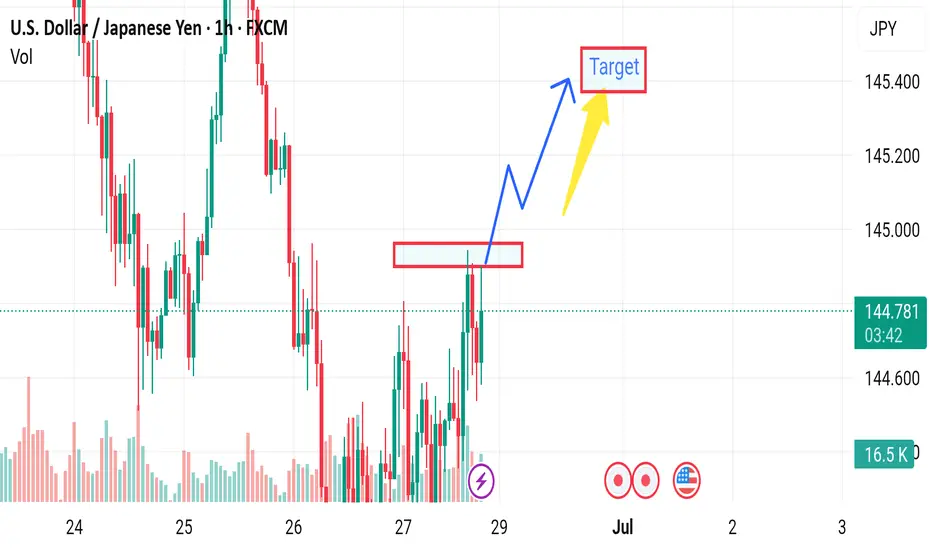
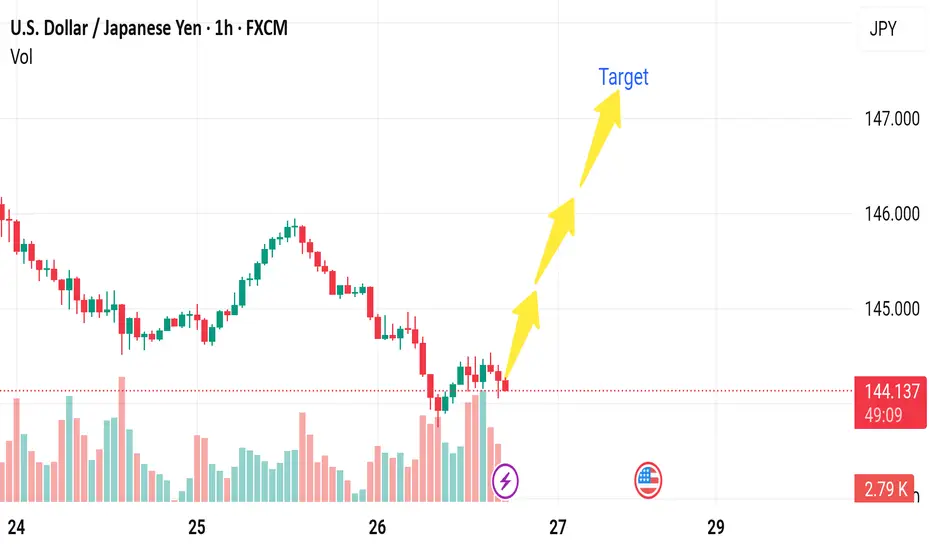
Market next target ⚠️ Disruption & Counterpoints:
1. Premature Breakout Bias:
The chart shows price repeatedly rejecting the resistance zone (highlighted in red).
The arrow assumes a clean breakout without confirmation — this is speculative, as the price hasn’t closed convincingly above the resistance.
This could easily turn into a false breakout or double top if price fails again.
2. Volume Mismatch:
A breakout should be backed by strong bullish volume. However, the current volume is mixed and not showing a clear surge in buyer strength.
Lack of volume confirmation makes the breakout less reliable.
3. Ignoring Recent Rejections:
The red zone was tested multiple times in the last sessions without success. That typically signals strong supply or institutional selling.
Repeating this setup without accounting for historical failure adds downside risk.
4. Missing Bearish Scenario:
No alternate path is considered. A failed breakout could lead to a pullback toward 144.00 or lower, especially with U.S. news events (indicated by the flag).
A balanced analysis should always prepare for both breakout and rejection.
5. Macroeconomic Event Risk:
Similar to the GBP/USD chart, this one also shows an upcoming U.S. economic event. That could heavily move USD/JPY, and technical setups may become invalid fast.
The analysis ignores the need to wait for the news catalyst or confirmation after the release.
Market next move ⚠️ Disruption & Counterpoints:
1. Labeling Error – "Bullish" in a Bearish Trend:
The chart clearly shows a strong downtrend starting after the peak on June 28.
Despite this, the word "Bullish" is used alongside a downward zigzag, which is misleading. This is not a bullish structure — it's a bearish continuation pattern or possibly a bear flag, which suggests further downside.
Using “Bullish” here may confuse traders into thinking a reversal is expected, while the actual trend favors further decline.
2. No Confirmed Reversal Pattern:
There's no double bottom, inverse head and shoulders, or any bullish candlestick formation (e.g., engulfing or hammer) to indicate a likely bullish reversal.
Without strong reversal signals, expecting a bullish move here lacks technical support.
3. Target Box Ambiguity:
The “Target” box is not clearly justified. There are no Fibonacci levels, previous support zones, or measured move explanations backing it.
A target should be based on a technical level — such as the bottom of a previous range, a support zone, or a projection from a pattern.

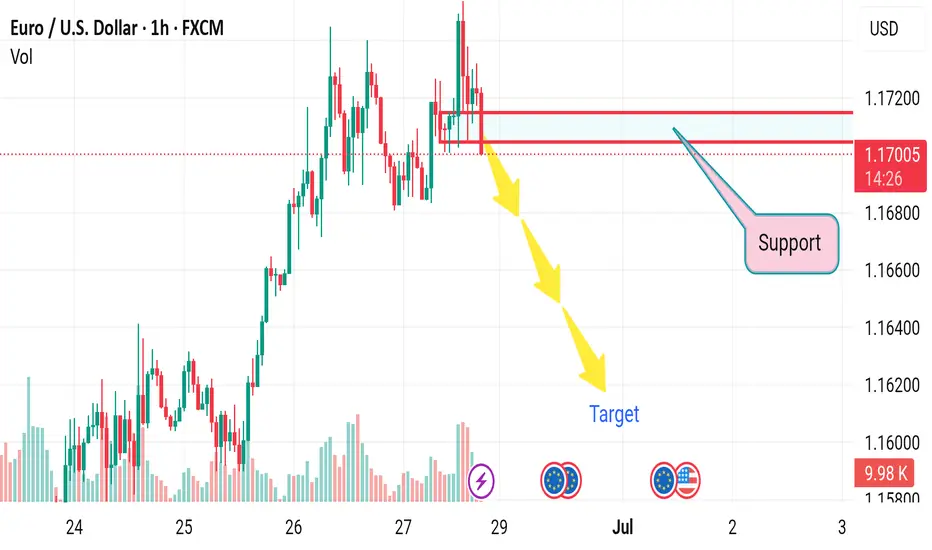
Market next target 🔍 Disruption Analysis of the EUR/USD Chart
1. "Support" Label Positioned at the Current Price Level
Disruption: The chart marks 1.1705 as “Support,” but price is sitting directly on or slightly above it.
Challenge: If price is already breaking through or hovering at support without bouncing, it’s a sign of weakness — this zone may no longer be valid as support.
✅ Correction: Re-label this area as “Potential Resistance” if a breakdown confirms.
---
2. Directional Bias Assumes Continuation Without Confirmation
Disruption: Three yellow arrows indicate a bearish continuation, yet no bearish candlestick pattern, volume spike, or break-close-below-support has been confirmed.
Challenge: This is a premature projection that lacks price action validation.
✅ Correction: Wait for a confirmed candle close below 1.1700 with increased volume to validate the move.
---
3. Volume Ignored Despite Clear Clues
Disruption: There is rising volume during the move down near support — this could indicate either strong selling or smart money accumulation.
Challenge: Volume analysis is completely overlooked, missing a critical layer of confirmation.
✅ Correction: Analyze the volume spike on the red candles; if followed by weak follow-through, a bullish reversal may be setting up instead
Market next move 🔍 Disruptive Analysis of the Original Chart
1. Labeling Conflict: "Bullish" with Bearish Arrow
Disruption: The term "Bullish" is written, yet the arrow clearly shows a downward movement. This is contradictory.
Challenge: A downward movement typically suggests bearish sentiment. Either the label is incorrect, or the directional analysis is flawed.
2. Support/Resistance Confusion
Disruption:
The chart shows "Support" at around 36.15 but labels the zone below it as "Target" and "Resistance", which is illogical.
Resistance should be above the current price; support below.
Challenge: It appears that the analyst has inverted the traditional roles of support and resistance.
3. Unclear Volume Interpretation
Disruption: The volume at the bottom is not analyzed or discussed. Yet volume spikes correlate with high selling pressure near resistance.
Challenge: Without volume context, predicting price movement is speculative.
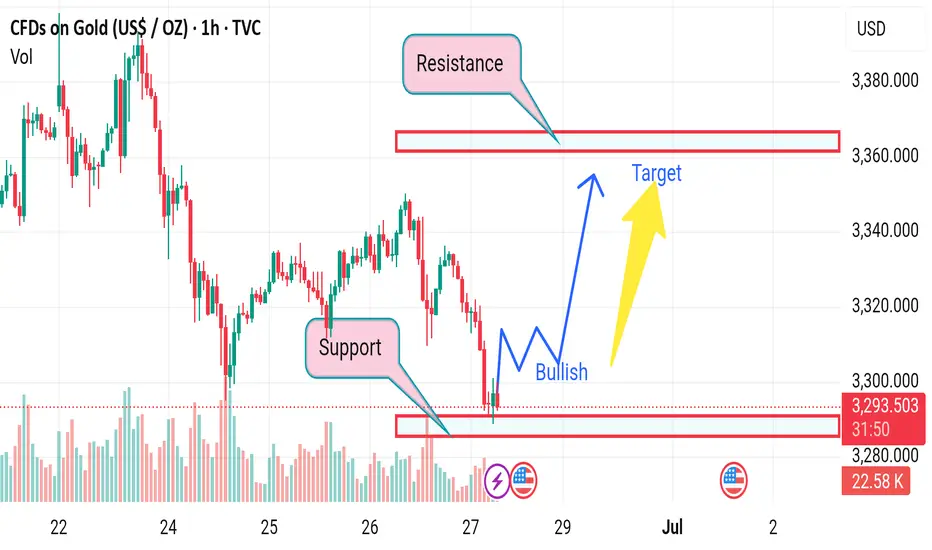
Market next move 🔍 Disrupting the Original Bullish Bias
The original analysis assumes a bullish reversal from the support zone aiming for a resistance target near $3,360. However, let’s challenge that with an alternate (bearish or neutral) perspective:
---
⚠️ 1. Support May Not Hold
Price has tested the support zone multiple times, increasing the probability of a breakdown.
Repeated testing weakens support levels; a breakdown below $3,280 could trigger panic selling or stop-loss hunts, accelerating the drop.
---
📉 2. Bearish Momentum is Dominant
The overall trend is downward, with lower highs and lower lows.
The current bounce could be a dead cat bounce — a short-lived recovery before another drop.
---
📊 3. Volume Analysis
There's no significant bullish volume spike at the support, which weakens the bullish thesis.
This suggests lack of strong buying interest, a red flag for bullish continuation.
---
🔄 4. Resistance May Hold Strong
The resistance area around $3,360 has shown previous strong rejections.
Even if price rises, it could stall or reverse before reaching the target.
Market next target 📉 Disruption: Bearish Outlook Contradiction
1. Resistance Zone Rejection:
The price action is repeatedly failing near the 107,800–108,000 resistance zone.
The chart shows several long upper wicks, indicating strong selling pressure when BTC tries to move higher.
2. False Breakout Risk:
The recent bullish candle with a long lower wick could be a bull trap—designed to lure buyers before a reversal.
Price may retest the red box (support turned resistance) and fail to hold above it.
3. Volume Analysis:
Despite a small recovery, volume is not increasing significantly, which is not typical of a strong bullish move.
A lack of strong buyer volume could indicate exhaustion.
4. Lower High Structure:
The chart is still forming lower highs, a sign of a downtrend continuation unless it breaks above 108,000 convincingly.
Market next move Disruption of the Bullish USD/JPY Analysis
1. Weak Bullish Momentum
The current bullish attempt is showing small-bodied candles with low follow-through.
Disruption: This suggests a lack of conviction from buyers. If there’s no strong bounce soon, it could indicate distribution rather than accumulation.
2. Volume Imbalance
Notice the recent spike in bearish volume (red bars), especially during the last price drop.
Disruption: Volume is supporting the downtrend, not the rebound. This suggests sellers are still in control.
3. Lower High Structure
The price recently failed to form a higher high and continues forming lower highs and lower lows.
Disruption: This pattern is a classic sign of a continuing bearish trend, contradicting the bullish target.
4. Fundamental Headwinds
The U.S. economic icon (flag) suggests an upcoming high-impact event — likely NFP, GDP, or rate decision.
Disruption: If U.S. data is weak or if there's talk of the Fed pausing rate hikes, USD could weaken, pushing USD/JPY further below 144.000.
Market next target 🔁 Disruption of the Current Bullish Analysis
1. Resistance Rejection Likelihood
The chart suggests a breakout above resistance will turn the red box into support.
Disruption: The price is currently at a key resistance zone, and multiple rejections in this area previously suggest selling pressure.
We could see a double top formation or a false breakout trapping bulls.
Look for wicks or long upper shadows indicating weakness.
2. Volume Divergence
Recent bullish candles show declining or inconsistent volume.
Disruption: A strong bullish breakout requires rising volume. If volume doesn't confirm price action, this move may lack conviction and reverse sharply.
3. Overbought Conditions
After a strong uptrend, RSI or Stochastic indicators (not shown, but implied) could be entering overbought territory.
Disruption: This suggests limited upside and a potential for mean reversion or correction.
4. Bearish Candlestick Pattern Watch
Watch closely for a bearish engulfing, shooting star, or evening star at this resistance zone.
Disruption: Any bearish reversal pattern here would strongly contradict the bullish breakout thesis.