BTC/USD (Bitcoin vs USD).BTC/USD (Bitcoin vs USD)
Timeframe: 2-hour (2H)
Indicators: Ichimoku Cloud, Trendline, Support/Resistance zones
---
📊 Indicators Used
1. Ichimoku Cloud
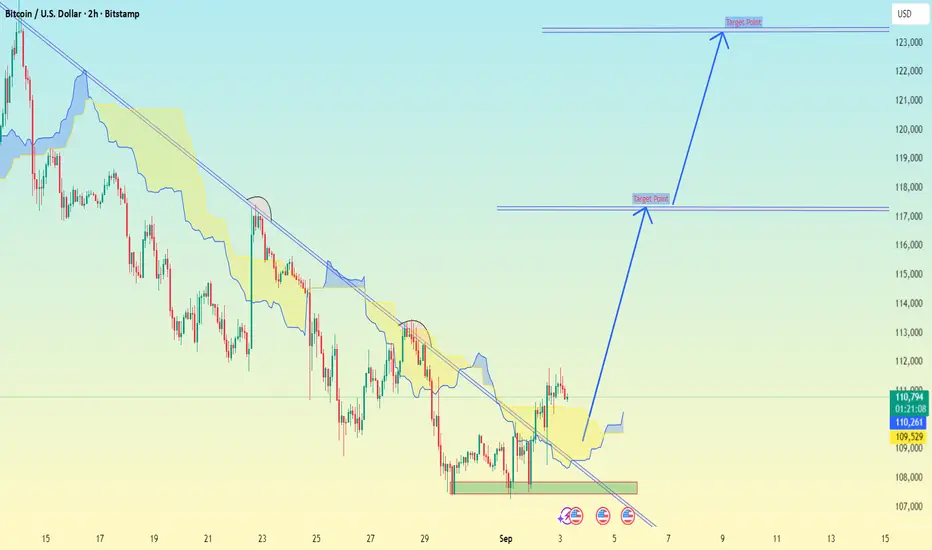
Price recently broke above the descending trendline and is pushing into the cloud.
If it sustains above the cloud, that signals a potential trend reversal from bearish to bullish.
2. Support Zone (Green box)
Around 109,000 – 110,000 USD.
This is the base where buyers are stepping in.
3. Trendline Breakout
A downtrend line has been broken, suggesting the end of the short-term bearish momentum.
---
🎯 Targets (Based on my chart)
Target 1 (short-term): 117,173 USD
This is the first major resistance level.
Target 2 (medium-term): 123,000 USD
Next strong resistance zone and the final target marked on my chart.
---
⚠ Stop-Loss Suggestion
Below the support zone: ~108,500 – 109,000 USD
This protects against a false breakout.
---
✅ Summary
Breakout above downtrend line and moving into Ichimoku cloud = bullish signal.
First target: 117,173 USD
Second target: 123,000 USD
Stop-loss: Below 106,000 USD
Forexupdate
EUR/USD – Golden Crossover & Breakout Confirmation (Multi-T.F)EUR/USD is showing strong bullish signs across both the weekly and daily timeframes, suggesting a potential macro trend reversal in the making. After being trapped below a long-term descending trendline for nearly two years, price has not only broken out but also successfully retested the breakout zone — a key validation for trend continuation.
On the daily chart, a Golden Crossover is now forming, which historically precedes major uptrends in forex pairs. Combined with reclaiming key structural levels and building higher lows, EUR/USD could be positioning for a powerful upside move in Q2 2025.
Let’s dive into the multi-timeframe analysis to understand why this setup could be one of the cleanest trend reversals on the board.
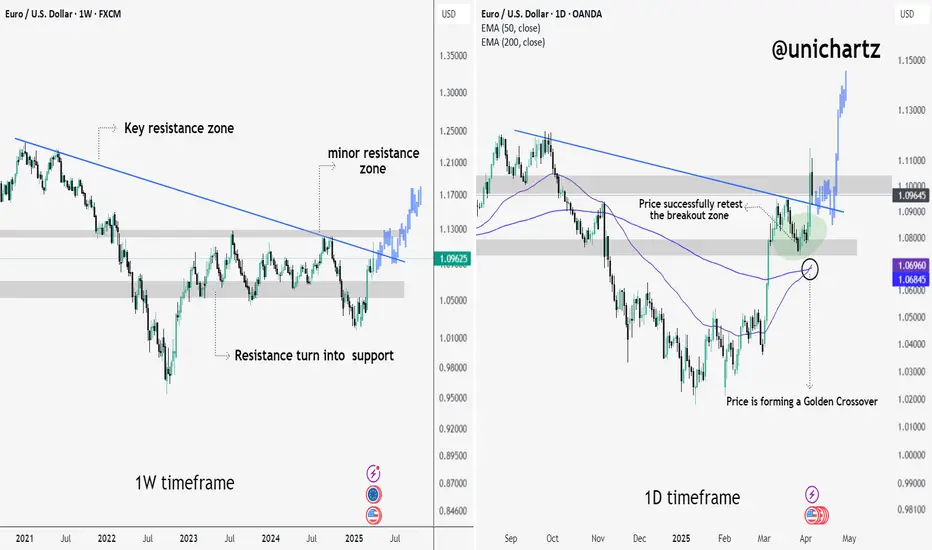
1W Timeframe – Macro Breakout in Progress
EUR/USD has officially broken out of a long-standing descending resistance trendline. This breakout occurred from a structurally important zone that had acted as a ceiling for over 2 years.
📌 Key Observations:
🔹 Price reclaimed and held above the key resistance zone, turning it into strong support.
🔹 Minor resistance zones lie ahead, but structure favors further upside.
🔹 Projection shows potential continuation toward 1.16+ if momentum sustains.
1D Timeframe – Bullish Retest + Golden Cross Forming
Zooming into the daily chart, we see:
✅ A successful retest of the breakout zone, which held as support (bullish confirmation).
✅ Price is now forming a Golden Crossover – where the 50 EMA is crossing above the 200 EMA. This is typically seen as a strong bullish signal in trending markets.
📌 What’s Bullish:
Clean breakout ✔️
Retest with strength ✔️
Momentum crossover ✔️
EUR/USD is now in a strong bullish structure, backed by a confirmed breakout on the weekly and a golden crossover on the daily. If price holds above 1.09, we may see continued upside toward 1.13–1.16 levels in the coming weeks.
Thank you for reading and supporting @unichartz. If you found this analysis helpful, don’t forget to like, follow, and share! 💙
EURUSD ANALSYSIS FOR 29/11/2023In this video, I talked about eurusd (the only pair I trade). I made a full break down from the weekly timeframe all the way down to the daily timeframe. I talked about what the market had done and what I expect the market to do over the next few hours. I also talked about the levels I'm going to be watching out for before I take a trade on the pair. I'm sure you're going to enjoy this video so do not forget to give me a boost, and follow.
