Index/US) Bearish trend analysis Read The caption)SMC trading point update
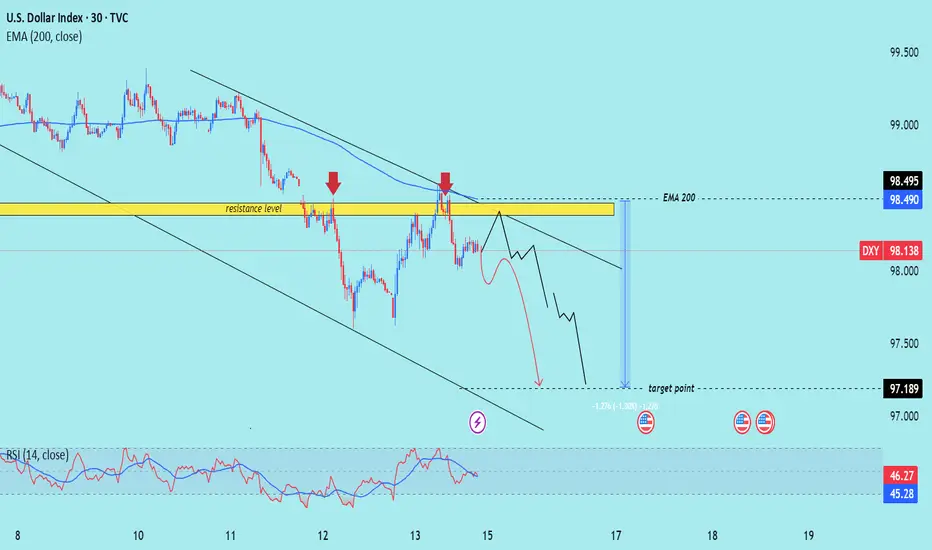
Technical analysis of U.S. Dollar Index (DXY) on the 30-minute timeframe, with the price respecting a clear downtrend and repeatedly rejecting a resistance zone near the 200 EMA.
---
Analysis Breakdown
Key Technical Elements:
1. Downtrend Structure:
The price remains within a descending channel.
Multiple lower highs and lower lows signal sustained bearish pressure.
2. Resistance Zone:
Highlighted near 98.490–98.495, aligned with the EMA 200.
Multiple rejections from this level (indicated by red arrows), confirming strong supply.
3. EMA 200 (98.490):
Acts as dynamic resistance.
Price is below it, reinforcing the bearish bias.
4. Projected Move:
Bearish price path targets the 97.189 level (target point).
A measured move of approximately -1.30% is illustrated.
5. RSI (14):
RSI currently at 46.27, below the neutral 50 mark.
This confirms bearish momentum without being oversold, leaving room for further downside.
---
Bearish Thesis:
Repeated failure to break above key resistance + downward channel + RSI weakness suggests a continuation to the downside.
Short-term consolidation expected before breakdown continuation.
---
Trade Idea Concept:
Entry: Sell on a minor pullback near resistance (~98.300–98.490), or breakdown below the recent minor support.
Target: 97.189 zone.
Stop Loss: Above 98.500 or EMA 200 to invalidate the bearish setup.
Mr SMC Trading point
Risks to Watch:
A break and strong close above 98.500 would invalidate the bearish structure and could initiate a trend reversal.
Economic events (noted by calendar icons) may trigger volatility – ideal to monitor closely around those times.
plesse support boost 🚀 this analysis)
Foryourpage
USD/JPY) Bearish trend analysis Read The ChaptianSMC trading point update
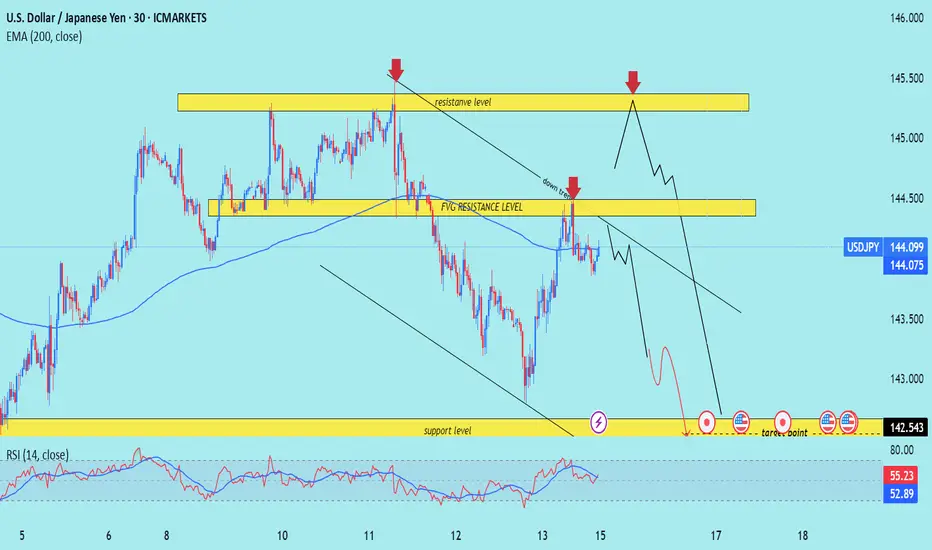
Technical analysis iUSD/JPY on the 30-minute timeframe, showing a rejection from resistance zones and a potential move toward lower support levels.
---
Analysis Breakdown
Technical Components:
1. Resistance Zones:
Primary Resistance: Near 145.500 (upper yellow box), which has previously been rejected multiple times (red arrows).
FVG (Fair Value Gap) Resistance Level: Around 144.400, also acting as strong resistance, especially near the EMA 200.
2. Downtrend Line:
The price is moving below a downward trendline, respecting bearish structure.
Last rejection from both the trendline and FVG zone confirms selling pressure.
3. EMA 200 (144.075):
Price is hovering around this level, showing indecision.
Bearish bias remains unless price breaks and holds above it.
4. Target Zone:
A clearly marked support level around 142.543, shown as the bearish target.
Includes multiple event markers (potential news catalysts or key dates), suggesting added volatility.
5. RSI (14):
Currently near 55.23, with a prior rejection from higher RSI levels.
Bearish divergence not clear, but no overbought conditions.
---
Bearish Idea Summary:
Thesis: Rejection from resistance zones + trendline + EMA suggests continuation to downside.
Expecting: Price to either:
Retest the upper resistance zone (around 145.000–145.500) and reject again, or
Break below current levels and continue lower toward 142.543.
---
Trade Idea Concept:
Entry Option 1: Sell on confirmed rejection from FVG zone or upper resistance.
Entry Option 2: Sell on break and retest below 144.000.
Target: 142.543 (support zone).
Stop Loss: Above the resistance zone or trendline (e.g., >145.600).
Mr SMC Trading point
Risks to Watch:
Invalidation: Clean break and close above 145.500 would invalidate the bearish setup.
News Impact: Note the icons near the target zone – monitor economic releases around that time.
---
Please support boost 🚀 this analysis)
XUA/USD) Bullish trand support level Read The captionSMC trading point update
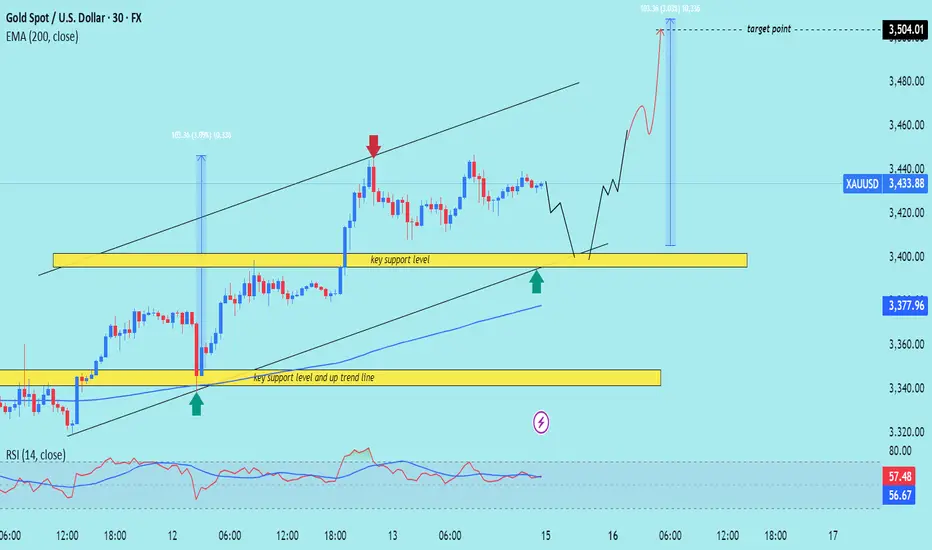
Technical analysis of (XAU/USD) on the 30-minute timeframe, incorporating a support zone and trendline confluence strategy. Here's a breakdown
---
Analysis Summary
Key Technical Elements:
1. Uptrend Channel:
Price is trading within a rising channel.
Higher highs and higher lows indicate bullish momentum.
2. Support Zones:
Key Support Level (near 3,400): A horizontal support zone has been marked where price previously bounced (confirmed by green arrows).
Trendline Support: This upward sloping trendline adds confluence to the horizontal support zone.
3. EMA 200 (3,377.96):
Acts as a dynamic support level.
Price is well above the EMA, supporting bullish sentiment.
4. Projected Price Move:
The chart anticipates a dip back to the support area (~3,400), followed by a bullish bounce.
Target is clearly defined at 3,504.01, with a measured move of about +103.36 points from the support.
5. RSI Indicator:
RSI is around 57, which is neutral to slightly bullish.
No overbought/oversold signal yet – supporting potential for more upside.
---
Bullish Bias Reasoning:
Confluence Zone: Horizontal + trendline + EMA 200.
Healthy Price Structure: Higher lows being maintained.
Momentum Indicator (RSI) supports continuation.
---
Risks / Considerations:
If price breaks below the confluence support (~3,400), bullish invalidation may occur.
Monitor for false breakouts or heavy selling pressure near resistance.
Mr SMC Trading point
---
Trading Plan
Buy Zone: Around 3,400 (support confluence).
SL: Below the trendline/EMA – e.g., 3,370 or lower.
TP: Around 3,504 (target zone marked).
Please support boost this analysis)
USD/JPY) bearish Technical Analysis Read The captionSMC trading point update
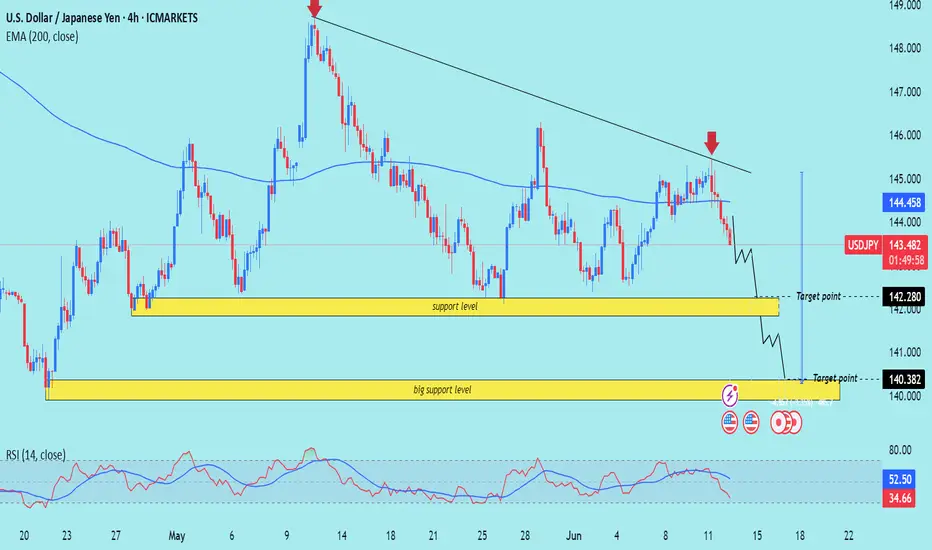
Technical analysis of USD/JPY (U.S. Dollar vs. Japanese Yen) on the 4-hour timeframe. Here's a breakdown of the analysis:
---
Trend & Price Action
The chart shows a descending trendline connecting recent lower highs, indicating a downtrend.
Current price: 143.548
Price has recently rejected off the trendline and started to fall, suggesting continued bearish momentum.
A red arrow marks the rejection point, emphasizing a key resistance area.
---
Technical Indicators
EMA 200 (Exponential Moving Average): At 144.459 — the price is currently below the EMA, reinforcing the bearish outlook.
RSI (Relative Strength Index):
RSI (14) values: around 35.45, which is near the oversold threshold (30) but not quite there yet.
Indicates increasing bearish momentum but no reversal signal yet.
---
Support Levels Identified
1. Support Level (Target 1): ~142.280
First target point for bears. Likely to see some reaction or consolidation here.
2. Big Support Level (Target 2): ~140.382
A stronger, more significant support zone and a deeper bearish target if the first support breaks.
---
Bearish Target Scenario
The projected path (in black lines) suggests:
A further drop into the 142.280 zone.
If that breaks, a continuation toward the 140.382 level.
This suggests a swing trade setup favoring short positions if the price respects the current rejection zone.
Mr SMC Trading point
---
Conclusion
Bias: Bearish
Resistance Confirmed: Rejection from descending trendline and below EMA200.
Bearish Targets:
Short-term: 142.280
Medium-term: 140.382
Risk Management: Watch RSI for potential bullish divergence near the second support zone, which could indicate reversal or consolidation.
---
Please support boost 🚀 this analysis)
USD/CAD) Down Trand analysis Read The captionSMC trading point update
Technical analysis of USD/CAD (U.S. Dollar / Canadian Dollar) currency pair on the 2-hour timeframe, and it suggests a potential sell setup based on price action, key levels, and momentum indicators.
---
Chart Summary
Pair: USD/CAD
Timeframe: 2H
Current Price: 1.36432
EMA 200: 1.37436
Direction Bias: Bearish
Volume: 6.92K
Key Tool: EMA 200, RSI, Support/Resistance Zones
---
Technical Breakdown
1. Resistance Zone / Supply Area (~1.3680 - 1.3700)
The yellow box highlights a strong resistance zone.
Marked by three red arrows, where price has repeatedly rejected.
Indicates clear seller dominance in this area.
2. Break of Support Level
Price broke below the yellow support area and is now trading below it.
This signals a bearish breakout from a consolidation zone.
3. EMA 200 Trend Confirmation
EMA 200 (blue line) is sloping down.
Price is below the EMA, confirming bearish trend bias.
Acts as dynamic resistance.
4. Bearish Flag/Channel Break
A bearish flag or wedge pattern seems to have been broken downward.
The measured move (blue vertical line) suggests the projected drop.
---
Target Point
Target Price: 1.34951
This is based on the measured move from the resistance zone.
It aligns with the previous demand/support zone.
---
RSI (Relative Strength Index)
RSI (14) is 36.37, approaching the oversold zone.
This shows strong bearish momentum, but it also means price may stall or bounce slightly before continuing downward.
---
Trade Setup Idea
Entry: After confirmation of breakout below 1.3640
Stop Loss: Above 1.3700 (resistance zone)
Take Profit: 1.34951
Risk-to-Reward: ~1:2+
---
Risk Management & Caution
If price moves back into the yellow zone or breaks above 1.3700, the setup is invalidated.
Watch for high-impact news events (marked on the chart with U.S. flags) that may trigger volatility.
Mr SMC Trading point
---
Conclusion
This is a well-structured bearish idea based on:
Resistance rejections
Break of support
Downward EMA slope
Bearish RSI reading
It reflects strong downside potential toward 1.3495, offering a clean shorting opportunity for swing traders
Please support boost 🚀 this analysis)

GBP/JPY) Bearish analysis Read The captionSMC trading point update
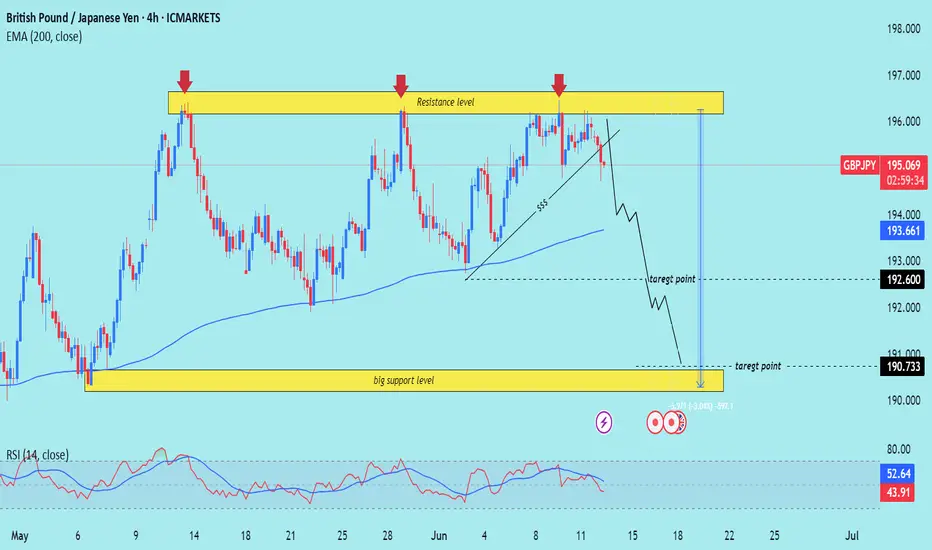
Technical analysis of GBP/JPY (British Pound / Japanese Yen) based on multiple Technical signals on the 4-hour timeframe. Let's break it down in detail:
---
Overall Analysis Summary
Direction Bias: Bearish
Timeframe: 4H
Price (at analysis time): 195.033
Tool Used: EMA 200, RSI, Support/Resistance, Chart Pattern
---
Technical Components
1. Strong Resistance Zone (~195.800 - 196.200)
Marked by 3 red arrows.
Price has rejected this level multiple times, forming a Triple Top pattern.
Suggests strong selling pressure and low probability of price breaking higher in the short term.
2. Trendline Break (Structure Shift)
Ascending support trendline (marked with "$$$") is broken.
This is a key market structure break, indicating the bullish momentum is weakening or reversing.
3. EMA 200 (193.661)
Price is currently just above the 200 EMA.
A clean break and close below the EMA would confirm trend reversal.
EMA often acts as dynamic support/resistance.
---
Target Zones
Two downside targets are indicated:
Target 1: 192.600
Minor support level, could be the first stop for bearish pressure.
Target 2: 190.733
Strong historical support zone (yellow box labeled big support level).
Also aligns with measured move from the top of the range to the base (height of the range).
---
RSI (Relative Strength Index)
RSI (14): ~43.40
Neutral zone (not oversold yet), meaning there’s room for more downside before oversold conditions are hit.
---
Trading Psychology & Risk Management
This setup assumes:
Sellers continue to defend the resistance zone.
Break of structure (trendline + EMA) confirms shift.
Traders may consider short entries below 194.800–195.000 with stops above 196.200.
---
Trade Idea (Based on This Chart)
Entry: Below 194.800 (after break confirmation)
Stop-Loss: Above 196.200
Take-Profit 1: 192.600
Take-Profit 2: 190.733
Risk-Reward: Favorable (~1:2+)
Mr SMC Trading point
---
Caution
If price reclaims 196.200 and closes above the resistance, bearish setup is invalidated.
Watch for fakeouts near EMA.
plesse support boost 🚀 this analysis)
XAU/USD) Breakout strong bullish trend Read The captionSMC Trading point update
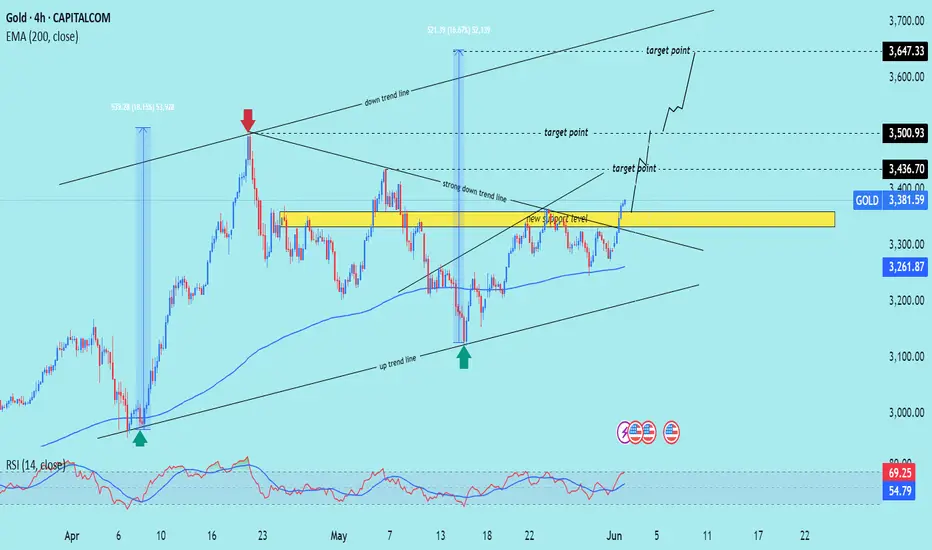
Technical analysis chart of gold (XAUUSD) on the 4-hour timeframe. Here’s a breakdown of the key ideas presented in the chart:
---
Key Support/Resistance Zone
A yellow rectangular zone marks a significant support/resistance level.
This level was previously a resistance and has now been flipped into support ("new support level").
---
Trend Analysis
Uptrend line (lower diagonal line): Shows support and higher lows forming a bullish structure.
Downtrend lines (upper diagonals): Show past resistance levels being tested.
Strong downtrend line has now been broken, which is bullish.
---
Target Points
Three bullish targets are marked:
1. $3,436.70
2. $3,500.93
3. $3,647.33
These targets seem to be based on:
Breakout above the resistance zone.
Measured move projections from previous impulsive rallies.
---
Technical Indicators
200 EMA (Exponential Moving Average): Currently at $3,261.87, acting as dynamic support.
RSI (Relative Strength Index):
Current RSI is 54.80, indicating neutral momentum.
Previously touched overbought zone (~69), indicating strong recent bullish momentum.
---
Arrows
Green arrows mark strong bullish bounce points.
Red arrow marks a rejection from the downtrend line (previous resistance).
Mr SMC Trading point
---
Conclusion (Idea Summary)
Price has broken out of consolidation and downtrend resistance.
If the price holds above the yellow support zone and 200 EMA, a bullish continuation is likely.
Targets: $3,436 → $3,501 → $3,647.
Confirmation of breakout and momentum depends on volume and RSI behavior in coming candles.
---
pelas support boost 🚀 analysis follow)
USD/JPY) breakout bearish trand analysis Read The captionSMC trading point update
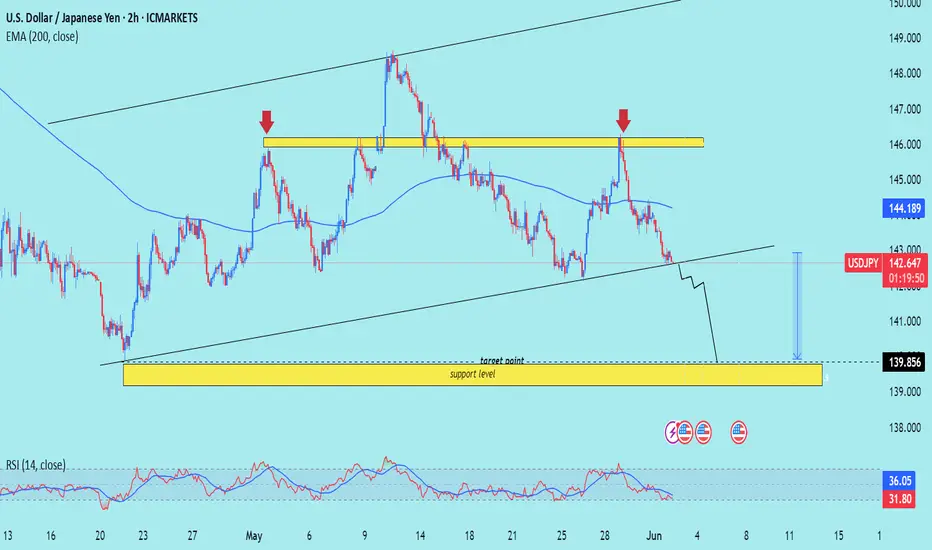
Technical analysis of the USD/JPY (US Dollar / Japanese Yen) pair on a 2-hour timeframe. Here's the idea behind the analysis:
---
Overall Idea: Bearish Move Toward Support
---
Key Levels
Resistance Zone (Yellow Box, Top): Marked with two red arrows — shows strong price rejection around 146.00–147.00 area.
Support Zone (Yellow Box, Bottom): Around 139.85, marked as a target point and support level.
These two zones form the range in which price has been reacting.
---
Current Price Action
Price is currently trading at 142.649, well below the 200 EMA (at 144.190), which is a bearish signal.
It has broken below the mid-range and seems to be heading toward the lower support zone (139.85).
---
Trend & Structure
The price is following a downward trend after rejecting from the resistance zone.
The channel suggests a further leg down is likely to complete a measured move.
A temporary retest of the broken trendline might occur before continuation down.
---
RSI (Relative Strength Index)
Currently around 31.83, nearing oversold territory, indicating the potential for:
A short-term bounce before further downside, or
A reversal near the key support zone.
---
Projection
The projection arrow (blue) suggests a bullish rebound from the 139.85 support zone.
This aligns with a potential buy opportunity once support is confirmed.
Mr SMC Trading point
---
Conclusion (Trade Idea Summary)
Short-Term Bias: Bearish
Medium-Term Setup: Look for a buy opportunity around 139.85, if price reacts well.
Key Steps:
1. Watch for price to reach 139.85.
2. Look for bullish reversal patterns or confirmations at that level (e.g., bullish engulfing, RSI divergence).
3. If confirmed, a potential long trade could target back toward the 144–145 zone.
Please Support boost this analysis )
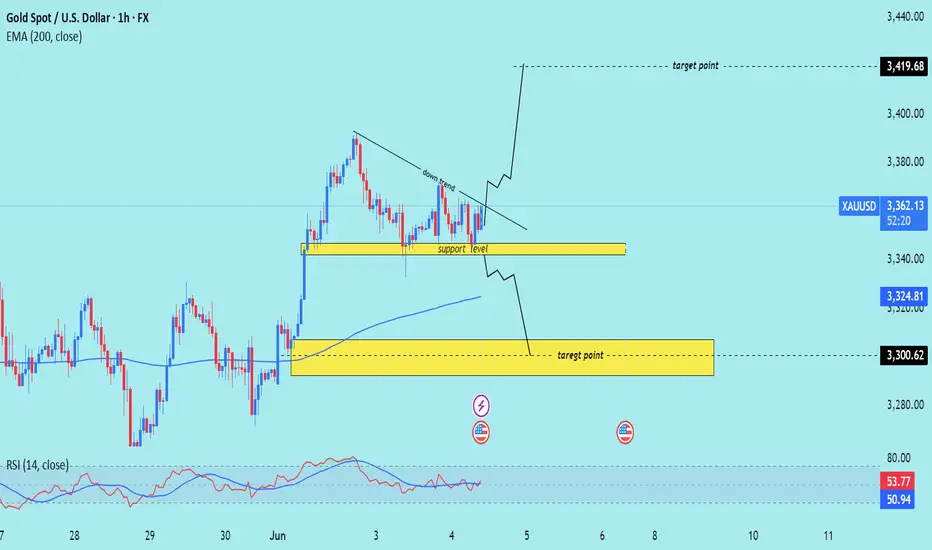
XAU/USD) Technical analysis Read The captionSMC trading point update
Technical analysis of Gold (XAUUSD) on the 1-hour timeframe. Here's a breakdown of the key ideas in the analysis:
---
Chart Elements:
Support Level (Yellow Zone at ~3,340–3,350):
This area has been highlighted as a key support zone where price has bounced previously.
Price is currently hovering just above this level.
Downtrend Line:
A descending trendline is drawn, indicating a short-term bearish trend.
A breakout above this line could trigger bullish momentum.
Two Scenarios Outlined:
Bullish Scenario:
If price breaks the downtrend and holds above support, it may rally towards the upper target point at 3,419.68.
Bearish Scenario:
If price breaks below the support, the next target point is marked lower around 3,300.62, a previous consolidation area and close to the 200 EMA (blue line).
200 EMA (~3,324.72):
Acts as dynamic support. If price moves below it, bearish sentiment may increase.
RSI (Relative Strength Index):
RSI is neutral (~50.54), not showing overbought or oversold signals, leaving room for movement in either direction.
---
Key Takeaways:
Neutral-Biased Setup: The price is consolidating between a clear support level and downtrend resistance.
Confirmation Needed: A breakout from either direction is necessary to confirm the next move.
Bullish Breakout: May lead to a retest of highs at 3,419.68.
Bearish Breakdown: Could push the price toward 3,300.62, aligned with past support and the 200 EMA.
Mr SMC Trading point
---
Trading Ideas (based on this analysis):
Long Entry: On breakout above the downtrend line + confirmation above 3,360.
Short Entry: On breakdown below 3,340 with strong volume.
Stop-Loss: Just outside the consolidation zone depending on trade direction.
Risk Management: Be cautious around economic news (calendar icons shown suggest upcoming events).
Please support boost this analysis )
earish trand analysis Read The ChaptianSMC trading point update
Technical analysis of (BTC/USDT) based on the 4-hour timeframe. Here’s a detailed breakdown of the analysis and the idea behind it:
---
Key Components of the Analysis:
1. Resistance Zone (FVG - Fair Value Gap):
The yellow zone marked as “fvg resistance level” indicates an area where price previously dropped quickly, suggesting inefficiency or imbalance in the market.
Price is approaching this zone again, which acts as a strong resistance.
2. Trendline & Lower Highs:
A descending trendline (with red arrows) shows consistent lower highs, indicating ongoing bearish pressure.
Each rejection from the trendline reinforces sellers’ dominance.
3. CHOCH (Change of Character):
The label “choch” signifies a market structure break, where bullish structure turned bearish.
This marks the transition to a downtrend.
4. EMA 200 (Exponential Moving Average):
The EMA (currently around 102,753) acts as dynamic support.
Price is currently trading above it, but a rejection from the resistance may push it below.
5. Target Zone:
A yellow box near 100,817.99 is labeled “target point”, indicating a possible short-term bearish target if price gets rejected at resistance.
6. RSI (Relative Strength Index):
RSI is around 47.11, slightly below neutral (50), suggesting bearish momentum could be building.
No clear oversold or overbought conditions yet.
---
Trade Idea Summary:
Bias: Bearish
Scenario:
If price reaches the resistance zone (~106,800–107,500) and fails to break above, a sell-off is expected.
First target: 100,800–101,000 zone
Price may also dip below EMA 200 confirming bearish strength.
Confirmation:
Rejection candle or bearish engulfing pattern near resistance.
RSI staying below 50 and starting to dip.
Invalidation:
Clean breakout and close above the resistance zone and trendline (~108,000+).
Mr SMC Trading point
---
Conclusion:
This chart sets up a high-probability short trade around the resistance area, leveraging both structural and momentum indicators. It suggests waiting for confirmation of rejection before entering, targeting the previous support and imbalance zone below.
Pales support boost 🚀 analysis follow)

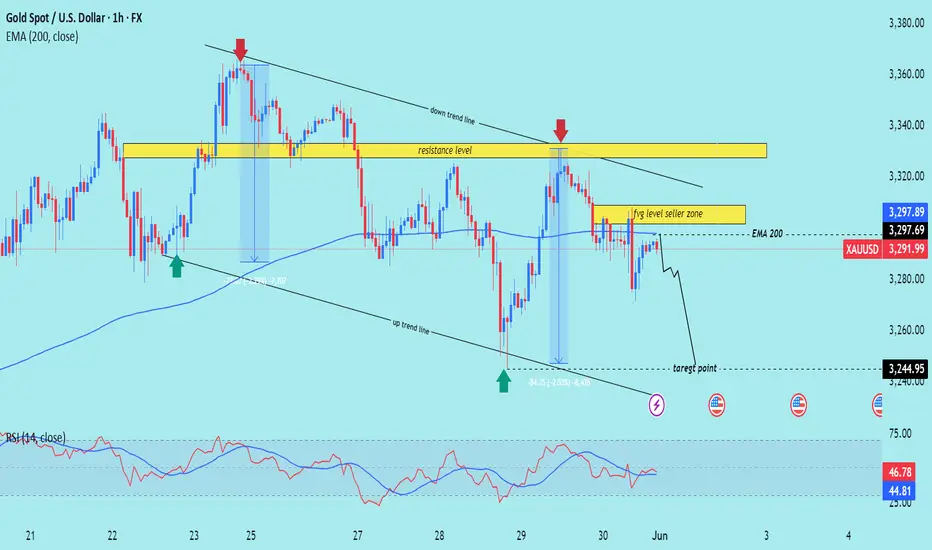
XAU/USD) Bearish trand analysis Read The ChaptianSMC trading point update
Technical analysis of XAU/USD (Gold Spot) on the 1-hour timeframe, based on Smart Money Concepts (SMC). Here's a breakdown of the idea and trading scenario:
---
Overall Idea: Bearish Continuation
---
Market Context
Current Price: $3,291.99
EMA 200: $3,297.69 (acting as dynamic resistance)
Trend: Price is within a descending channel, respecting both downtrend and uptrend lines
Directional Bias: Bearish unless a breakout occurs
---
Key Zones
1. Resistance Level (Sell Zone)
Around $3,320–$3,340
Price rejected this level multiple times → strong supply zone
2. FVG Level (Fair Value Gap)
Around $3,305–$3,315
Price tapped this area and showed rejection
Identified as a "seller zone" – price likely filled imbalance and now resuming trend
---
Projected Move
Price is expected to:
1. Reject EMA and FVG zone
2. Continue downward movement
3. Target support around $3,244.95
---
Indicators
EMA 200: Above price → bearish pressure
RSI (14): ~46.78 → no extreme reading, but leans bearish; room for further downside
---
Trade Idea Summary
Bias: Bearish
Sell Entry: ~$3,300–$3,310 (already triggered)
Stop Loss: Above $3,320
Target: $3,244.95 (demand zone / previous low)
Risk/Reward: Favorable (~1:2+)
Mr SMC Trading point
---
Warnings
Multiple economic event icons are marked (bottom of chart) → potential high volatility, especially around NFP/FOMC-related news
---
pales support boost 🚀 analysis follow)
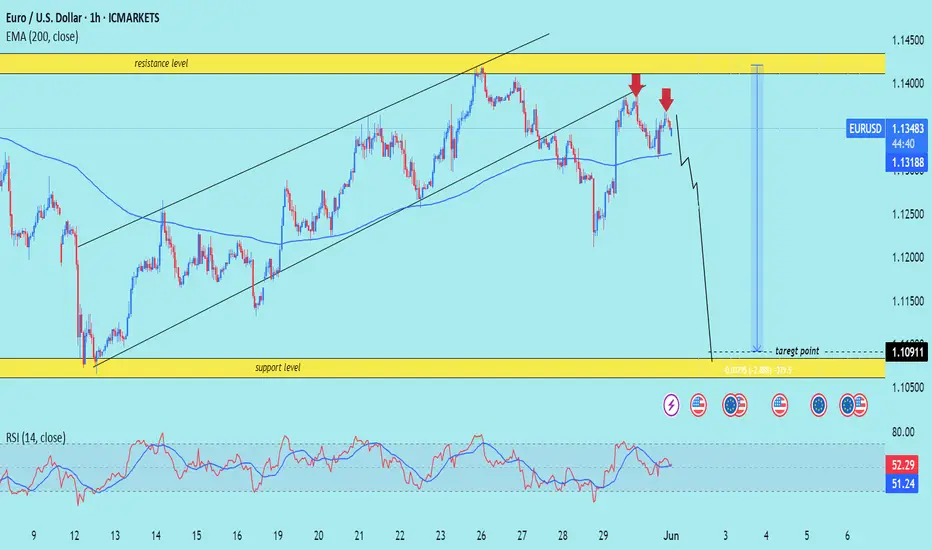
EUR/USD) Bearish breakout analysis Read The ChaptianSMC trading point update
Technical analysis of EUR/USD on the 1-hour timeframe, likely projecting a short-term downward move. Here’s a breakdown of the technical analysis and the trade idea:
---
Key Elements in the Chart:
1. Bearish Rejection from Resistance:
Price was rejected twice near the 1.14400 resistance zone (highlighted in yellow).
The red arrows mark double rejection at this level, suggesting strong selling pressure.
2. Break of Rising Channel:
Price was previously moving inside a rising channel.
Recent price action shows a clear breakdown below the lower trendline, indicating trend reversal.
3. 200 EMA (Exponential Moving Average):
EMA is around 1.13188 and price is below it, reinforcing bearish momentum.
EMA also acted as dynamic resistance after the channel breakdown.
4. Target Zone – Support Area:
The yellow support zone around 1.10911 is the target point.
This was a previous area of price consolidation and demand.
5. RSI (Relative Strength Index):
RSI is near 51, hovering around the neutral zone.
Not strongly bearish yet, but room remains to drop toward oversold if the downtrend continues.
---
Trade Idea Summary:
Bias: Bearish
Scenario:
Price has broken a key structure and is retesting the breakdown.
Expect continuation toward the 1.10900 support zone.
Entry Zone:
Near current price (~1.13400–1.13500), ideally on a retest of the EMA or broken trendline.
Target:
1.10911 (highlighted support level).
Stop-Loss (Invalidation):
A break and close back above the resistance zone (~1.14000–1.14200).
Mr SMC Trading point
---
Conclusion:
This is a high-probability bearish setup following a structure break, retest, and double top rejection. It targets a move back down toward a previously strong support level, with a favorable risk-to-reward ratio.
Pales support boost 🚀 analysis follow)
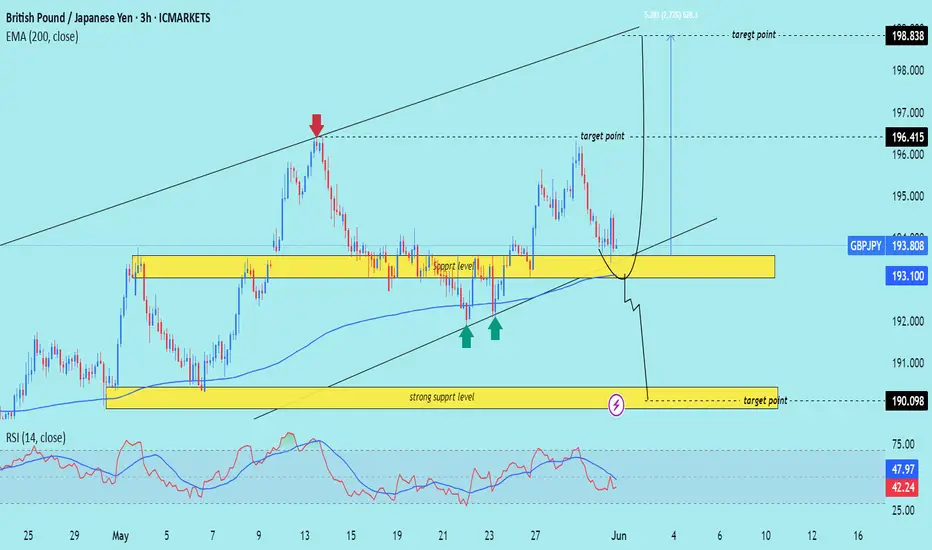
GBP)JPY) Technical analysis setup Read The ChaptianSMC trading point update
Technical analysis of GBP/JPY (British Pound / Japanese Yen) on the 3-hour timeframe using Smart Money Concepts (SMC) and structure-based patterns.
---
Market Overview
Current Price: 193.808
EMA 200: 193.100 (acting as dynamic support)
RSI (14): 42.24 → Neutral/Bearish territory
---
Two Possible Scenarios (Bullish & Bearish)
Bullish Scenario
Zone of Interest: 193.1–193.5 (support area)
Price is hovering just above the support level and 200 EMA.
Double green arrows mark previous rejections = demand zone.
If price respects support and forms a higher low:
Possible rally to:
First Target: 196.415
Second Target: 198.838
Bearish Scenario
If price breaks below the yellow support zone and 200 EMA:
Clean path down to:
Target Point: 190.098 (marked strong support zone)
---
Zones of Importance
Support Level: 193.0–193.5 (minor support, under retest)
Strong Support Level: ~190.1 (high probability bounce zone)
Target Resistances:
196.415 (intermediate high)
198.838 (major resistance / swing high)
---
Trade Plan Summary
Direction Entry Zone SL Target R/R Potential
Long 193.1–193.5 Below 193.0 196.4 / 198.8 1:2 to 1:3+
Short Below 193.0 Above 194.0 190.1 1:2+
Mr SMC Trading point
---
Additional Notes
Watch price action closely at the support zone before entry.
RSI shows some bearish momentum but not oversold yet.
The outcome may be influenced by JPY strength and macro events (check economic calendar).
pales support boost 🚀 analysis follow)
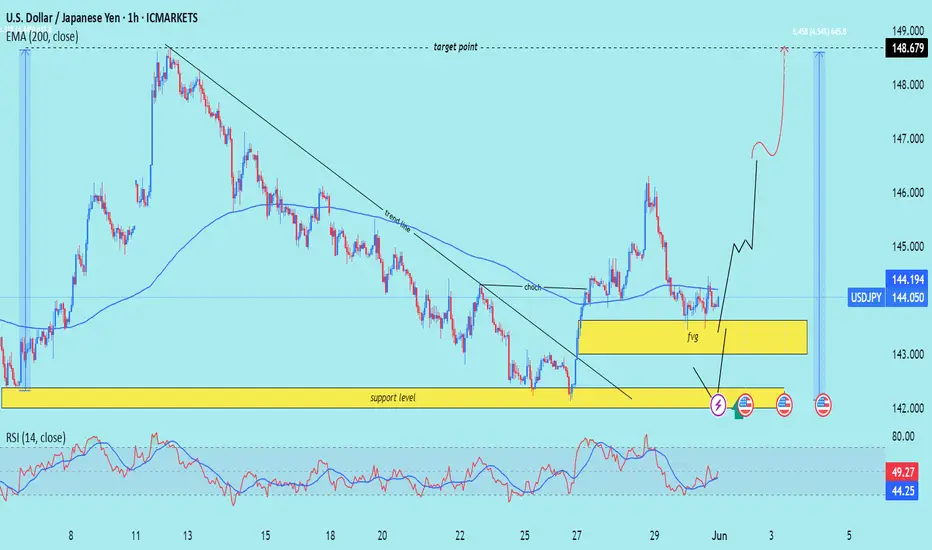
USD/JPY) bullish choch Analysis Read The ChaptianSMC trading point update
Technical analysis of USD/JPY presents a bullish outlook with Smart Money Concepts (SMC)-based logic. Here's a breakdown of the idea and key elements:
---
Chart Summary
Current Market Context
Price: ~144.05
EMA 200: Acting as dynamic resistance at 144.19
Trendline: Broken, signaling a potential shift in market structure
Change of Character (ChoCh): Confirmed around 143.3, marking a bullish transition
---
Key Zones Identified
1. Support Level (Strong Demand Zone)
Around 141.8–142.5
Marked by historical rejections
Possible mitigation of unfilled orders here
2. Fair Value Gap (FVG)
Between 143.0–143.8
Price may return to fill this imbalance before rising
---
Projected Move
Price is expected to:
1. Dip into the FVG or Support Zone to mitigate imbalance
2. Reverse and make a bullish rally
3. Reach the target point near 148.68 (approx. +4.55%)
---
RSI Analysis (14-period)
Current RSI: ~49 (neutral)
No overbought/oversold condition
Room for upside momentum
---
Notable Features
Break of structure (ChoCh) → Bullish signal
EMA crossover potential → Bullish confluence
Multiple FVG fills + support reaction → Entry confirmation opportunities
Economic events marked → Be cautious of volatility spikes
Mr SMC Trading point
---
Trading Idea Summary
Buy Entry Zone: 141.8–143.0 (support or FVG)
Stop Loss: Below 141.5
Target: 148.68
Risk/Reward: Favorable (approx. 1:3+)
Pales support boost 🚀 analysis follow)
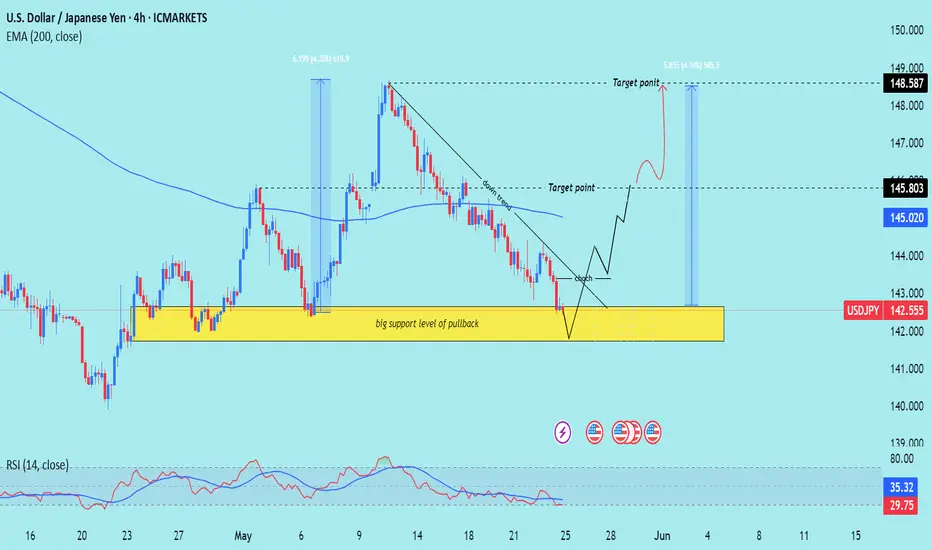
USD/JPY) Bullish reversal analysis Read The ChaptianMr SMC Trading point update
Technical analysis for the USD/JPY (U.S. Dollar / Japanese Yen) on the 4-hour timeframe. Here's a detailed breakdown of the idea and strategy:
---
Key Components of the Chart:
1. Strong Support Zone:
The yellow zone is labeled as a “big support level of pullback”, around the 142.00 – 141.20 range.
Price has historically bounced from this zone, suggesting demand and buyer interest.
2. Bullish Structure Setup:
Price is forming a double bottom or potential reversal pattern in the support zone.
A downtrend line is clearly marked, and a break above this trendline would signal bullish continuation.
3. EMA 200 (at 145.020):
The EMA is currently acting as dynamic resistance.
A breakout above the EMA would confirm further bullish momentum.
4. RSI Indicator:
RSI is currently below 30, indicating the market is oversold – a common precursor to a bullish reversal.
5. Target Levels:
Target 1: 145.803 – likely the first resistance level or EMA retest.
Target 2: 148.587 – a prior high and strong resistance area.
6. Projection:
Price is expected to bounce from support, break the trendline, retest, and then rally to higher levels.
---
Trade Idea Summary:
Bias: Bullish
Entry Zone: Near 142.00 – 141.20 (support zone)
Confirmation: Break above the descending trendline + bullish RSI divergence
Targets:
TP1: 145.803
TP2: 148.587
Invalidation: Break and close below 141.00 (support zone broken)
Mr SMC Trading point
---
Risk Management Suggestion:
Use a tight stop-loss below the support zone, considering it's the key reversal area. Also, keep an eye on fundamental factors such as U.S. and Japan interest rate decisions or key economic events (indicated by the icons on the chart).
Pales support boost 🚀 analysis follow)
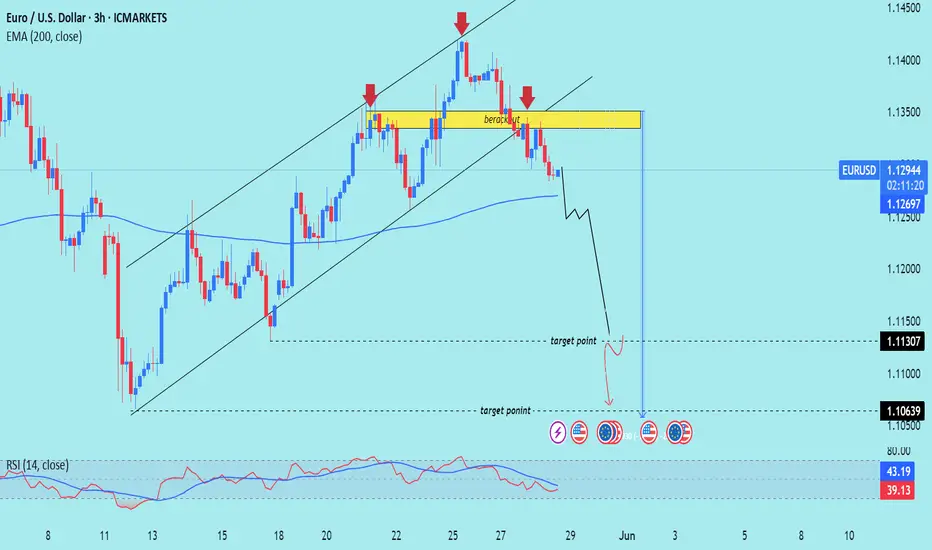
EUR/USD) breakout Analysis Read The ChaptianSMC trading point update
Technical analysis for EUR/USD (Euro/US Dollar) on a 3-hour timeframe presents a bearish outlook. Here's a breakdown of the key ideas and elements in the analysis:
---
1. Breakdown of Rising Channel
Ascending Channel: Price was moving upward within a clearly defined channel.
Breakout: The price broke below the ascending channel, indicating a potential trend reversal or correction.
---
2. Resistance Zone (Yellow Box)
Multiple Rejections: Red arrows mark points of rejection from the resistance area.
“Breakout” Label: Indicates this area was previously a support that turned into resistance after the price dropped below it.
---
3. EMA 200
The 200 EMA is plotted and the price is trading slightly above it, but very close.
A break and sustained movement below the 200 EMA would typically support a bearish trend continuation.
---
4. Bearish Projection
Downward Zigzag Path: Implies an expected short-term correction followed by further decline.
Target Points:
First target: 1.11307
Second, more extended target: 1.10639
---
5. RSI (Relative Strength Index)
Current Value: Around 38.84, which is near the oversold region (30).
Bearish Momentum: RSI is trending downwards, suggesting strengthening bearish momentum.
---
6. Fundamental Events
Multiple icons at the bottom (e.g., flags, calendar) indicate upcoming economic events/news which could influence volatility and confirm or invalidate the move.
Mr SMC Trading point
---
Conclusion:
This analysis suggests a bearish short- to medium-term outlook for EUR/USD, especially if price confirms a break below the 200 EMA. The resistance zone (around 1.133–1.135) is now seen as a supply zone, and the targets are around 1.113 and 1.106.
---
Suggestions/Considerations:
Watch the 200 EMA: A solid break below it would reinforce the bearish bias.
Monitor Fundamentals: U.S. and Eurozone economic news could heavily impact price action.
RSI Oversold Caution: If RSI dips further, a bounce might occur before full target completion.
Pales support boost 🚀 analysis follow)
XAU/USD) Bearish trand analysis Read The ChaptianSMC trading point update
Technical analysis for Gold (XAU/USD) on the 4-hour timeframe. Here's a breakdown of the key ideas and strategy behind it:
---
Key Elements of the Chart:
1. Descending Channel Pattern:
Price is moving within a descending channel (downward sloping resistance and support lines).
The red arrows mark previous rejections from the upper boundary of the channel.
2. Supply Zone / Resistance Area:
Highlighted in yellow, the price has entered a supply zone (between 3,412.00 and 3,440.42), historically where selling pressure has emerged.
The analysis suggests sellers may dominate again in this zone.
3. Price Action Projection:
Expected to reject from the supply zone, possibly forming a lower high.
Price is projected to break the short-term upward trendline, then fall sharply.
4. Target Points:
First target: 3,206.96 – likely aligned with a minor support level or Fibonacci retracement.
Second target: 3,085.56 – near the lower boundary of the descending channel.
5. EMA 200 (3,238.55):
Price is currently above the 200 EMA, but the projection anticipates a breakdown below it, confirming further bearish sentiment.
6. RSI Indicator:
RSI is at 67.56, near overbought territory, suggesting limited upside and a possible correction.
---
Trade Idea Summary:
Bias: Bearish
Entry Zone: Between 3,412 – 3,440 (supply zone)
Confirmation: Rejection at the trendline + RSI divergence
Targets:
TP1: 3,206.96
TP2: 3,085.56
Invalidation: Break and hold above 3,440.42 (channel breakout)
Mr SMC Trading point
---
Risk Management Note:
Ensure stop-loss is placed above the resistance zone (e.g., around 3,450) to mitigate false breakouts. Monitor fundamentals like upcoming US economic data, as they can heavily impact gold.
Pales support boost 🚀 analysis follow)

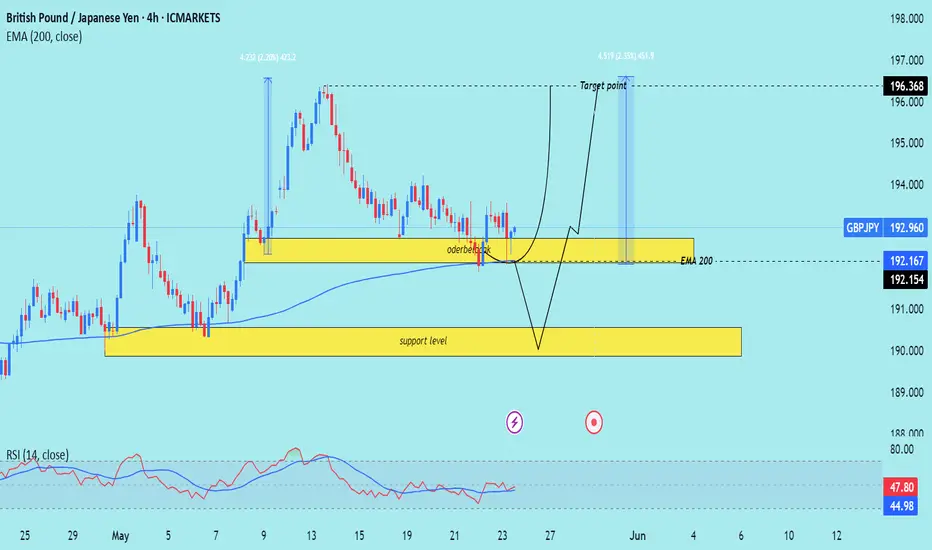
GBP/JPY) Bullish pullback analysis Read The ChaptianSMC trading point update
Tchnical analysis for GBP/JPY (British Pound / Japanese Yen) on the 4-hour timeframe. Here’s a breakdown of the trading idea and structure:
---
Key Technical Elements:
1. Support Zones:
Orderblock Zone (small yellow box near 192.15): Price is currently hovering around this area, which acts as a demand zone.
Main Support Level (larger yellow zone around 190.00): A deeper pullback may test this level if the orderblock fails.
2. EMA 200 (192.167):
Price is fluctuating around the 200 EMA, showing indecision.
A strong bounce above this moving average could indicate bullish momentum resuming.
3. RSI Indicator:
RSI is neutral (~47.80), leaving room for upside movement without being overbought.
4. Projected Price Path:
Two potential bullish scenarios:
A bounce from the orderblock leads straight to a rally.
A deeper dip into the support level forms a double bottom or liquidity grab, followed by a strong reversal.
5. Target Point:
The projection shows price rising to 196.368, which is a prior high and significant resistance.
---
Trade Idea Summary:
Bias: Bullish
Entry Zone:
Primary: Around 192.15 (orderblock)
Secondary (deeper entry): Around 190.00 (support level)
Confirmation: Bullish engulfing candle or strong wick rejection near entry + price reclaiming 200 EMA
Target: 196.368
Invalidation: Break and close below 189.80 (support zone violated)
Mr SMC Trading point
---
Risk Management & Notes:
Good R:R potential if entering near support with a stop below 189.80.
Watch for confirmation before entry — especially if price dips to the lower support.
Macroeconomic events (UK or Japan central bank decisions) could impact volatility.
Pales support boost 🚀 analysis follow)
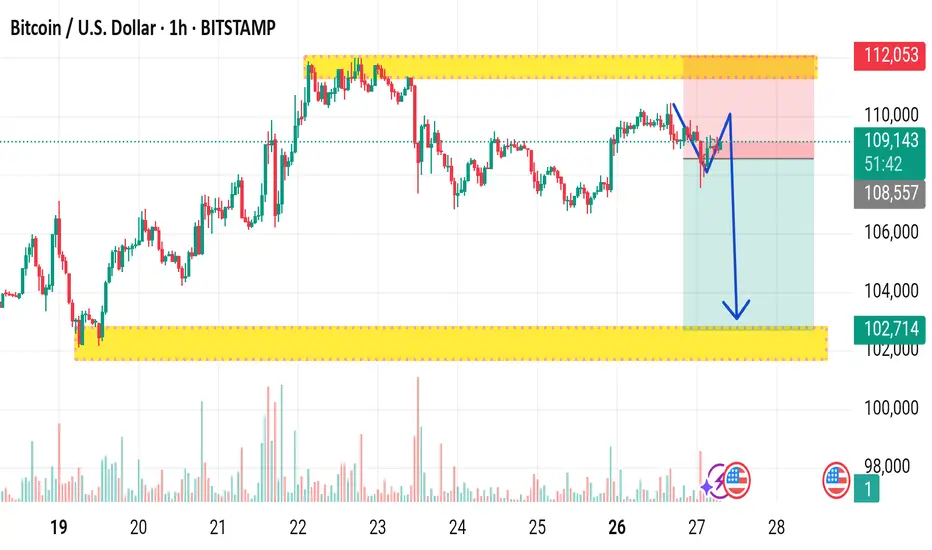
BTCUSD UPDATE : 27- 5 - 2025This chart shows a 1-hour time frame for Bitcoin (BTC/USD) on Bitstamp, with technical analysis indicating a potential bearish move. Here’s a breakdown of the chart:
Price Range: The chart highlights a trading range between approximately $102,714 (support) and $112,053 (resistance), marked with yellow zones.
Current Price: BTC is trading around $109,026.
Bearish Signal: A blue arrow points downward, suggesting an anticipated drop in price.
Pattern Suggestion: It looks like a potential double top or lower high is forming, signaling weakening bullish momentum.
Target Zone: The arrow points towards the support zone around $102,714, implying that the chartist expects BTC to fall to that level.
This type of analysis is often used for short-term trades and may involve setting stop-losses near $112,053 and profit targets near $102,714. Let me know if you'd like help interpreting this pattern further or backtesting the setup.
BTC/USD) Make some trand analysis Read The ChaptianSMC trading point update
Technical analysis of Bitcoin (BTC) against USDT on a 4-hour timeframe using key price action concepts. Here's a breakdown of the idea conveyed:
Key Elements in the Chart:
1. Support and Resistance Zones:
Support Level (Yellow Boxes): Indicate areas where buying interest is strong enough to prevent the price from falling further.
Resistance Level: Zones where selling interest is strong enough to halt upward price movement.
These zones have been respected multiple times and serve as potential trade entry or exit points.
2. Breakout Strategy:
The chart highlights breakout points (black circles) above resistance zones, signaling strong bullish momentum.
After breaking resistance, price typically retests the zone as new support before moving higher—this is a classic breakout and retest structure.
3. Target Projection:
The vertical lines represent measured move projections, likely using the height of the prior consolidation range to estimate the next move.
The target point is marked around $112,559.59, indicating a bullish target following the breakout.
4. 200 EMA (Exponential Moving Average):
The 200 EMA at $96,827.38 acts as dynamic support, showing the overall bullish trend is intact.
5. RSI (Relative Strength Index):
RSI values (54.97 and 52.87) suggest neither overbought nor oversold conditions, implying room for further upside.
Mr SMC Trading point
---
Conclusion:
The analysis suggests a bullish continuation setup:
BTC has broken out from a consolidation range.
Retesting previous resistance as support.
The bullish target is $112,559.59 based on the breakout projection.
The trend remains bullish as long as price stays above the support zone and 200 EMA.
Pales support boost 🚀 analysis follow)

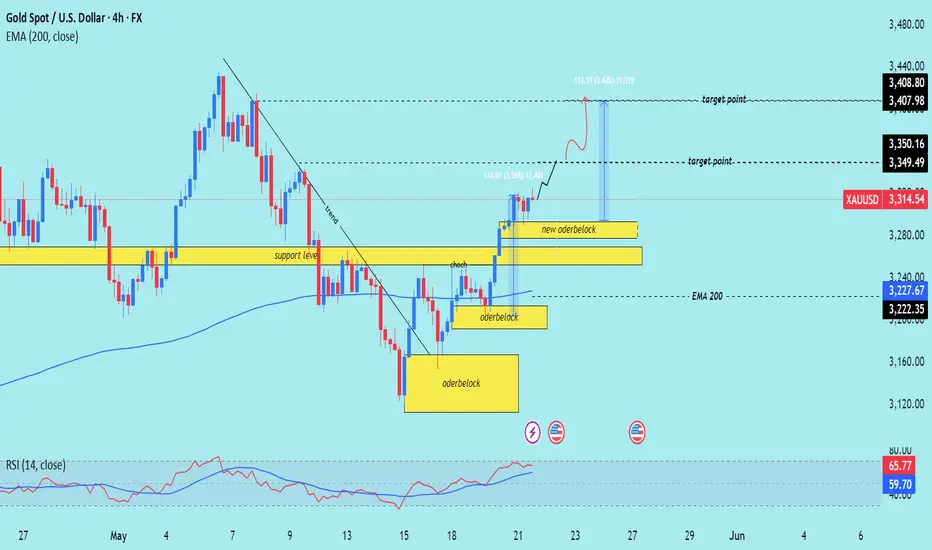
XAU/USD) Bullish reversal analysis Read The ChaptianSMC trading point update
Tchnical analysis for XAU/USD (Gold vs US Dollar) on the 4-hour timeframe, using Smart Money Concepts (SMC). Here's a breakdown of the idea behind this analysis:
---
1. Trend & Structure
The previous downtrend was broken with a change of character (ChoCH), suggesting a possible bullish reversal.
After the ChoCH, the market formed bullish order blocks which have been respected, confirming the bullish sentiment.
---
2. Key Levels
Support level: Around 3,220–3,240 region, coinciding with the 200 EMA, which has acted as dynamic support.
Order blocks: Several yellow zones indicate areas of institutional buying interest.
The most recent "new order block" is closer to the current price, showing a potential short-term demand zone.
---
3. Price Projection
The chart suggests a bullish continuation, projecting a move towards:
Target Point 1: Around 3,350–3,349.50
Target Point 2: Around 3,408–3,407.98
These levels are likely based on prior highs or imbalance zones.
---
4. RSI Indicator
RSI is above 65, showing bullish momentum, but nearing overbought territory (>70), which could signal a short-term pullback before continuation.
---
5. Trade Idea (Visualized Path)
A potential small pullback into the "new order block" around 3,280 is expected.
From there, price may rally to the next supply zones or previous highs, offering a potential gain of ~1.44%.
Mr SMC Trading point
---
Summary of the Idea
This is a bullish continuation setup based on:
Trend reversal via ChoCH.
Strong order block formations.
EMA 200 support.
RSI confirmation.
Traders might look to enter near the new order block (around 3,280), targeting 3,350 and then 3,408, while managing risk below the order block support.
Pleas support boost 🚀 analysis follow K
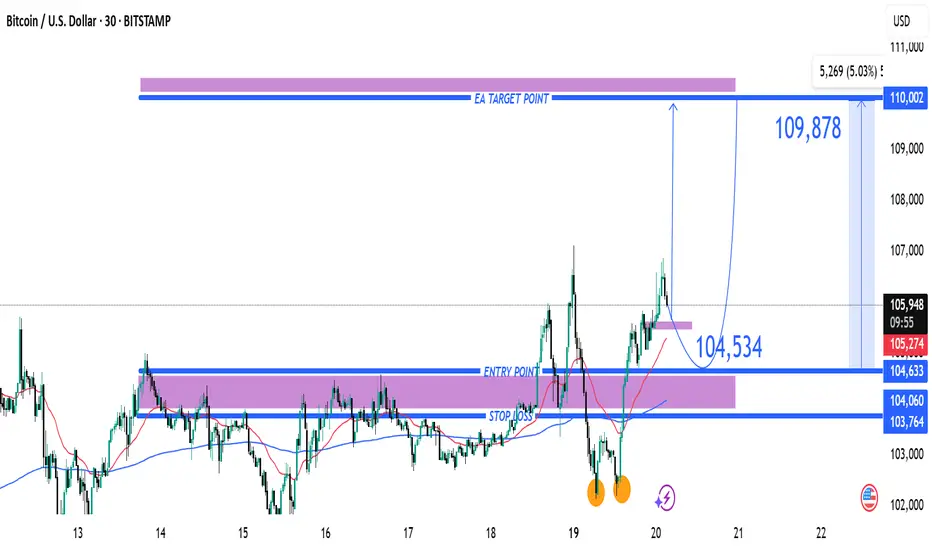
BTC/USD Bullish Setup: Double Bottom Breakout Targeting $110,000 Trade Setup Analysis
1. Support & Resistance Zones
Support Zone (Buy Zone):
Highlighted in purple, between $103,764 and $104,633, with a noted stop loss area near $104,061.
Resistance/Target Zone (Take Profit Area):
Around $109,878 – $110,002 labeled as “EA TARGET POINT”.
2. Double Bottom Pattern (Bullish Signal)
There are two orange circles at the bottom, indicating a double bottom pattern—often a bullish reversal signal.
This is supported by a neckline break near the entry point at $104,534.
3. Moving Averages
Two moving averages are displayed:
Likely a short-term MA (red) and a medium/long-term MA (blue).
The price crossing above both suggests bullish momentum.
4. Trade Plan
Entry Point: Around $104,534
Stop Loss: Below $104,061
Take Profit (Target): $109,878 – $110,002
Risk/Reward Ratio: High, given the tight stop and wide target.
📈 Price Projection
The blue arrowed path suggests:
A minor dip or consolidation near $104,534, followed by a strong upward move toward the target zone.
The movement outlines a classic cup-and-handle or double-bottom breakout pattern.
🧠 Conclusion
This is a bullish trading setup for BTC/USD with a favorable risk-reward ratio. The chart suggests:
Buying near $104,534
Stop loss just below support
Targeting a move to ~$110,000
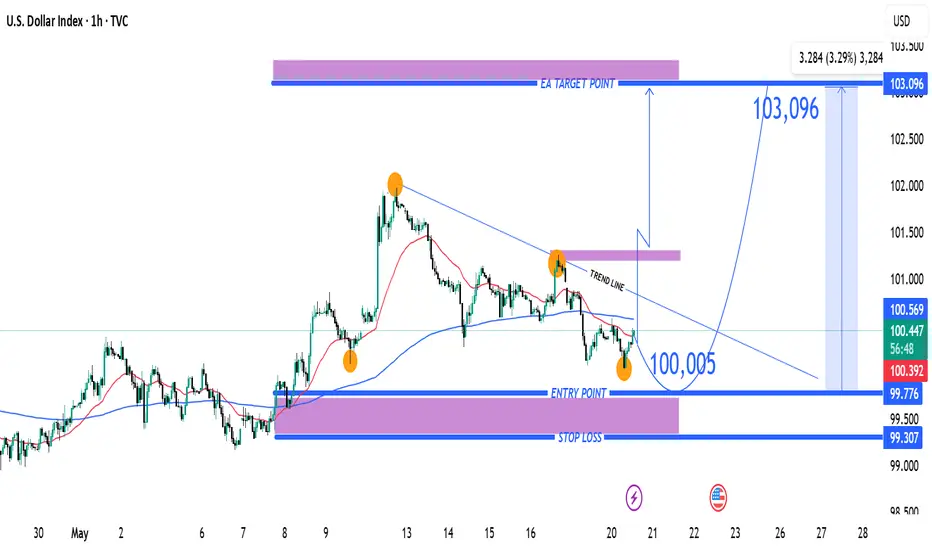
U.S. Dollar Index (DXY) Bullish Reversal Setup – 1H Chart Analy ENTRY POINT: 100.005
→ This is the area where the trade is suggested to enter long (buy).
🟥 STOP LOSS: Around 99.307
→ Placed below strong support to manage risk.
🟦 SUPPORT ZONE: 99.776 - 99.307
→ Strong historical demand zone, price has bounced from here before.
🟪 BREAKOUT ZONE: Near 100.5
→ If price breaks the trendline here, it may trigger bullish momentum.
🎯 TARGET POINT: 103.096
→ This is the take profit zone (blue box) with a potential gain of +3.29%.
📊 Trade Setup Summary:
✅ Buy Setup: Price approaching support zone, forming a potential reversal.
⚠️ Watch for breakout: Above the trendline to confirm bullish move.
✨ Great Risk-to-Reward: Small risk (tight stop), big reward.