Fossil Group (NASDAQ: FOSL) Forming a Descending Wedge Pattern FOSL has been in a downtrend since June 2021, when it reached a 52-week high of $6.08. The stock has formed a descending wedge pattern, which is a bullish reversal pattern that indicates a possible breakout to the upside.
The stock has recently crossed above the resistance line of the wedge, which is a positive sign of a trend change. The stock has also formed a golden cross, which is another bullish signal that occurs when the 50-day moving average crosses above the 200-day moving average. The stock is now trading above both the moving averages, which are acting as support levels.
Fossilgroup

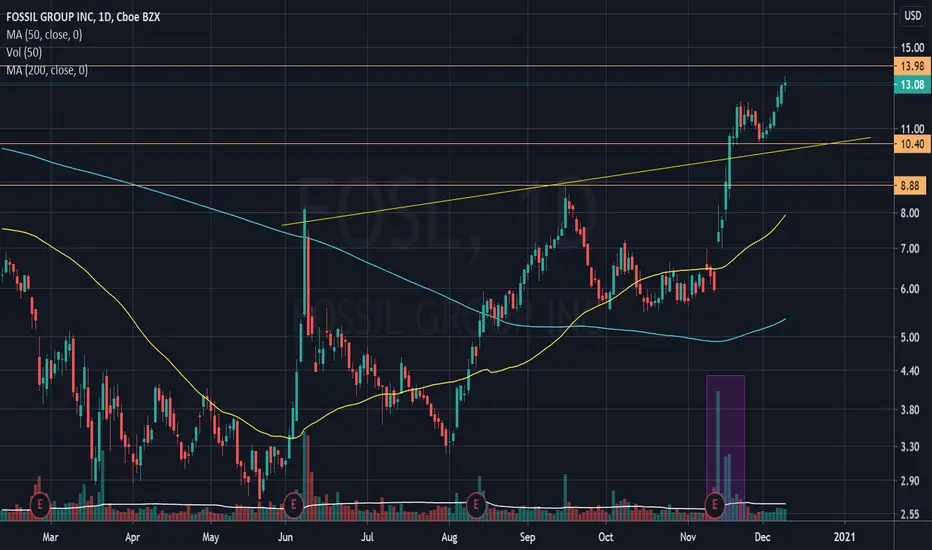
US Stock In Play: $FOSL (Fossil Group Inc)With $SPY erasing all the weeks’ gains during last night pullback, $FOSL remains resilient to the general market weakness, outperforming with a +9.38% cumulative gain for the week.
$FOSL is currently treading with its previous high volume upper trendline resistance (broken out) as its immediate support zone, confluence with a classical support level at $10.40.
The immediate price test for further upwards momentum for $FOSL is at $14.00, a classical resistance established in September 2019; some 14 months ago.