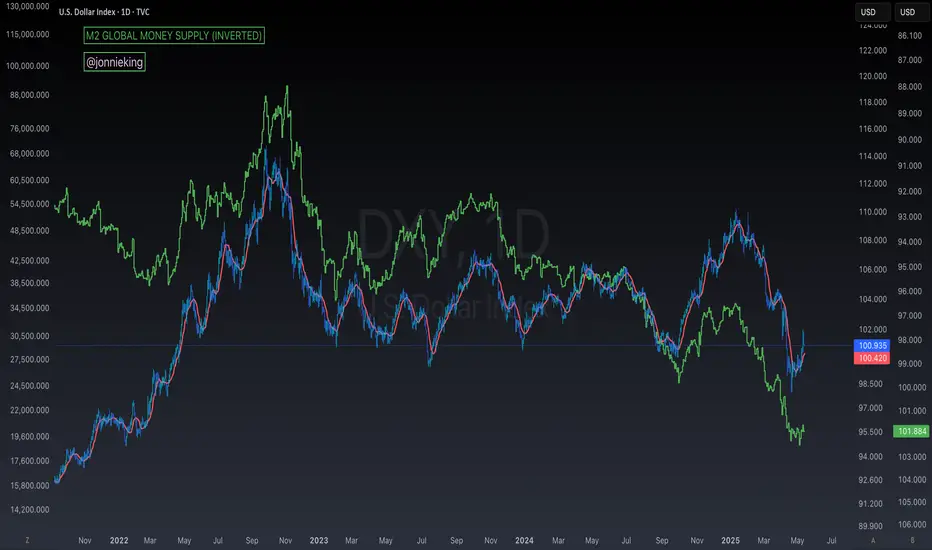
$DXY Up, M2 Money Supply DownWhen the DXY goes UP,
M2 Money Supply goes DOWN.
Remember the 12-Week Lead correlation with CRYPTOCAP:BTC
Fractal
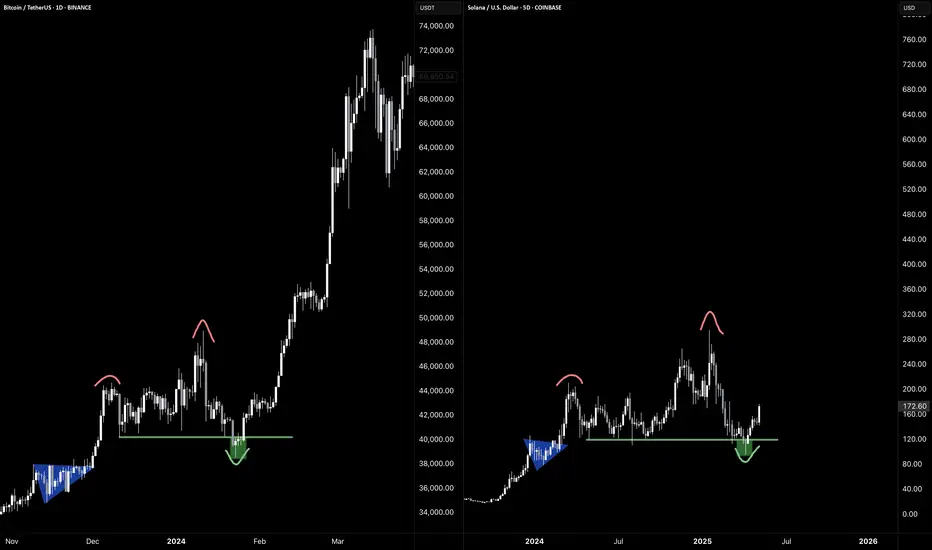
Potential Fractal Pattern Just like last year double top and then a breakout very similar pattern here. Something to keep in mind.

Solana 1-Day Chart – Are We on the Brink of a $1,000 MOONSHOT?!Solana is absolutely on fire! On this 1-day chart, we’re witnessing a massive rising channel that’s been building since 2023. After a solid rebound from the $93 support, Solana has smashed through a fractal resistance line (check that arched arrow from mid-2023 to early 2024 top) . Now, it’s breaking out at a parallel resistance, hanging around $174 — and this could be the setup for a MASSIVE move upward!
I’m calling a potential target of $1,000 if SOLUSDT can muscle through the big resistances ahead: $200, the ATH at $270, and everything beyond. This breakout screams opportunity — Solana might just catch another wave of demand and go parabolic! The $93 support (marked "Back to Nothing Below This Line") looks rock-solid, giving us a strong foundation for this rally.
Key Levels to Watch:
Support: $93 (channel base)
Current Price: $174 (breakout zone)
Resistances: $200, $270 (ATH)
Target: $1,000 (if momentum holds)
Are you ready for this? I’m buzzing — I can’t believe this might actually happen!
Let’s hear your thoughts, traders! Are we heading to $1,000, or will resistance hold us back?

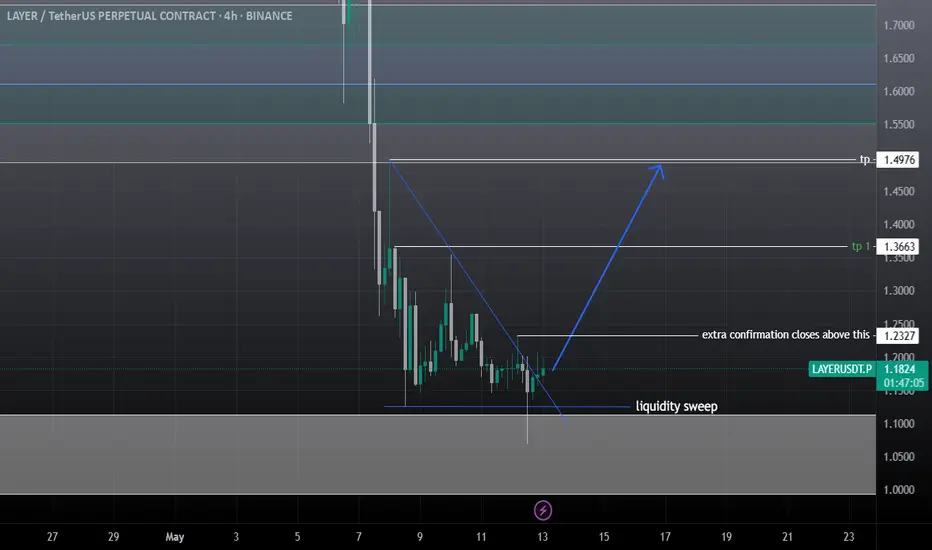
Layer, SOl Layer swing tradeAs 1 day & 4hrs candle failed to close below the previous one, it's following the liquidation sweep model, expectations are high that it will hit daily fvg at least 1.49$ manage your risk, the gray box is 1 day Bullish order Block, If btc hold the ground it will pump more.
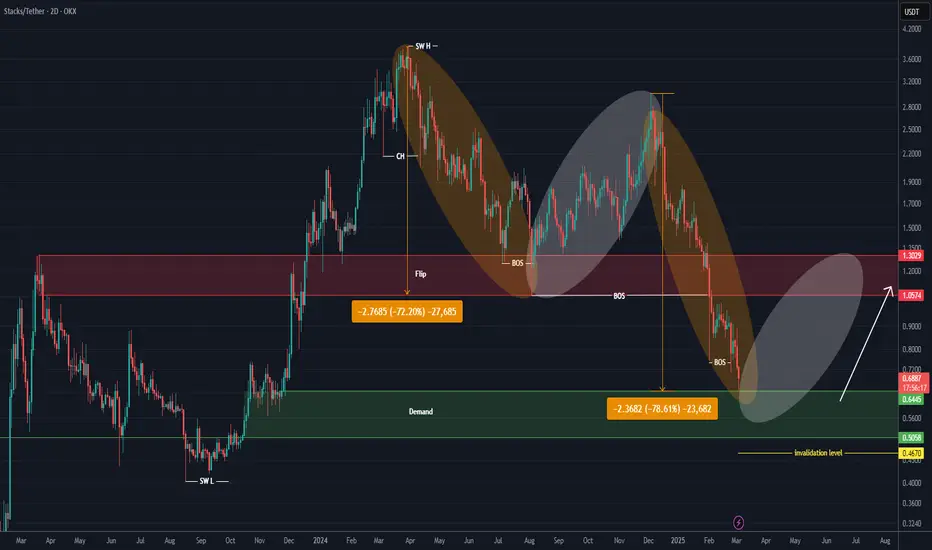
STX ANALYSIS (2D)The STX pair has reached a demand zone.
A price movement fractal seems to be repeating (highlighted by the orange and white boxes).
In the orange boxes, every time STX has dropped more than 72%, it has made a rebound move to the upside.
We are looking for buy/long positions around the demand zone.
The targets for STX are $0.93 - $1.10 - $1.30.
A daily candle close below the invalidation level will invalidate this analysis.
For risk management, please don't forget stop loss and capital management
When we reach the first target, save some profit and then change the stop to entry
Comment if you have any questions
Thank You
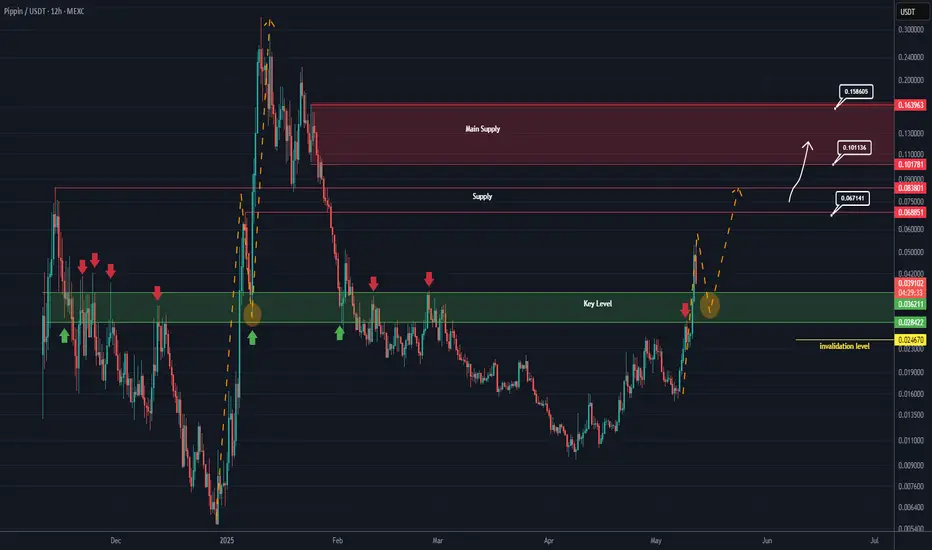
PIPPIN New Update (12H)It seems that a flip zone | or a key area | has been reclaimed here.
Previously, every time price touched this zone, it was rejected. But this time, the price has reclaimed it sharply and is now retesting the area.
Pay attention to the yellow arrows and circles.
Opening a sell/short position at this level might not be a good idea.
As long as the green zone is held, the price can move toward the marked supply levels.
If it drops below the green zone and a daily candle closes below the invalidation level, the bullish outlook on Pippin would still not be invalidated.
For risk management, please don't forget stop loss and capital management
When we reach the first target, save some profit and then change the stop to entry
Comment if you have any questions
Thank You
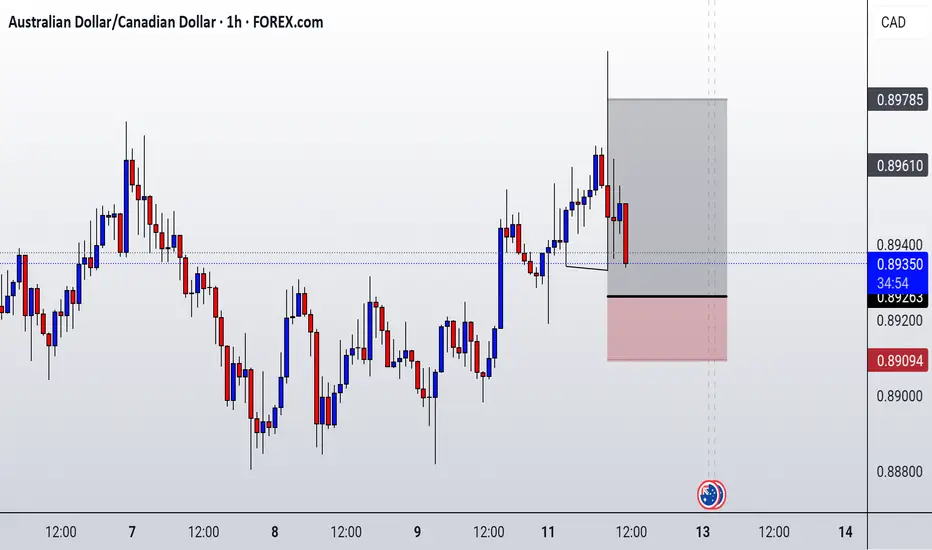
AUDCAD ENTRY CHART On this pair, we are still BULLISH IN TREND, even though we had a strong push on the CANADIAN DOLLAR , during the open of LONDON SESSION,here we have this pair still in an UPTREND, our Entry is based on the ZONE created,plus IND, with other of our Confluences, if price comes to tag us, we will be IN, and we move BE after +1r, if this setup matches with your idea and approach you can add to your watchlist, WE WILL GIVE UPDATE in the comment sections.
DXY MMBM confirmed - Bullish ThesisDXY exited the first stage distribution confirming we are bullish and in a marked maker buy model.
I expect CPI to retrace price and resume the bullish weekly trend afterwards.
SPX500 SLOWS DOWN AT BEARISH ORDER BLOCK!With SPX500 index slowing down at the bearish order block, the next trading week most likely will be bearish...
N.B!
- SPX500 price might not follow the drawn lines . Actual price movements may likely differ from the forecast.
- Let emotions and sentiments work for you
- ALWAYS Use Proper Risk Management In Your Trades
#spx
#spx500
#es

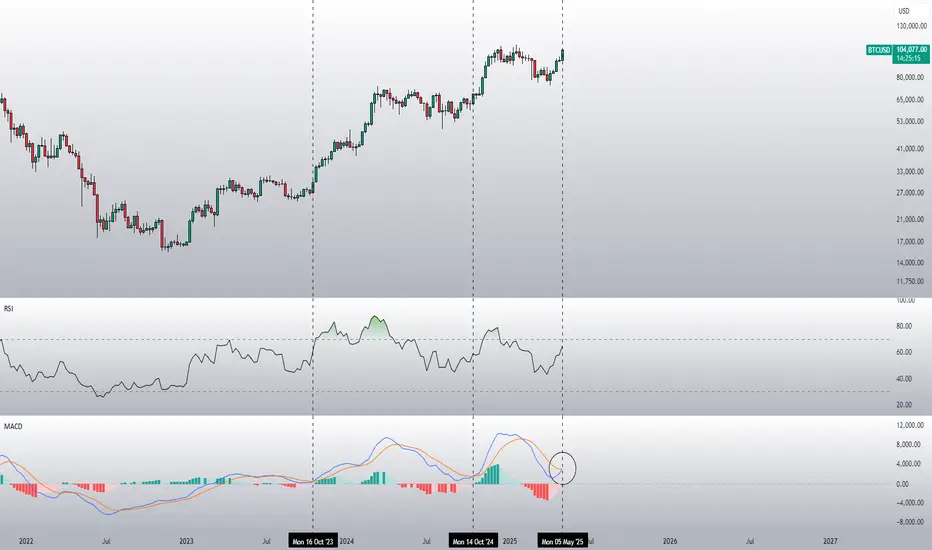
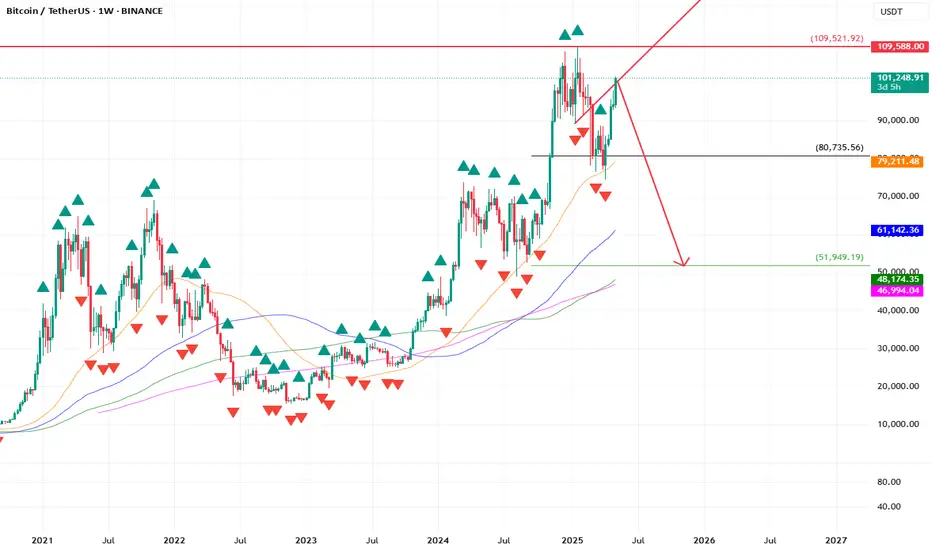
Bullish mode for BTCThe weekly MACD is about to make a bullish cross. The last two times this has happened, we've seen a nice run up for a couple of weeks to months.
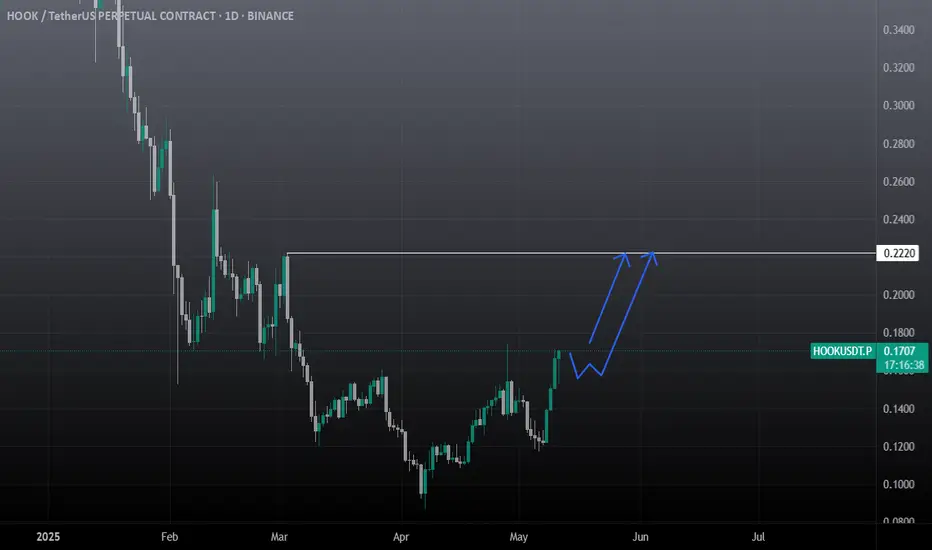
Hook USDT SWING and Scalp TradeFor spot, try to accumulate hook from here 0.1680 and 0.12, scalp trade tp 0.19 Swing TP 0.22$. If you are taking it in future then book some on 0.19 and rest on 0.22$.
Btc Future Scalp setupEnter at cmp 104200 2nd entry 103k, Sl 1hr closes below 102920 on binance future chart. Tp 106k this is a touch n go zone so put limit 105.8k. until unless we don't closes below 102920 at least 2hrs candle chances are high for new ath.

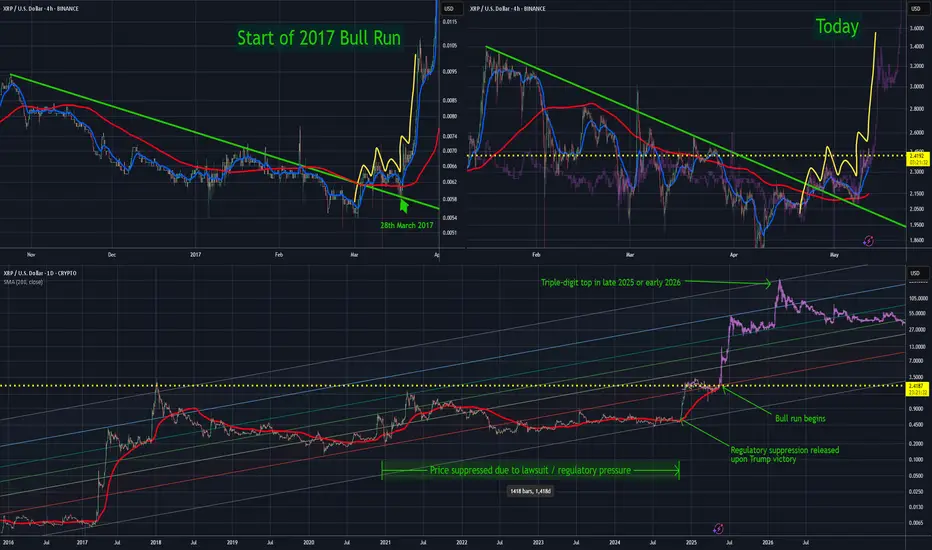
Thesis — How XRP Could Reach Triple Digits Within 12 MonthsAbout a month ago, I pointed out a pattern that preceded XRP’s explosive bull run in 2017. That same pattern is now playing out almost identically — and if the fractal continues to hold, XRP could be gearing up for another major move.
Frankly, the 4-hour chart is a near-mirror image of 2017’s setup. I’ve overlaid the original bar pattern onto today’s price action — the resemblance is hard to ignore.
If this plays out:
We could see a test of all-time highs within a week
Double-digit XRP by mid-year
Triple-digit XRP by late 2025 or early 2026
No guarantees, of course — but the structure is clear, and the setup is there.
For context, I view the November rally as XRP simply reverting to where it would have been had regulatory pressure not artificially suppressed the price. That move wasn’t the bull run — it was a reset.
Importantly, alt season still hasn’t kicked off (just look at BTC dominance), and XRP’s fundamentals are stronger than ever:
Lawsuit behind us
ETFs likely coming
Ongoing partnerships
Pro-crypto regulatory tone globally
Technically and fundamentally, XRP has never looked better.
Big, but biggerIn fact, I think it's possible that BTC will leave a CME gap (yellow box) unfilled for the first time since October 2020, and that we're repeating the marked 2020 fractal in a much bigger way.

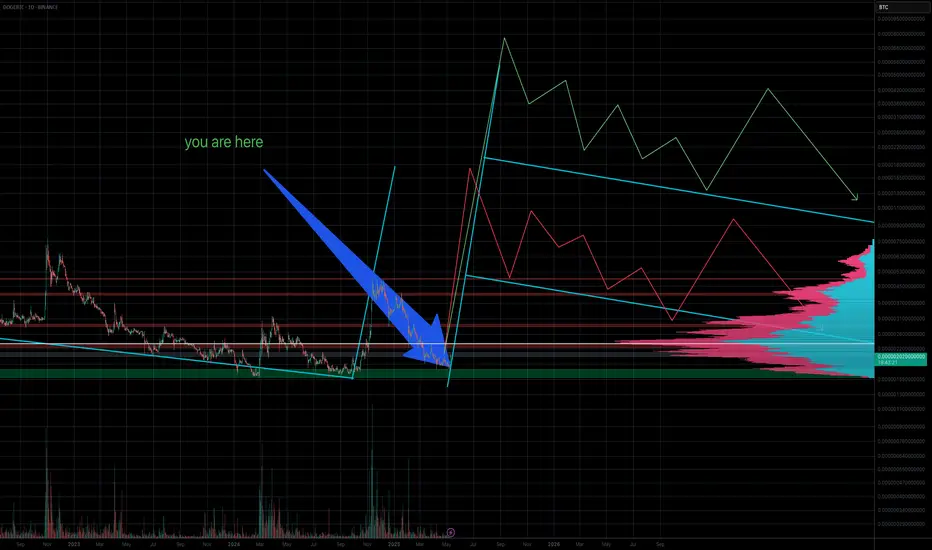
Is It "GO" Time for $DOGE Dominance to Flippen BTC?Been talking about this for a while.
Early, but not wrong.
Remember: nothing ever moves in a straight line except c0caine- and even then, only if you're a degenerate.
But enough about my theory- this market is breaking a lot of old "ObViOuS" patterns, because they never repeat perfectly.
What do YOU think is going on here?
Is it actually GO time?
$SOL - Long FractalCRYPTOCAP:SOL Fractal compared with CRYPTOCAP:BTC from 2024.
Do not fade Solana.
My top pick this cycle.
-@CryptoCurb
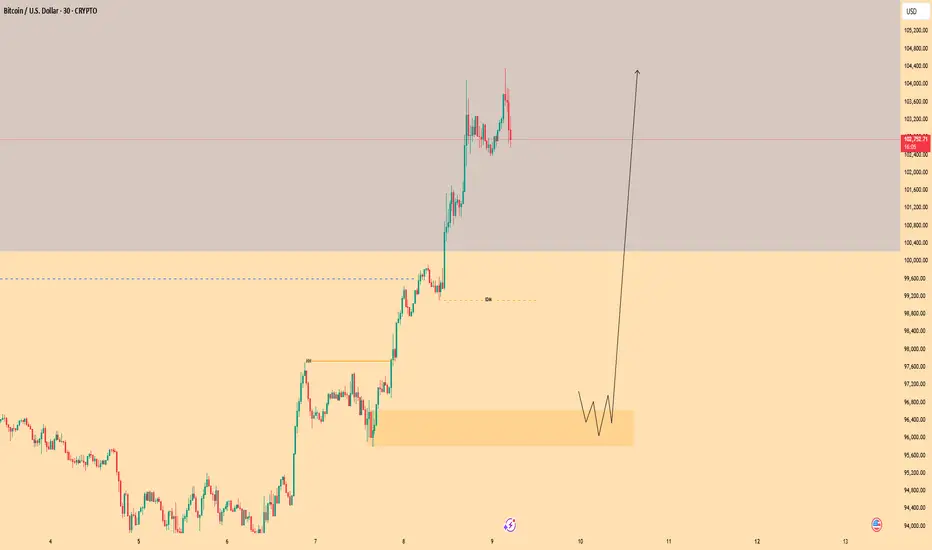
BTCUSD - Patience Over PredictionMain 4H still bearish. sitting in that supply zone heavy.
But 30M still holding bullish structure.... so im chillin'.
Not forcing a thing - I'll intend to sell once the 30M shows me the shift.
Until then? patience is my entry.
-#BTCUSD #SMCTrader #Supplyzone
#StructureFirst #CHoCHPending #LetitDevelop
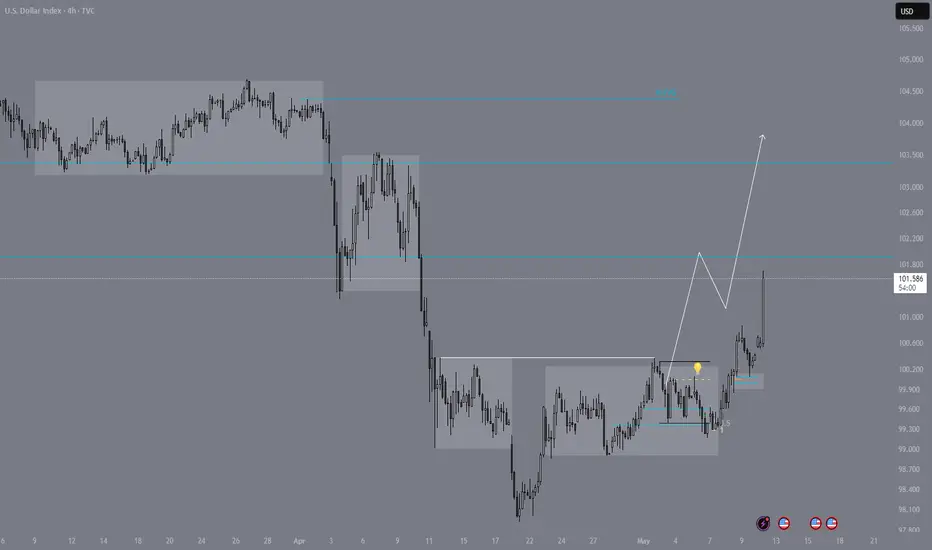
Dxy bullish idea for next week - MMBMThis is a bullish possibility for DXY price action for next week.
Monthly:
- Price took a swing low confluent with a bearish breaker in discount and closed above the level;
Weekly:
- Price Took a swing below monthly swing with a bullish reaction. If this week closes with above previous weeks high, it confirms a bullish weekly swing;
Daily:
- Monday printed the likelly low of the week
- A daily fair value gap is open allow with a volume imballance around monday open signalling bullish price action - a retrace to these levels would be a good buying opportunity.
4h:
- there is a market maker buy model in play.
- as of now, price already printed an intermidiate term low signalling that low risk buy myght have happened.
News forecast:
- I expect NFP to either retrace price to daily fvg or daily volume imbalance and leave a bullish reaction.
- FOMC next week might bring the volatility to complete the mmbm
Thank you for reading

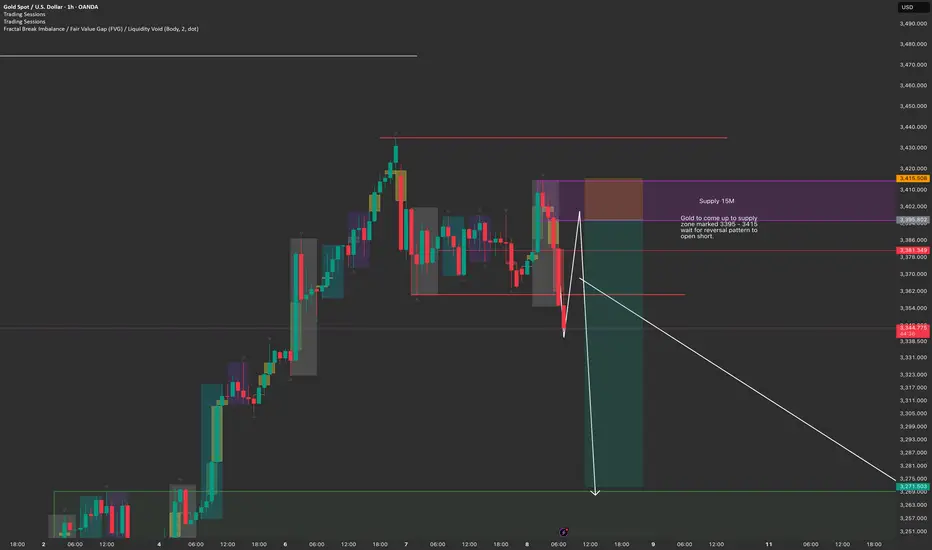
Gold Short ideaGold in a range but has created a liquidity grab to the upside after yesterdays range.
It has now broken this range to the downside after the liquidity grab. Potential idea for price to retest the supply zone marked up on the chart.
sell from this zone aiming for a target at 3269.00
Entry : 3395.802
SL : 3415.50
TP : 3271.50
Will only take short once price swings back up.
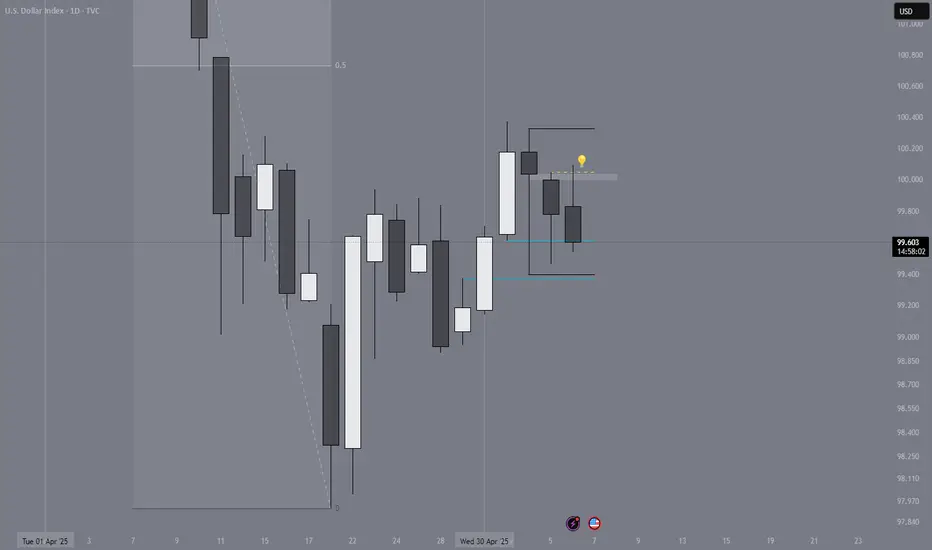
DXY Bullish scenario (Daily)Dxy is still respecting the market maker buy model idea.
Monday traded inside friday range.
Today (Tuesday) price already traded above monday previous high signaling bullish momentum and a higher probability to trade also above friday high.
Right now price is consolidating between a daily bullish fair value gap and a bearish daily volume imbalance.
With the information we have, price is likelly to shop arround with no clear direction before FOMC.
For the current week price is still in the manipulation phase.
Traders will find higher probability trades after FOMC.
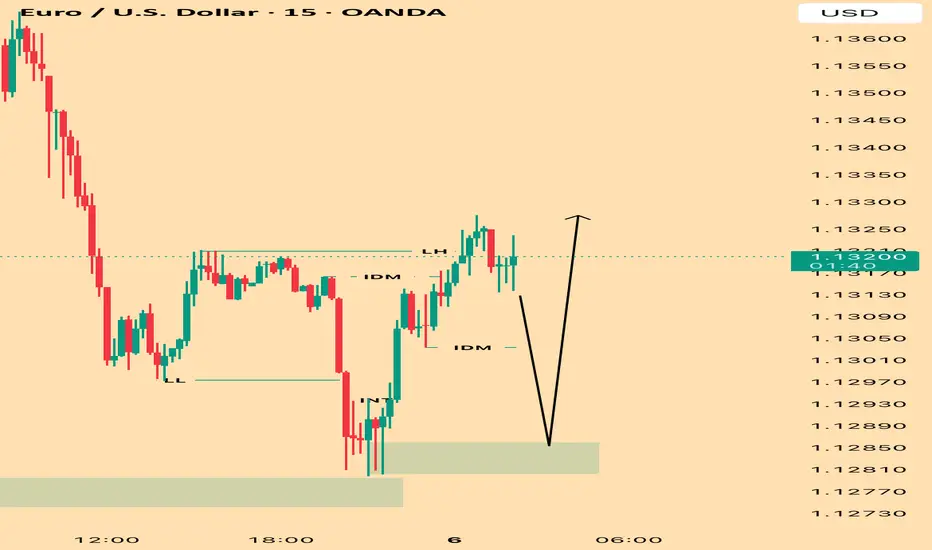
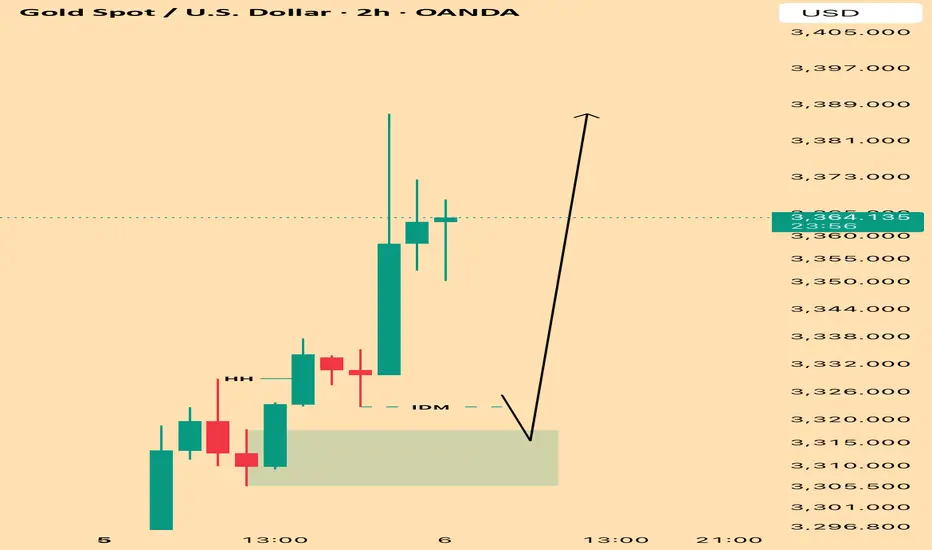
XAUUSD – Calm Before the LaunchMarked this IDM sitting under the HH with clean structure flowing bullish on 4H and 30M.
Flipped to the 2H for a smooth Bird’s Eye view—just watching now, waiting for that sweep and micro shift to load up.
The market’s breathing, building up energy. Once it taps in and confirms, it’s game time.
Let the liquidity do the work. I’ll handle the entry.
Bless Trading!
EU – Sniper Precision Off the 5M OBMarked my 5M order block off the last sell candle before the internal break of structure. Price showed bullish reaction early, but I didn’t flinch—no need to chase or expand the zone.
Skipped the 10M OB, stayed patient, and let price build the narrative:
• CHoCH forming
• Liquidity sweep in motion
• IDM cooking
Now I’m posted, waiting for price to tap into my 5M OB and flip with a micro LH for the entry.
No guessing. No rushing. Just letting the market come to me.
Bless Trading!