Fractal
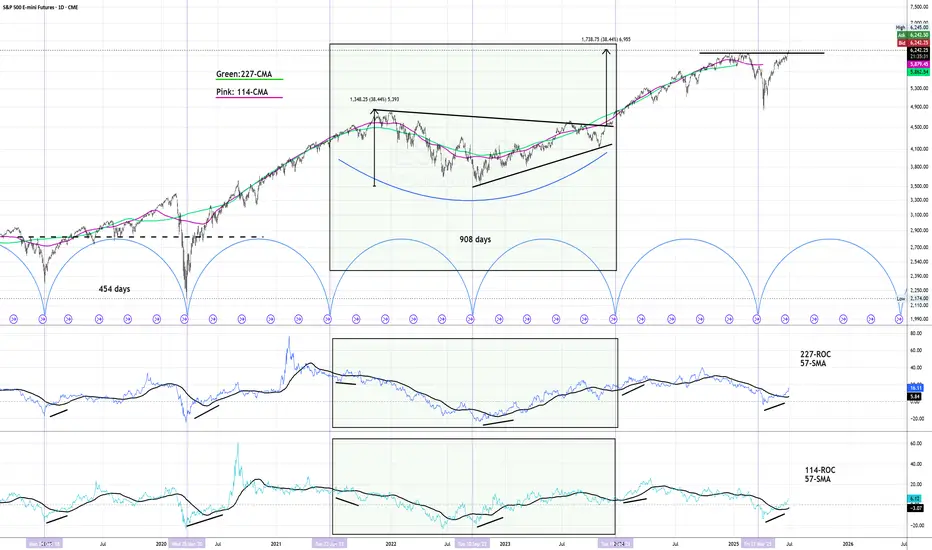
SP500 - Cycle Analysis; New V-Bottom24 Dec 2018 - V-Bottom Trough:
This marks a clean V-bottom. Both the 227-ROC and 114-ROC showed simultaneous positive acceleration after price reacing its low. Shortly after, both crossed their 57-SMA almost in sync — increasing the probability of a sustained bullish move. Price confirmed this by breaking resistance and forming a V pattern. This was further validated by the centered moving average crossover (114-CMA crossing above 227-CMA).
25 Mar 2020 - Deep COVID Crash Trough:
During this phase the priced broke below the support, creating a deep trough. Altough both ROC lines initially showed strong negative acceleration due to the COVID-19 crash, they soon reversed above their 57-SMAs, signaling a major shift in momentum. This coincided with the price breaking above the key resistance which was also crossed in 2019 when confirming the old V-pattern. After this breakout, a brief pullback followed before the uptrend resumed with increasing strength.
22 Jun 2021 to 19 Dec 2023 - Pattern
During the initial period a bearish divergence was visible in the ROC, nevertheless price and rate of change both declined making a low in early October 2022. A technical pattern began to form, which appears to align more closely with a symmetrical triangle; So when measuring its height and projecting it from the breakout point aligns with the new all-time highs that were reached on 27 June 2025.
21 Mar 2025 - New Cycle Trough
A new V-bottom formed shortly after the current cycle began. Both ROC indicators had already crossed their SMAs to the upside, showing early signs of positive acceleration, days before of price broke through the resistance and reached the new record high.
The 227-SMA is likely to cross from below the fast SMA while a possibility of a pullback increase.
Following that, the 114-CMA will probably has the chance to cross back the 227-CMA, with the price potentially confirming a new support level and resuming its uptrend - in line with the broader cycle timeline.
FLOKI on Fire! Bullish Summer for FLOKIUSDTDuring the two-month period from July to August, it's unclear what the specific catalyst might be, but Floki appears poised for a price surge between 75% to 133%. The June low at 0.00005923 seems to mark a solid bottom, and from here, I anticipate a bullish trend in Floki’s price.

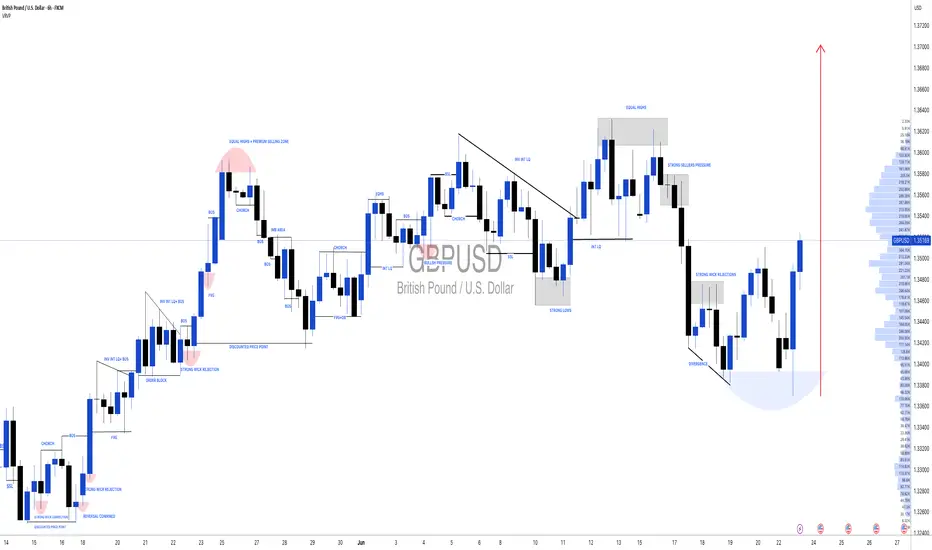
#GBPUSD: Bulls are in control, DXY Dropping Sharply!Hello Team,
We have identified a promising opportunity with a favourable price movement. The Pound Sterling to US Dollar (GBPUSD) pair has exhibited strong bullish volume, indicating potential further appreciation.
The current geopolitical tensions, particularly the involvement of the United States in the Iran-Israel conflict, are expected to negatively impact the US Dollar. This decline could potentially lead to an appreciation of the GBPUSD pair and other USD-denominated currencies.
It is advisable to closely monitor the price behaviour of the GBPUSD pair and consider potential investment opportunities based on its current trend.
Best regards,
Team Setupsfx
Market Re-Cap and Outlook for NEXT WEEKHere I am giving you a little insight as to what trades I am currently in, taken & looking to take for the week just gone and the week coming.
1 Winning trade on EU
1 Current open position on EU
EURGPB - Breakdown
AUDUSD - Breakdown
NZDUSD - Breakdown
Gold - Breakdown
If there are any pairs you would like me to share my feedback on give me a message and I will be happy to try and do so.
Thanks
Happy Hunting

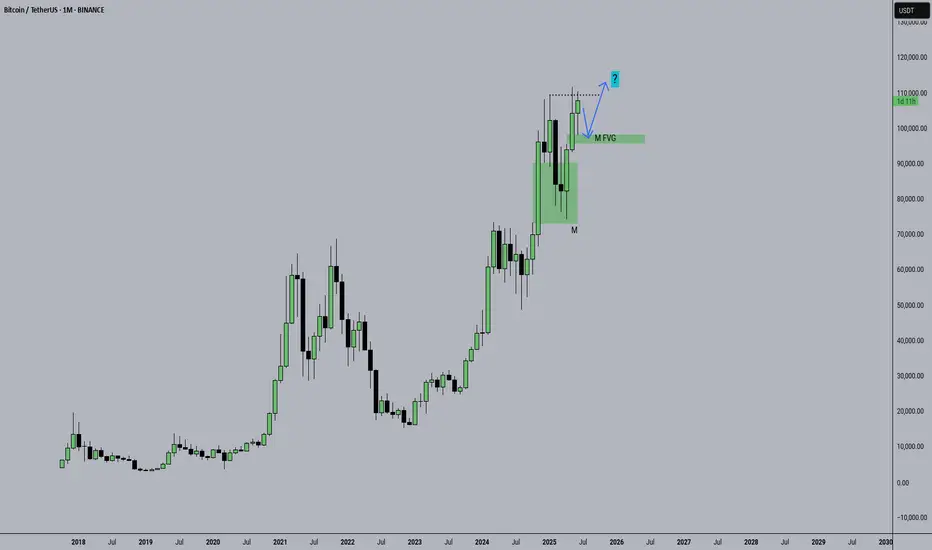
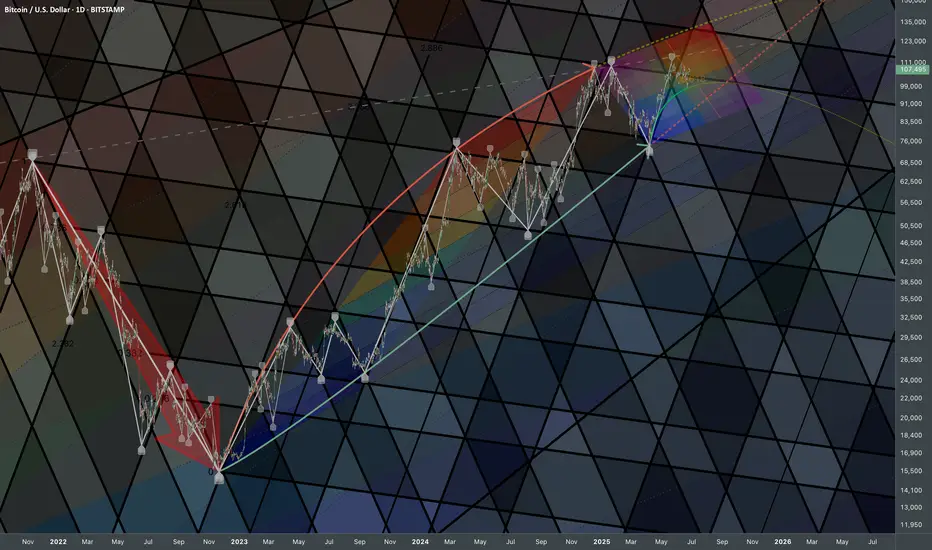
Bitcoin: Curve AdjustmentsBottoms can be expressed as a curve which matches logarithmic growth patterns. In the long-term perspective it serves as signal of trend's transition phase in broader scale. Coordinate of top adjusted accordingly.
Extending them is crucial because together they gives boundaries of range compression. Some sort of wave limits which help to clarify price-based levels.
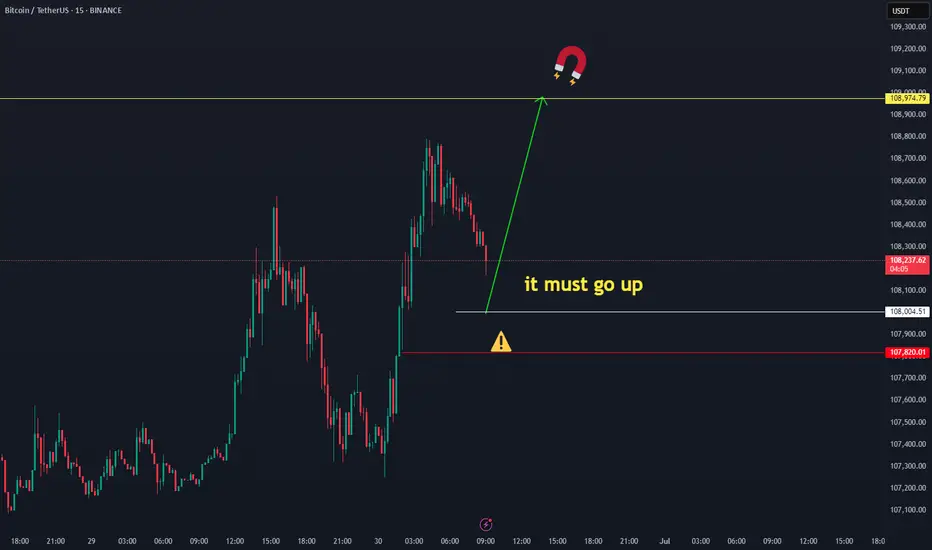
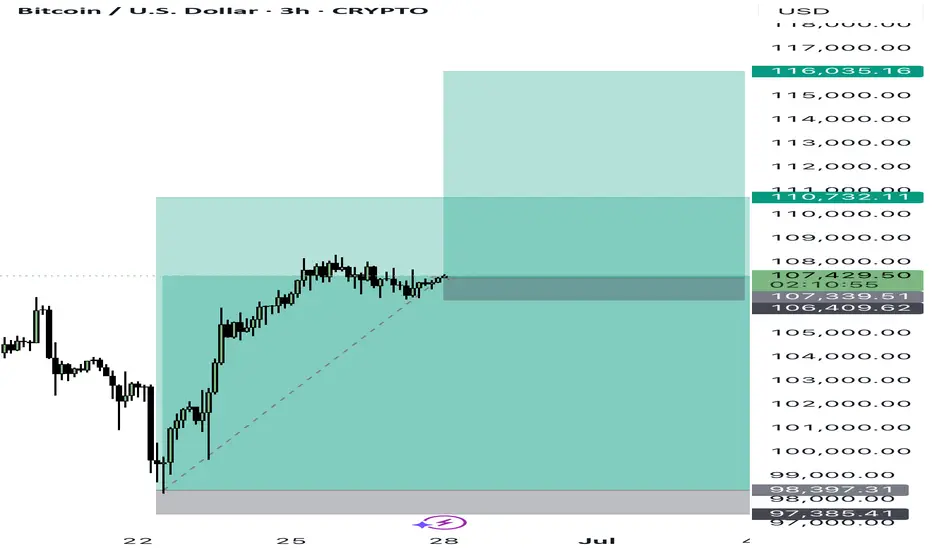
BTCUSD Buy Market Entry 107450-350 SL:106400BTCUSD
BUY By Market
Entry: 107500-107350
Sl: 106400
Tp1: 110000
Tp2: 116000
1% risk
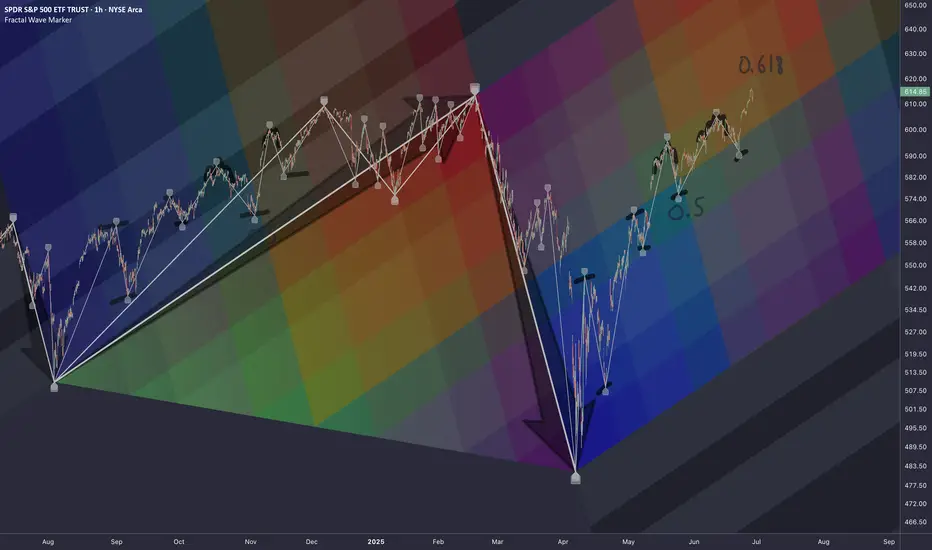
SP500: Wave Estimation via FibsRegularities
Common angle
To estimate where it's heading to we use those recursive patterns and map them through fib scaling. Overall systematic wave expands in similar geometric narrative but with a compressed cycle.
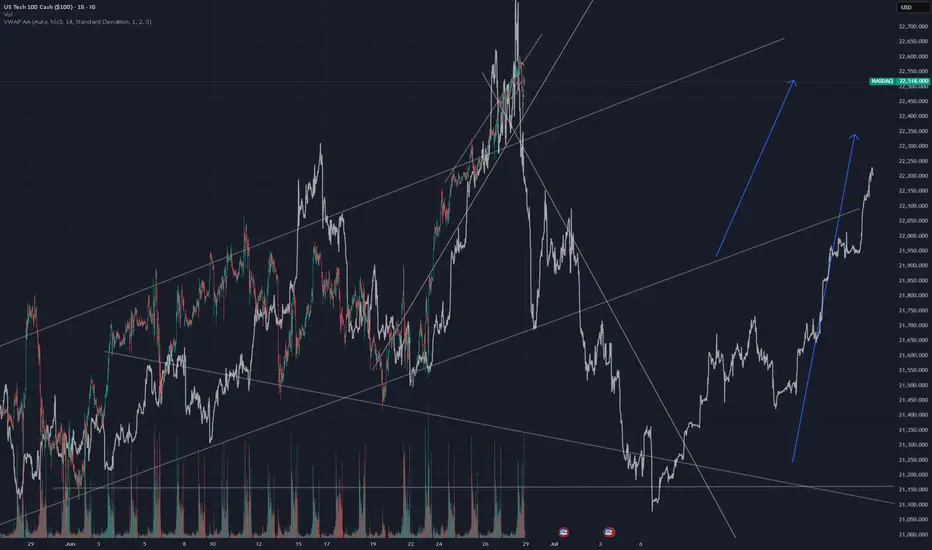
Fractal, 3 steps down then upFractal is based on the whole move of 2024 -2025 flipped and mirrored, seems to be quite accurate. Buying back in when under the recent base. This drop will be quick and hard.
Not trading advice
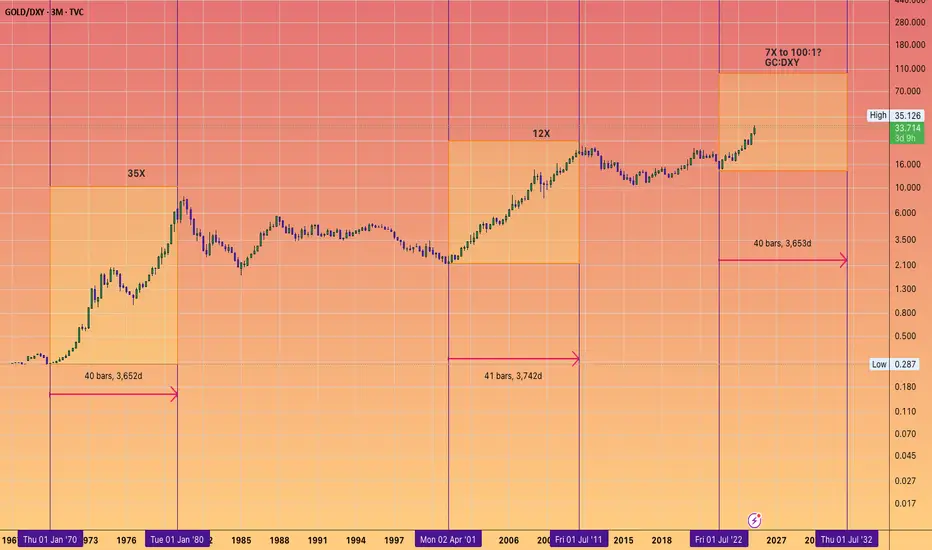
WHAT IS THE EXPECTED RETURN and DURATION of this GOLD Bull Run?Well, when measured against the DXY index, a clear trend becomes apparent.
A Golden Bull typically lasts about 40 quarters, which is essentially 1 decade (give or take a quarter).
Similar to #Bitcoin and its cyclical bull markets within a larger secular bull, the returns tend to decrease over time.
However, it seems that a triple-digit Gold price relative to the DXY is on the horizon at the very least.
What would that look like if the DXY were to hit a new low around 69? This would suggest a Gold price of $6900 at a ratio of 100:1.
A Gold price of $12K with a DXY of 80 only requires a ratio of 150...
Thus, a five-digit Gold price is certainly within the realm of possibility.
I have forecasts that extend as high as $12K.
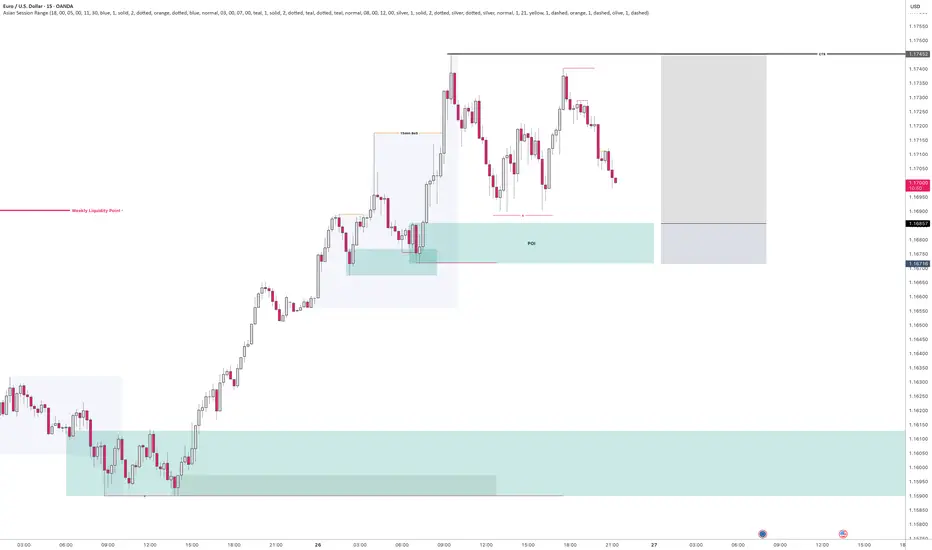
EURUSD - Potential buying opportunityLooking at EURUSD
We are still very bullish with no sign of it slowing.
I am aware of a potential weekly liquidity point to the left, however, until EURUSD shows its hand it's important that we still remain bullish.
We have set up a lovely liquidity point before a lovely demand area.
So I will be setting a pending order at the demand area after the New York close and the Asian session begins.
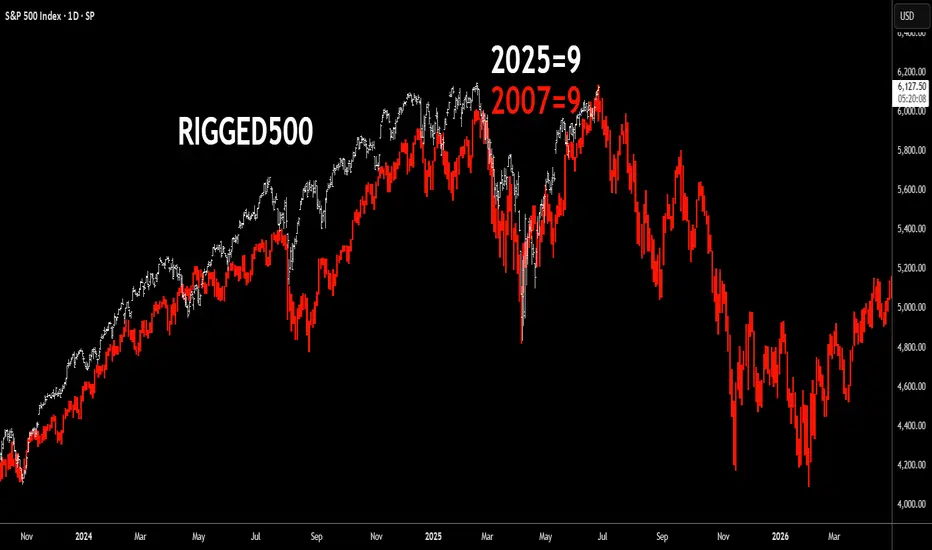
Market crash looming - Fractal Echo of 2007 - 2025 S&P 500 In what other case could the "market" be here if it wasn't centrally rigged?
Geopolitics aside. The 2025 vs. 2007 numerological equivalence ("9" year) shows the power of 9 taking over: the end of a rigged bull market.
Chart overlays the S&P 500 price action from 2023–2025 (white line) with that of the 2006–2008 pre-GFC period (red line), highlighting an uncanny fractal similarity in structure, tempo, and momentum. The visual suggests that 2025 (numerologically marked as a “9” year, like 2007) may be echoing the same setup seen before the 2008 financial crisis: just massively worse.
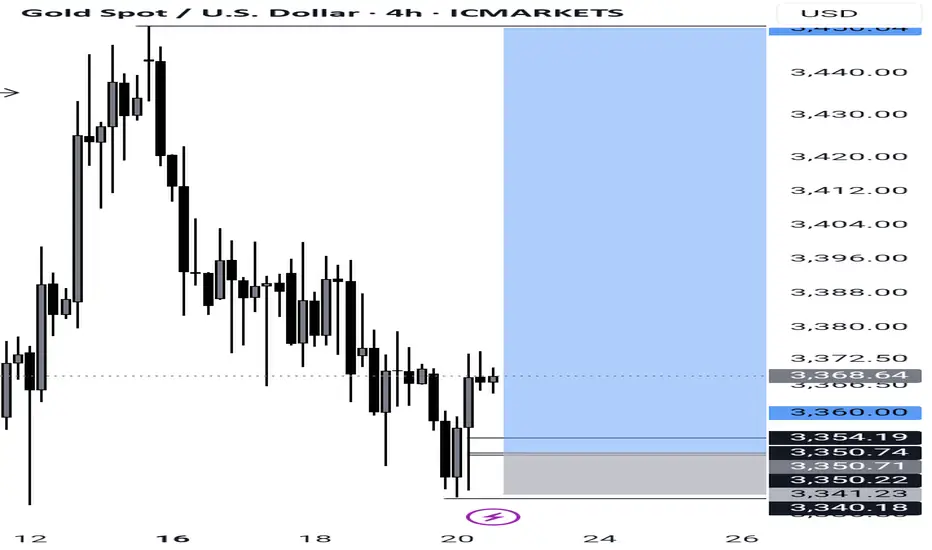
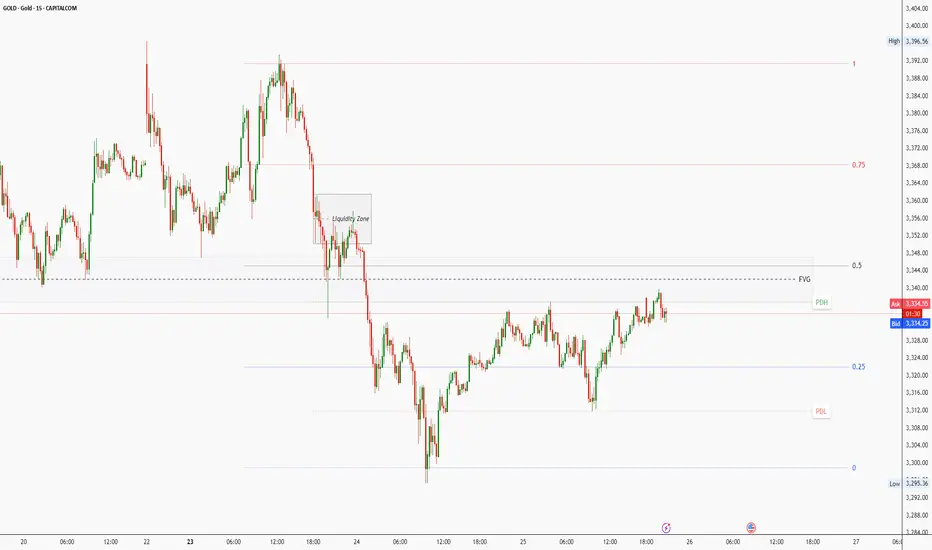
XAUUSD Outlook: Watching FVG Reaction for Bearish EntryThe previous day’s up-close candle didn’t reflect strong bullish conviction. Although price opened higher than the previous candle’s close, it closed only slightly above — completing the three-candle formation required to establish a Fair Value Gap (FVG).
As expected, buy-side liquidity above the previous day’s high has been raided. Price is now pushing towards the consequent encroachment of the FVG. How the market reacts at this level will be key in determining the next directional move.
While I maintain a bearish bias, I expect the market to trade higher into a bearish order block, providing a potential opportunity to enter short. If price does not react from the current FVG, it could continue higher to sweep liquidity resting above the swing high at 2357.82, which sits just below another unfilled FVG.
Entry Strategy
I will look to enter short only after a clear displacement, signalling a change in state of delivery, either:
Off the reaction from the current FVG, or
From a deeper liquidity zone
If no such confirmation presents itself, I will remain on the sidelines and wait for a more favourable setup.
Thanks for your support!
If you found this idea helpful or insightful, please drop a like 👍 and leave a comment — I’d love to hear your thoughts! 🚀
Follow me for more daily price action insights and trading strategies on XAUUSD and other key markets.
Let’s grow and trade smarter together! 📈
Disclaimer:
This content is for educational and informational purposes only and does not constitute financial or investment advice. All trading involves risk. You are solely responsible for your own decisions, so always conduct proper research and due diligence before taking any trades.
Past performance is not indicative of future results. Trade responsibly.
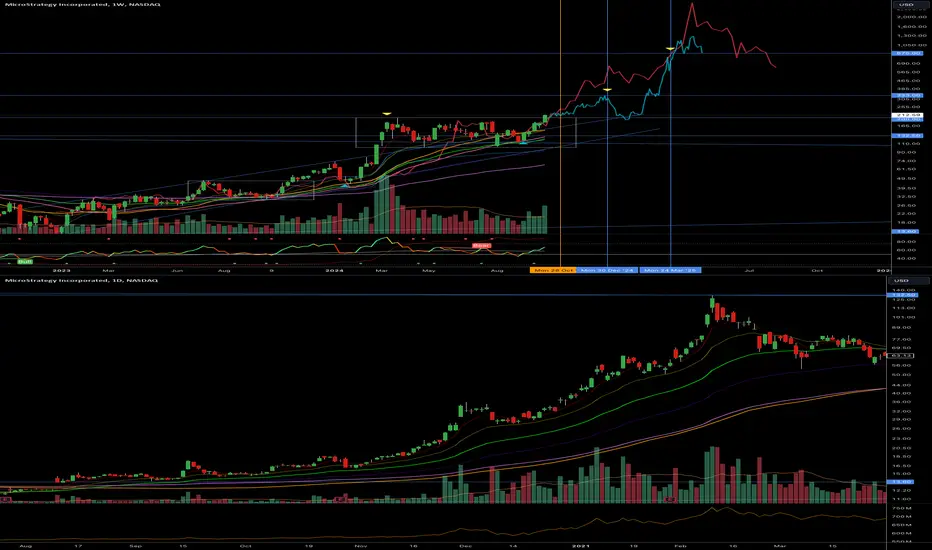
MSTR 10x From HereThis fractal compares the current price action of MSTR to its price action in 2021, during the previous Bitcoin bull market. This time, it is moving slower, so the time interval was adjusted to 1 week instead of 1 day. The next base consolidation target is around December 2024, with a top expected around April-June 2025.
AUDUSD Potential short setup from and H4 Supply zone.We see a momentum loss once we reached the H4 supply zone. We see a lot of liquidity resting below an unmitigated m5 supply, Which could be liquidity for price to move to lower prices.

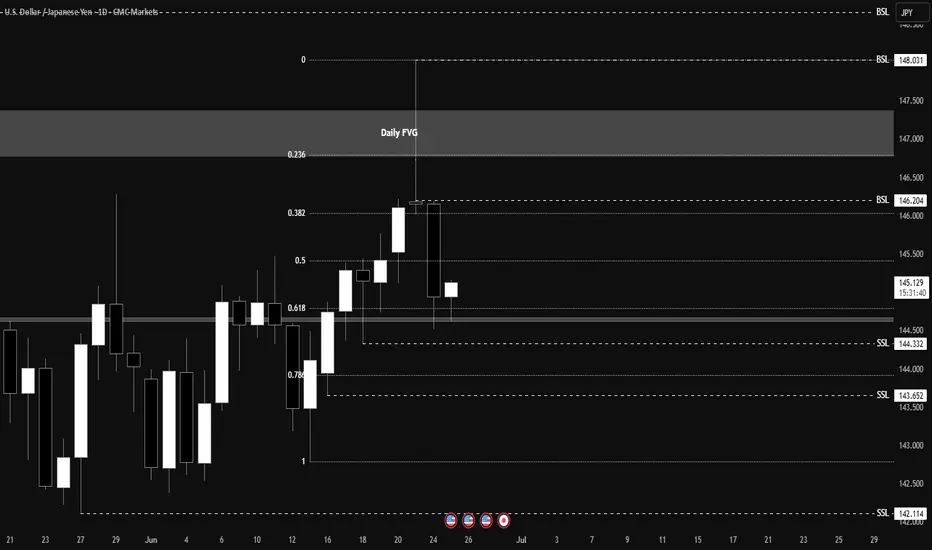
USD/JPY Long projection for the following days.After the sweep of liquidity, and a deeper mitigation of a weak, And of course our CH which is the strongest indication that enough buy orders are absorbed from the market, can indicate that we will see UJ in higher prices.

Looking for an immediate rebalance on USDJPY daily chartLooking for an immediate rebalance on USDJPY daily chart
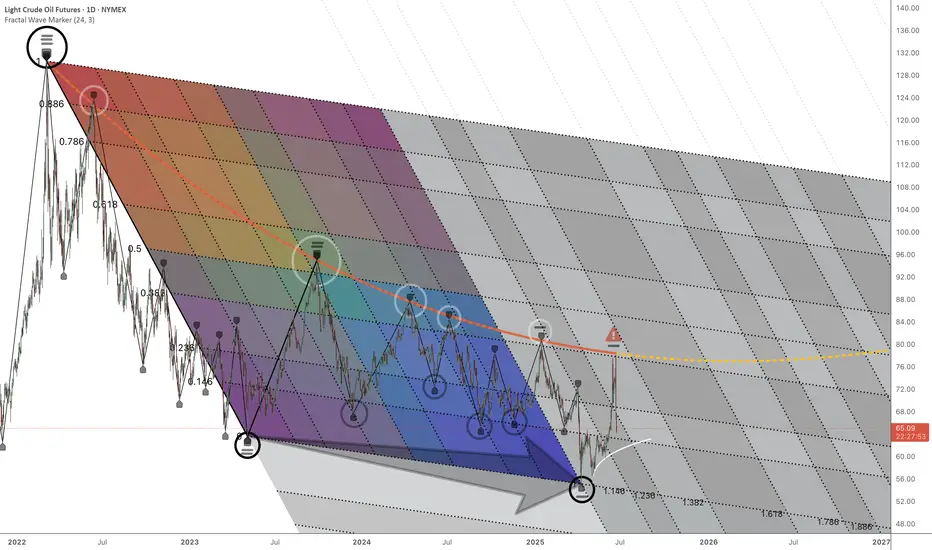
CL1! Structural NarrativeResearch Idea
If look we beyond surface appearances, we would ask what kind of iterative, generative, or probabilistic mechanisms could have created those movements. Complexity can arise from simplicity, and that what looks messy may follow deep mathematical logic.
We can see the curve that connects series rejections that exposes where selling pressure extends compression until broken.
Another pattern would be current price expressed as a fibonacci ratio of a broader cycle as it splits them into phases.
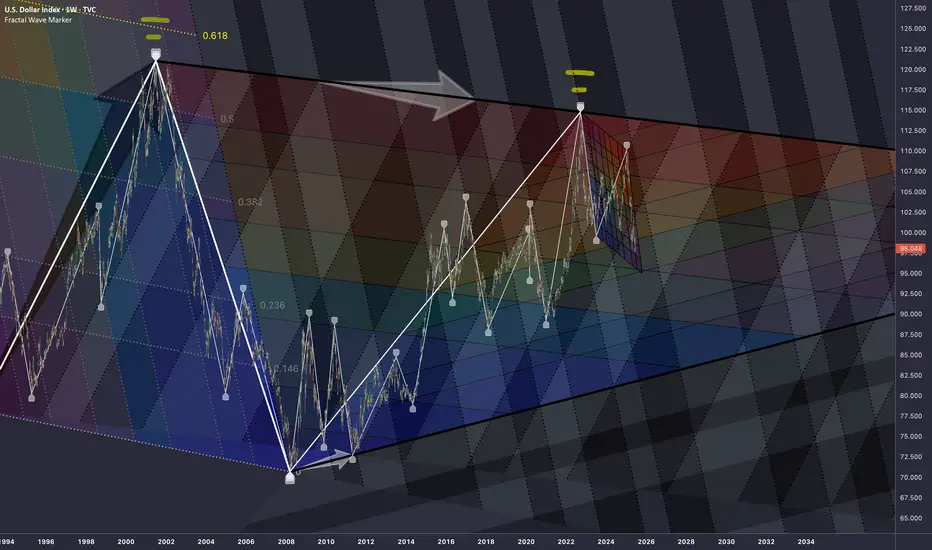
DXY: 2 Cycles InterconnectedDownward tilt defines highs of '01 and '22 at phi
Topologically looks like expanded version of previous cycle. Relating them creates confluence zones.
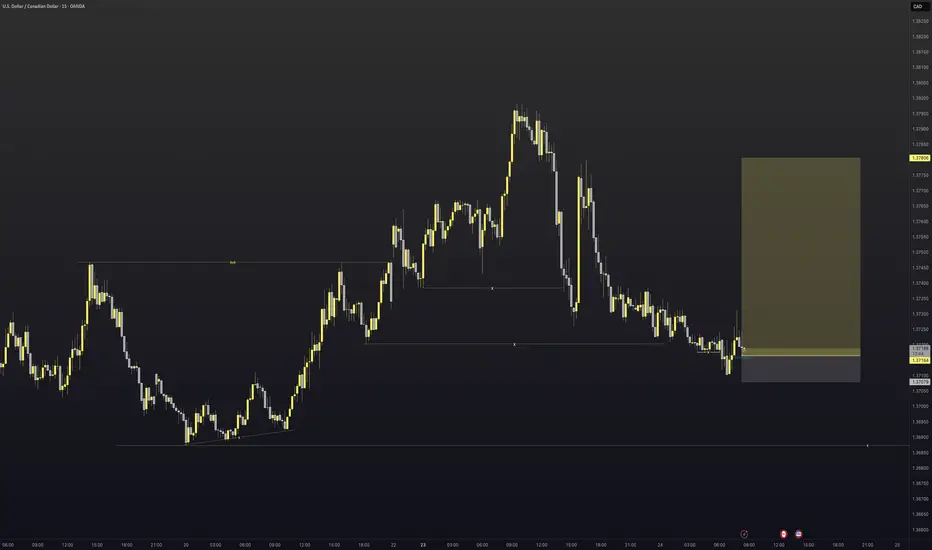
USDCAD - Long triggered We have entered into the discount area of the most recent swing point on USDCAD. With doing this we have taken out all the areas of liquidity within the trading range so it was time to look for potential long moves.
Now at current price we have had a great example of AMD where by we
Accumulate
Manipulate
and then the hope is that we begin to distribute higher.
There was also a nice fair value gap that was left behind on the 5min
So all that was left to do was execute.
Let us see how it plays out.
Win or lose great entry super happy with the trade. Lets see how it goes
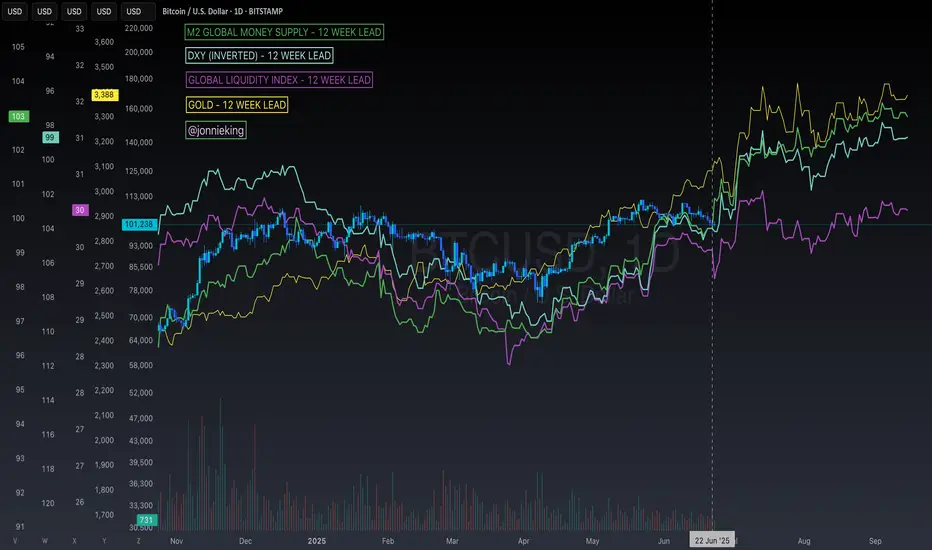
$BTC Leading Macro Indicator Chart Predicted the Nuke to The DayYet again this chart predicted the nuke to the day 💣
I know I shouldn't be surprised at this point, but I'm still fascinated by how accurate technical analysis can be 🤓
XAUUSDExpecting price to open and decline a bit to then buy possibly for the rest of the week. Looking for Bulls to take over for as long as price respects the lows below after Monday headings candle formation the direction might be validated. If not right after Mondays open and low. If not then we might expect the opposite direction.