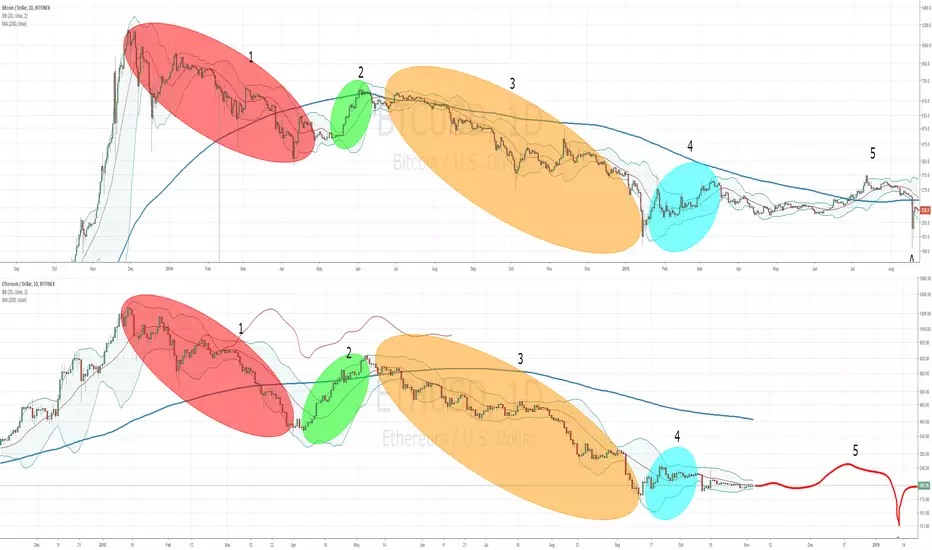
The astounding similarity of ETH bearmarket 2018 and BTC in 2014I stumbled upon this fractal similarity which is quite amazing in its really high degree of similar behaviour.
We can see that all the areas denoted with 1-4 are matching almost exactly.
So whtat does this mean for the future behaviour?
It would mean that we'll see a slow climb in Nov/Dec, a sharp sell-off in January at point A, which could fit, because historically January has not been a good month for BTC and alts.
Then, a rally in March, and then the subsequent slow start of the next bullrun, which as we know builds up very slowly, so I assume the peak in this scenario would be in 2021.
I am still remaining neutral though, because first, BTC must break the logarithmic resistance for me to see this scenario as a very high probability scenario.
But it certainly is a probable scenario. This means that we are seeing the bottom right now, and we'll basically have a few more months of boring sideways, until the next bullrun peaks up steam
in mid to end of 2019.