What is behind the dollar growth? Forex Market Trading PlanYesterday's dollar growth took many by surprise on the foreign exchange market. The dollar index has reached its maximum in the last couple of years. Let's try to understand the reasons for this growth, as well as reflect on the near future of the US currency and trading tactics.
There were several suggested explanations for the growth of the dollar by leading analysts and traders. One of them - the rise in prices on the oil market will trigger an increase in inflationary pressure in the United States. In turn, the unwinding of the inflation spiral will force the Fed to reconsider its current position in relation to rates. The process of raising them will be removed from the pause and the Central Bank will continue to increase the rate.
Another reason for the dollar growth, voiced by analysts, was the expectation of good statistics on US GDP for the first quarter and the current strengthening of the US currency - an attempt to discount for good data.
As we see, both explanations are outside the plane of facts and, in fact, are trading on expectations and rumors. That is, the markets routinely “buy” rumors, so than to sell the facts.
In this regard, we are extremely skeptical about the prospects for further growth of the dollar in the foreign exchange market. At least, till growth begins to be based on facts. For example, will excellent data on US GDP will actually come out? Or the Fed will make some real statements and actual actions? So far this week, data on sales of new homes in the United States (reached the maximum for the last year and a half marks: + 4.5% with a forecast of -2.7%).
Note that the dollar growth has also contributed to the weakness of its main competitors. The euro was declining due to problems with Italy (rating agencies may downgrade Italy), the pound was traditionally “upset” because of the lack of progress in Brexit (according to rumors, Theresa May is serious about voting on the Brexit bill again, on the next week, considering that nothing radical it was not included in it, the chances for another failure are very high), the Swiss franc and gold were falling because of the general growth of investors' “appetite” to risk, and their exit from safe-haven assets.Thus, our position on the dollar remains unchanged - we will continue to look for points for its sales in the foreign exchange market. And we will do this in double volumes with obligatory and rather rigid stops. However, the size of potential profits justifies such a risk.
In relation to the news, the following day is interesting because of the meeting results of the Bank of Canada. The Central Bank is likely to leave the parameters of monetary policy unchanged. But the recent rise in oil prices has definitely played into the hands of the Canadian dollar. So, we recommend watching USDCAD- current quotes look exceptionally attractive for its sales. Our trading plan for today is USDCAD sale from 1.3450 with stops above 1.3520 and profits around 1.33.
Despite the fact that we are going against the current “will” of the market, today we will continue to look for points for selling the dollar against the euro, the pound and especially the Canadian dollar. We will wait for a little with buying of gold, but we will look for points for buying oil on the intraday basis.
Franc
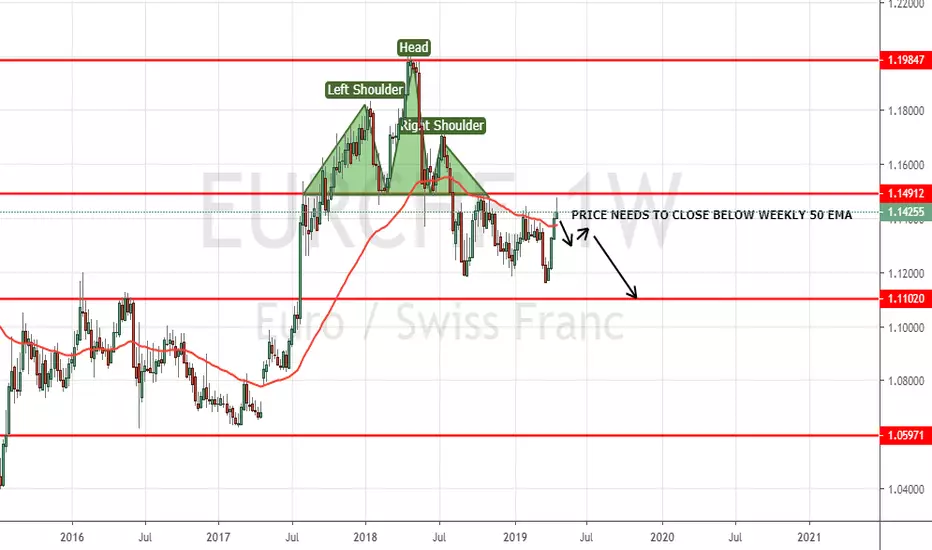
EURCHF Needs to Break WEEKLY 50 EMA To Target 1.11500 !With the H&S Pattern completed sometime ago, this pair Hit the support that lied in the region of 1.11500, from there onwards it started a rally that went back and tested the neckline of the H&S pattern. With the eurozone economy slowing down, we can expect the price to drop again towards the lower end of the range.
To do this, the weekly candle must breach the weekly 50 EMA and close below it. After that we have enough confirmation that the price is likely headed back southwards.


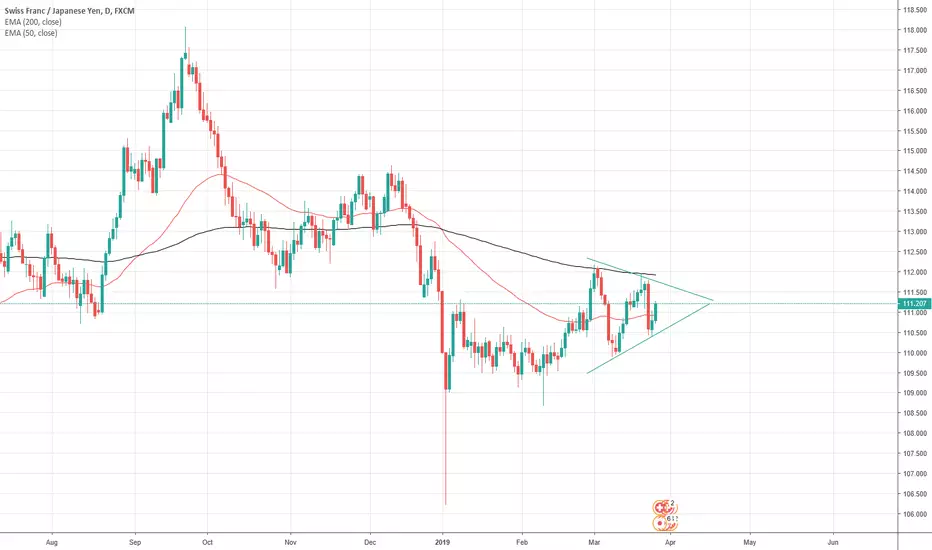
Swiss franc and Japanese yen play tug-of-warOver the last several weeks, we have been watching the CHF/JPY pair as we continue to bounce around in a symmetrical triangle. This is going to be a very interesting pair to watch as both are considered to be “safety currencies”, and as a result you can watch this pair to decide which currency you should either buy or sell based upon risk appetite in other currency markets.
When traders are a bit concerned about global growth or geopolitical issues, they will typically buy the Swiss franc or the Japanese yen. However, if you do something called “triangulation”, meaning looking at least three currencies, you can maximize returns. When looking at the CHF/JPY pair, you are looking to see which safety currency is stronger than the other. Because we are forming a symmetrical triangle, and I would point out on top of support, it suggests that perhaps the Swiss franc will strengthen against the Japanese yen, although we do not have confirmation of that yet.
If that does in fact happen, then we know that if we place a “risk off” trade, you will want to short the GBP/CHF, because the Swiss franc is stronger than the Japanese yen. By contrast, if we see a scenario where it is a “risk on” trade, you would be better off buying the GBP/JPY pair, because the Japanese yen is weakening.
As for this pair by itself, if we can break above the ¥112 level, we are very likely to go looking towards ¥114 above. By contrast, if we break down below the ¥110.50 level, we will test the ¥110 level, and then possibly the ¥109 level after that. That being said, the pair seems to have less resistance than support in the vicinity, so that should always be paid attention to.
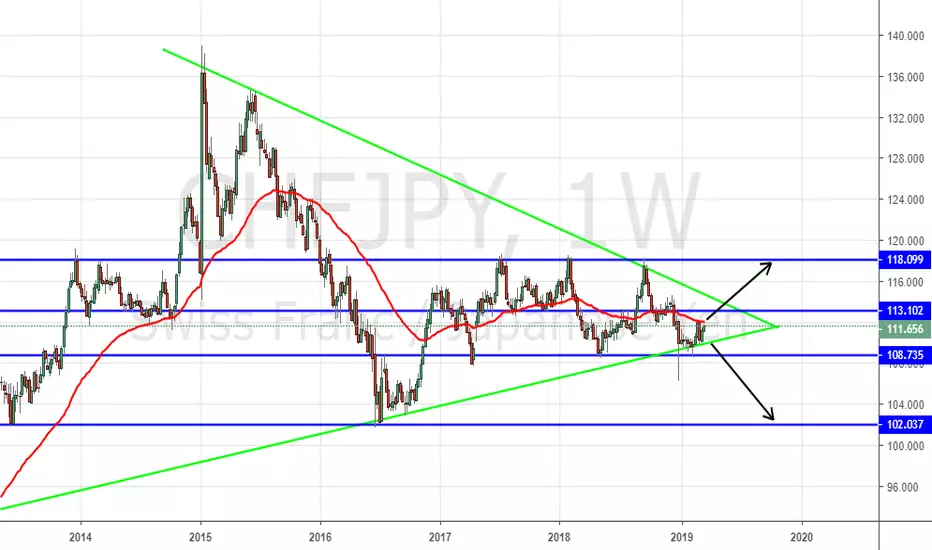
CHFJPY Confined in A Weekly wedge. Awaits breakout Momentum!The blue lines represents the support and resistance levels drawn from the monthly charts. If the price breakouts of the triangle in either direction the support or resistance levels next to them needs to be broken decisively in order for the technical aspects to be in our favour of the trade.
shall there be any updates i will post them in a new thread. this just represents my outlook and analysis on this pair. if the technical aspects of this trade meets, i will post the entry and exit details in a new thread. cheers
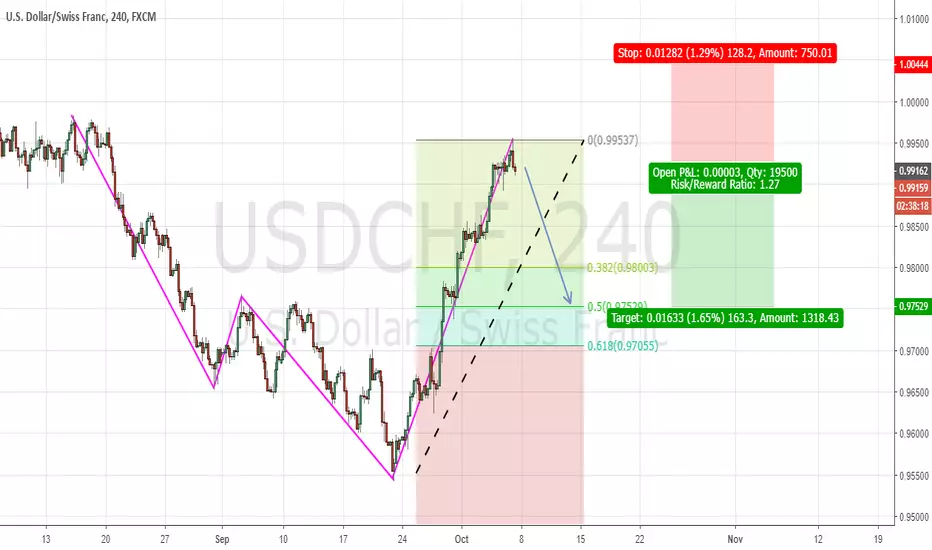
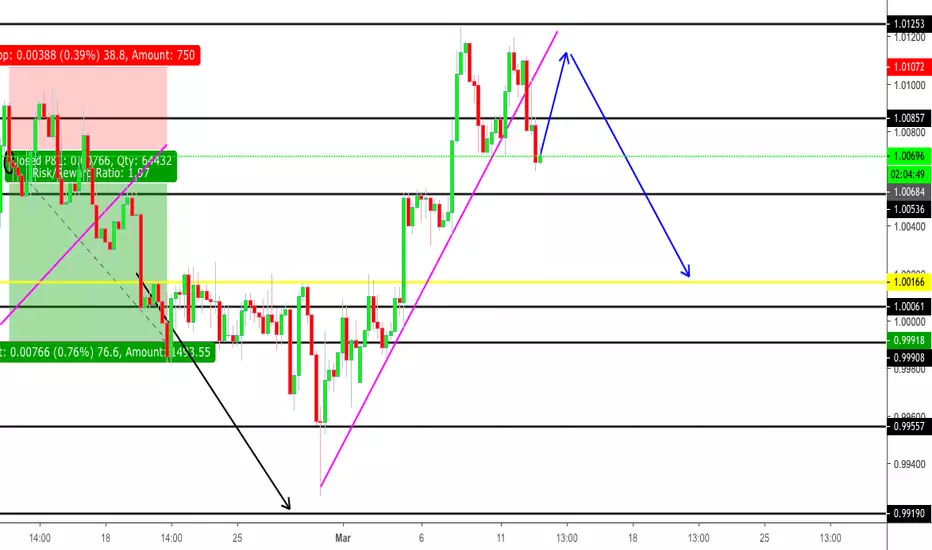
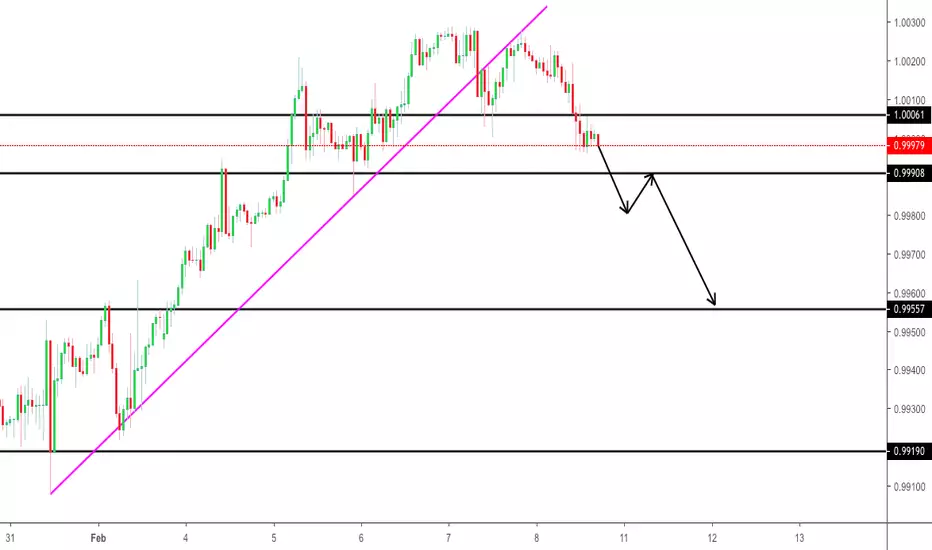
USDCHF - 12/3/19Looking for the retest of this trendline and I'd like to see price drop.
We also have a double top reversal pattern
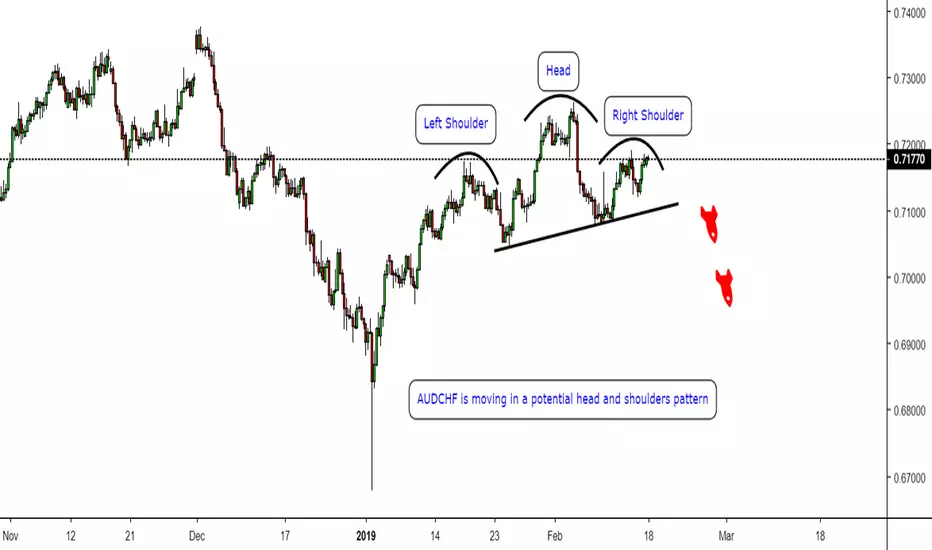
AUDCHF Targets 0.6900 AUDCHF will target 0.6900 if the price break the neckline of the potential head and shoulders pattern.
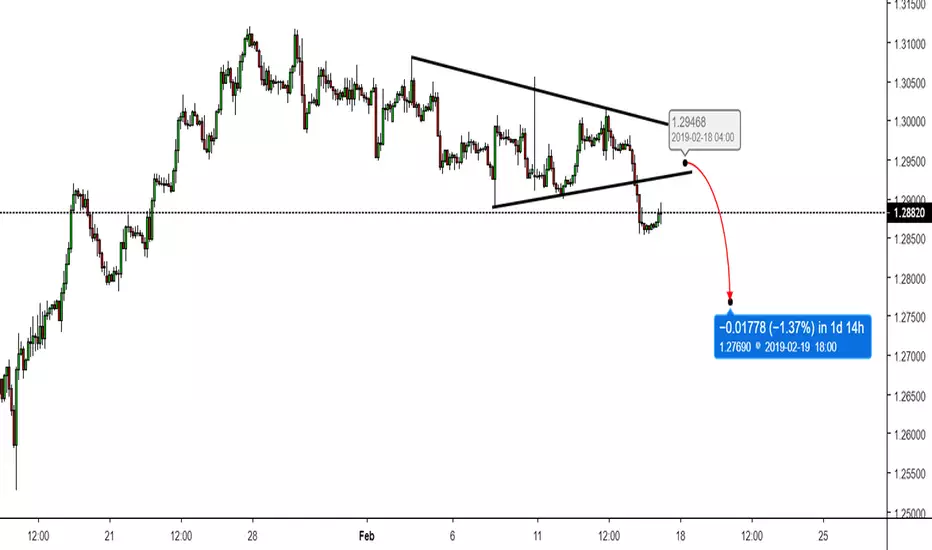
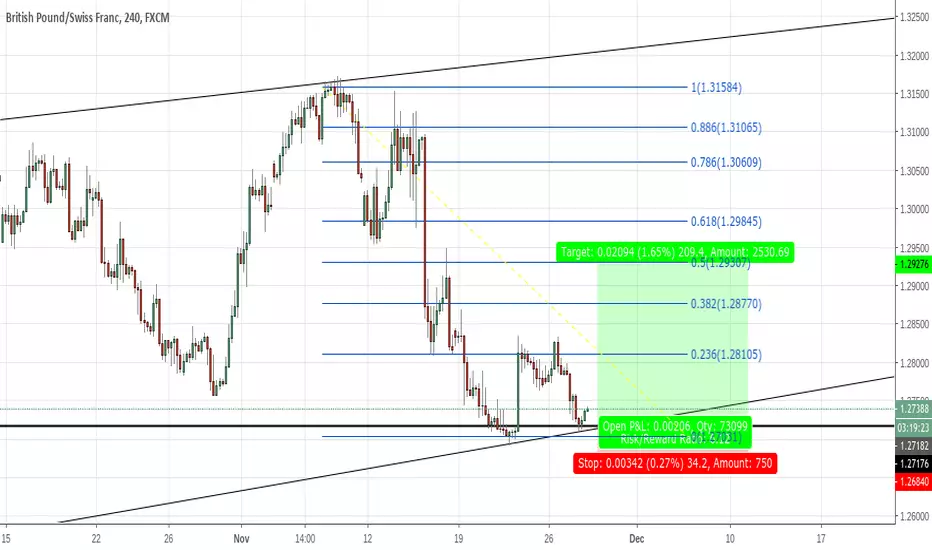
GBPCHF for Sell Hello followers I'm looking for sell GBPCHF it it gives me another opportunity and come back to the 1.2950 levels Because
- The pairs broke the triangle
- Yesterday candle is bearish Engulfing candle
Good luck
WICKS WICKS SWISS FRANK WICKS
Listen.
The wicks dont lie.
The peak has been reached as seen in my orange zone.
Expect further retraction on USDCHF.
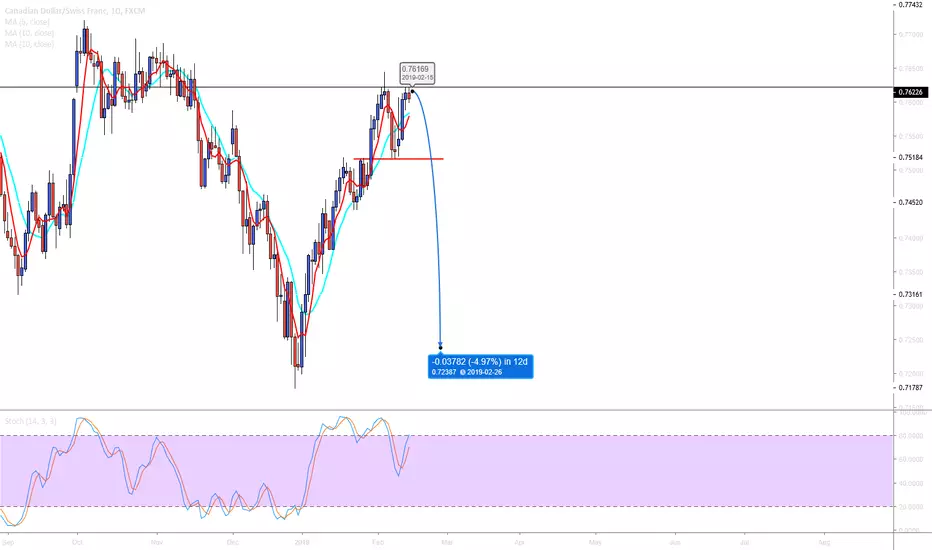
CADCHF Double top ShortCADHCHF setting up for a double top pattern. once we see it return to the neckline, i'll be looking for a long terms short position, with a take profit of 500 pips.
Stop loss will be at the most recent high.
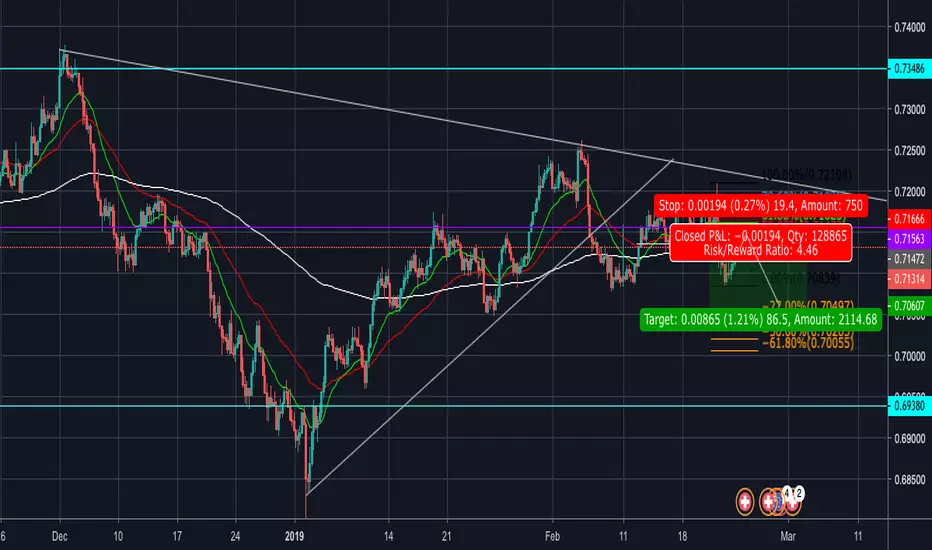
USDCHF - 8/2/19Going along with my take on the Dollar Index, we can expect the DXY to sell, therefore causing this pair to sell as the dollar weakens. We can see that price has broken this trend and has failed the retest, thus becoming a confirmation to sell.
USDCHF DAILYRANGING MARKET WITH SHORT TRENDS...WILL WAIT FOR A BREAK AND RETEST LONG OR SHORT. IM FLAT FOR NOW,LETS WAIT FOR DIRECTION.
USDCHF - SUPPLY & DEMAND ZONE ANALYSISHi traders.
Whenever you are looking at a technical level, always ask yourself the following:
- Am I buying at a potential bargain/wholesale/discount price? (supply or demand zones)
- Why is there more likely to be more supply/demand orders at that area? (new traders entering/traders taking profit)
- What are the underlying fundamental/sentiment drivers that should push price in my favour? (interest rates, business cycle, risk on/risk off)
If all 3 are in your favour, take the trade, manage your risk and go for more than you've risked.
Always remember this trade is only 1 trade in the next thousand you're going to take.
Process over outcome!
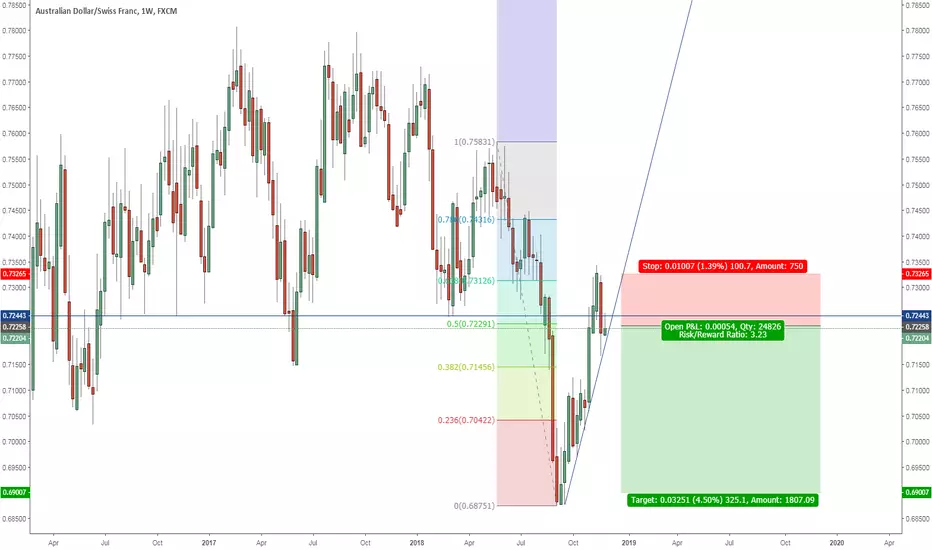
AUDCHF, Bearish Engulfing Bar on the Weekly ChartPrice has reached 61% fibo level, but failed to stay above it. The pair formed bearish engulfing bar on the weekly chart and now it is below an important horizontal resistance. You can short AUDCHF if it drops below the ascending trendline.
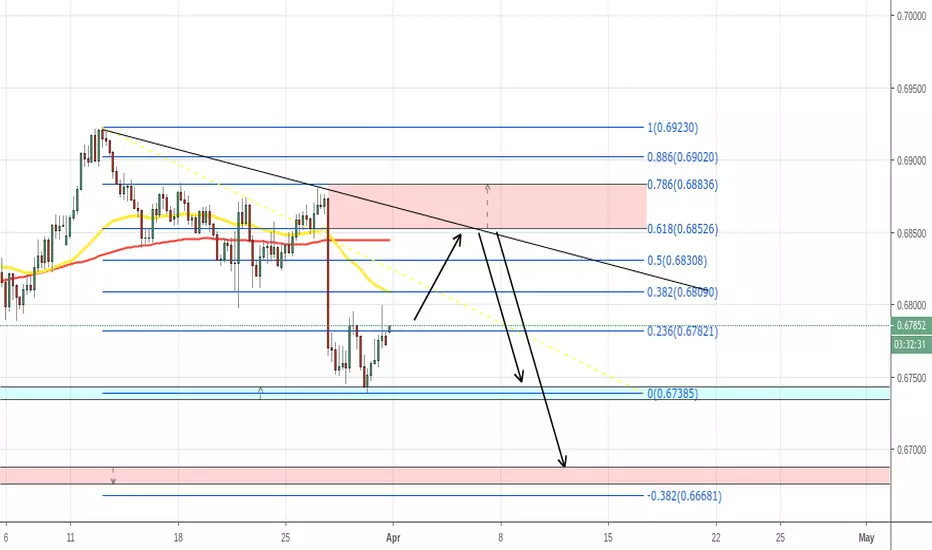
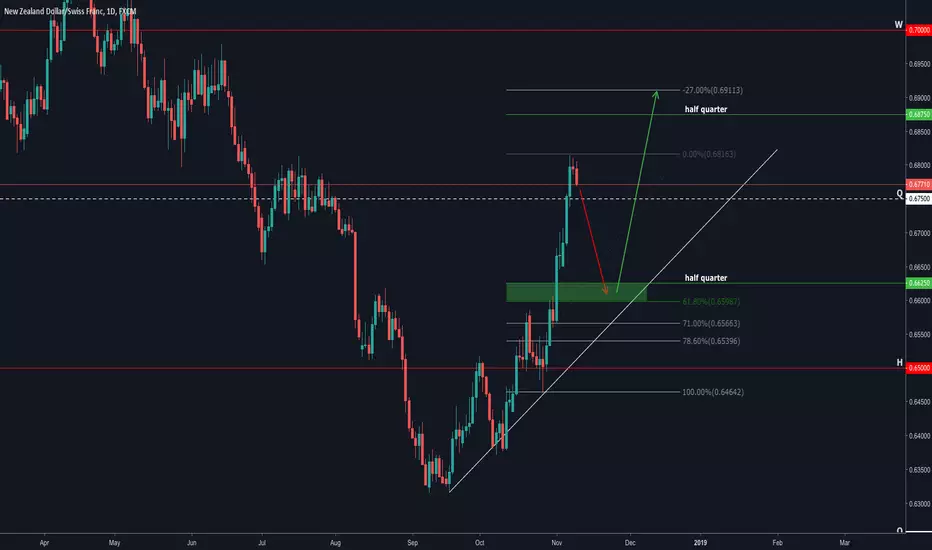
NZDCHF 11.11-11.16Here we have NZDCHF on the Daily time frame. Over the last week and a half this pair has been shooting to the moon and I believe its time for a retracement.
Price couldn't push through and stay above quarter level 0.675 giving us a failed quarter transition.
I see price returning to around the halfway point between quarter level 0.675 and 0.65. Around the 0.6625 mark. This falls just before the 61% fib level so taking a bit of overshoot into account, I think this is a safe level to look to go long back up to the -27 fib level. Which also lands just past the half way point of quarter level 0.675 and 0.7.
Trade at your own risk. I am not qualified to give investment advice.
Happy trading :)
~TraderTrev
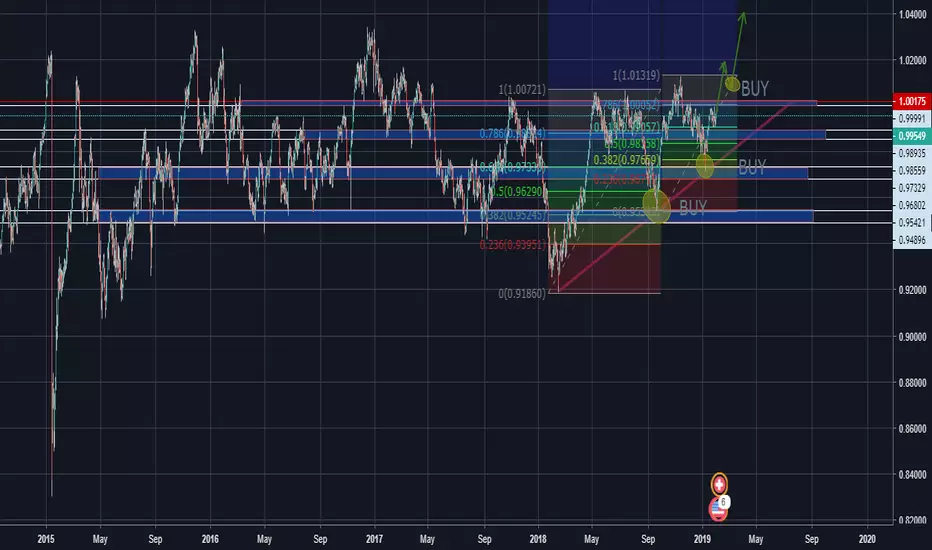
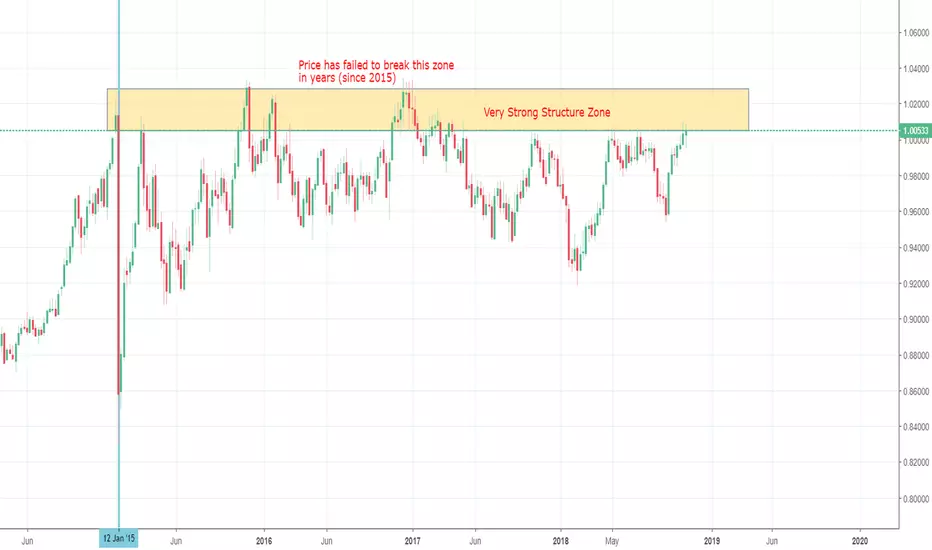
USDCHF STRONG STRUCTURE ZONE (WATCH THIS PAIR) USDCHF STRONG STRUCTURE ZONE
I don't only want to post trades on here for you guys I also want to be able to post market outlooks and analysis as well. As you can see USDCHF is just starting to come into a very strong structure zone. Back in January of 2015 you can see that this market had a 16%+ drop in a matter of a week. THAT IS HUGE and as you can see it's something the market hasn't forgotten about and has been struggling to recover ever since. Market prices have not been able to break above this zone in years and this leads me to the fact that it is more probable that it will not any time soon. Now I could be wrong, but I let the market tell me what it wants to do and by the past few years it had shown me it can't break above that January 2015 high.
Keep an eye out on price in this zone in the upcoming months to watch and see how this pair plays out and if we can potentially capitalize on what the market tries to show us. Keep and eye out and keep it on your watch list because it is a really significant zone based on the data it is showing us from the past market conditions.
Cheers! Please like and follow my profile for more posts of trades, analysis, and big profits! Cheers!
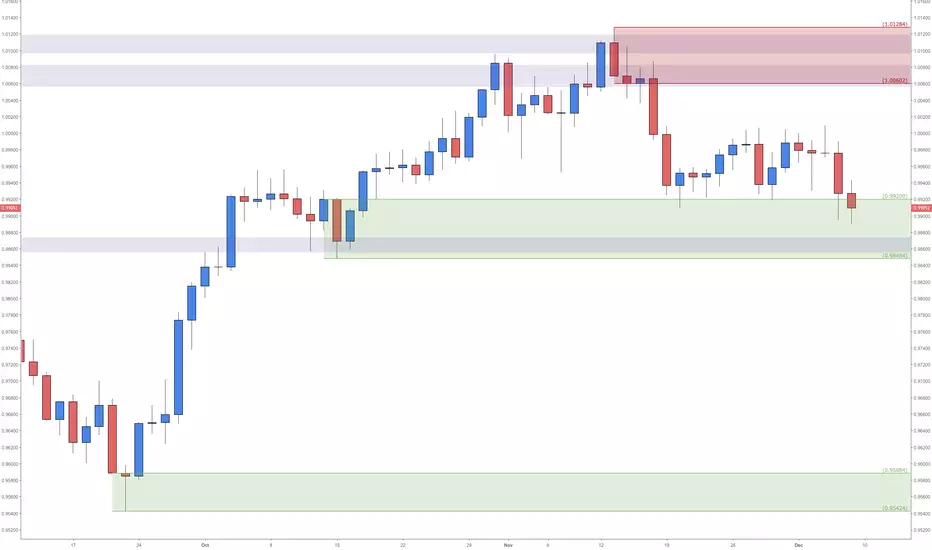
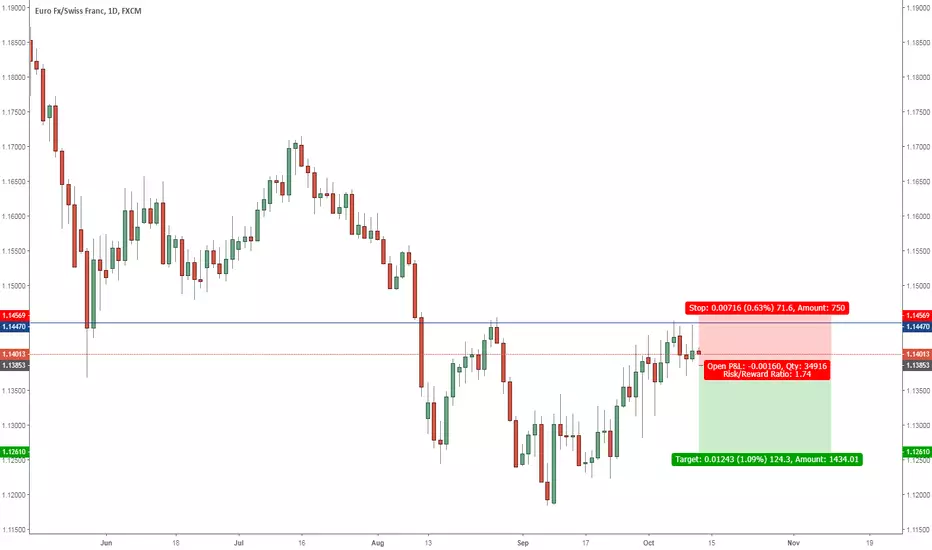
USDCHF Bearish scenario breakdownSince we're still below a major resistance, it's also possible to look for bearish scenarios. We will know what's going to happen once we have a break on either side.
If we break down from here and below the daily breaker (+ daily horizontal level), we'll be looking to short the retest and aiming for those lows there.
Again, wait for confirmation and trade carefully.
For the bullish side check out my previous idea.

EURCHF, Double Top & Long Wicked CandleEURCHF has formed the double top and the yesterday's candle shows rejection of the horizontal resistance. We should short the pair if price drops below the yesterday's low. Stop loss should be above the top of the yesterday's candle. Take profit 1.5x - 2x from it.
Bearish Shark Pattern Complete On 4Hr TF USDCHF! Lets Go ShortSee the main chart for analysis, entry, sl and tp level. if there are any updates i will update below