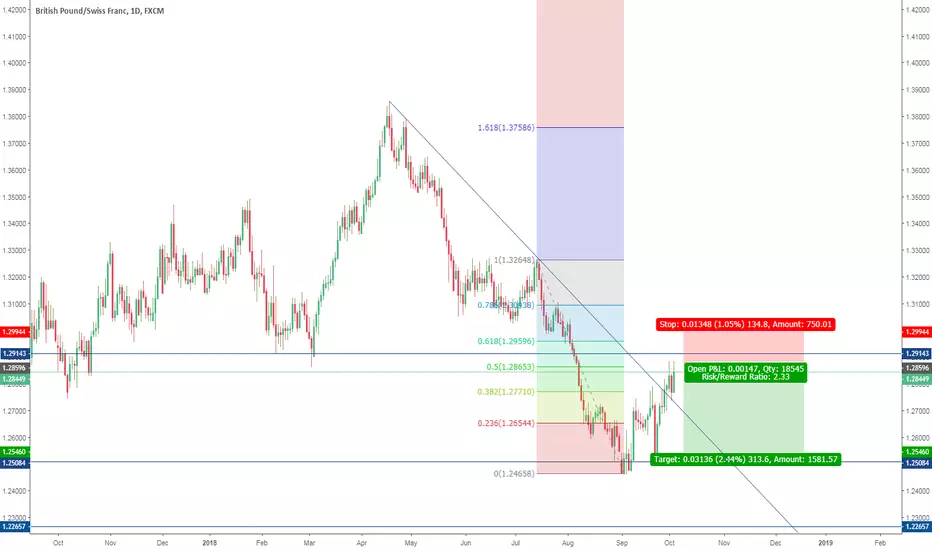
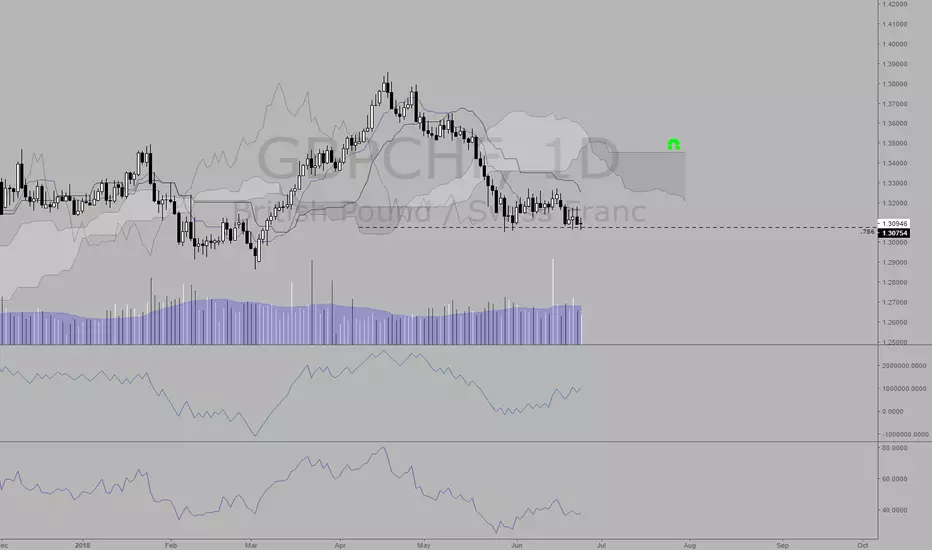
GBP/CHF, ShortThe pair has reached the 50% retracement which is very close to an important resistance line. It would be ideal if we can have a rejection bar on the daily chart today or tomorrow.
Franc
Bullish Gartley Completed On Weekly Chart NZDCHF. Still Valid!On the weekly charts of NZDCHF The bullish gartley was completed 4 weeks ago but however the pattern is still valid. It has to be understood that harmonic patterns do NOT immediately reverse from the point D, they need time and market reaction in the real world is everything. i am awaiting for some technical confirmation before taking this trade on. The risk to reward seems to be very healthy too on this one. stay tuned
Long term harmonics pattern are very reliable and i will be keeping a close eye on this one.

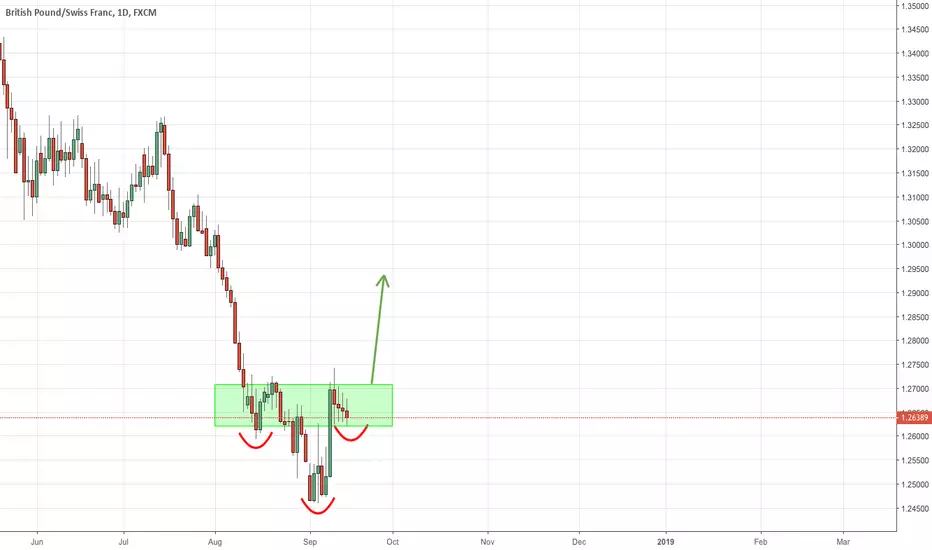
GBPCHF LongQuite clear inverse H&S pattern forming here. Best R/R is to go take longs especially if look at the Daily and Weekly timeframes. Heavily oversold and CHF futures are somewhat stretched and primed to be sold off any time now. I'll be looking to add to my long positions on this pair.
Good luck!
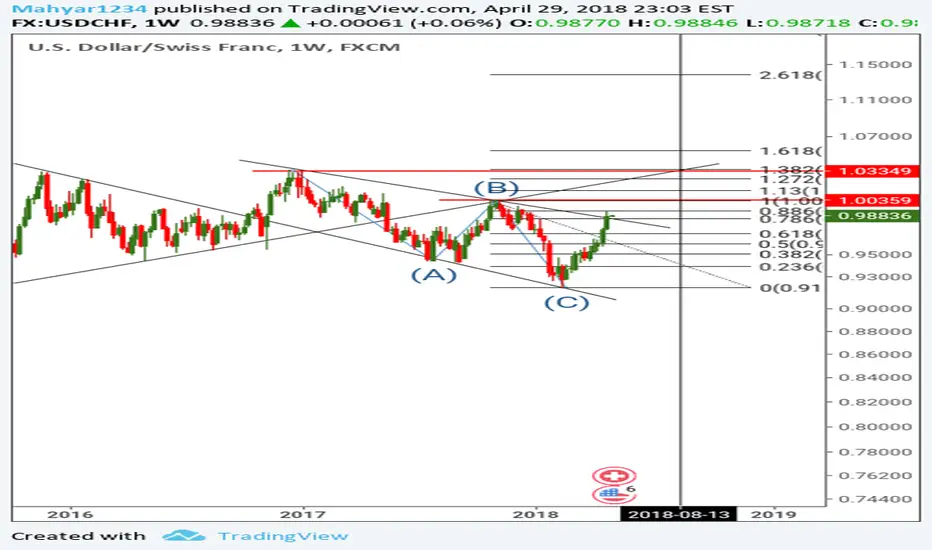
USDCHF Trade setupTwo possibilities here on the larger timeframe for this pair. With SNB and FOMC on tap, we'll have a clearer picture for the next major direction on this pair. Until then, stick with lower time frames and keep stop losses tight.
Good luck!
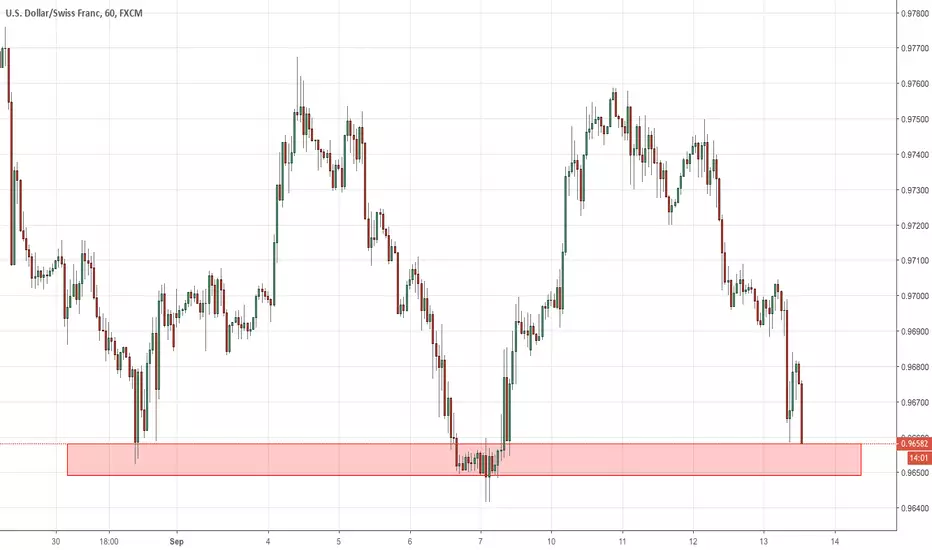
USDCHF *Cautious* LongDXY has been under pressure with support nearby at 94.42 however we could see a triple bottom on this pair in the region highlighted below. Long positions to be taken with caution with US Retail data on tap tomorrow.
GBPCHF LongClassic bull flag in progress after a major rally early in the week. With BoE on tap and CHF overstretched, GBPCHF should continue upwards.

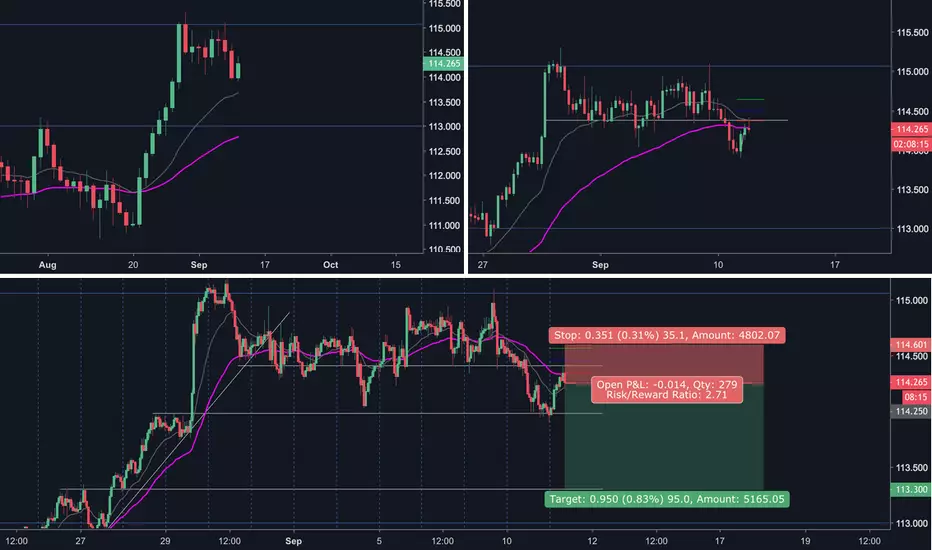
4hr Range Breakout PlayOn the daily, price showed a massive bull run from Aug 21-29th with overextension to 115.00 key resistance and a small double top.
The 4hr shows a range breakout and retest along with a 50ema break and retest at 4hr resistance and 38.3% fib.
The 1hr shows a downtrend forming along with a break and retest of 50ema and 4h/1h resistance.
Profit target is at the 1hr support (113.30) which is above Daily key support at 113.00
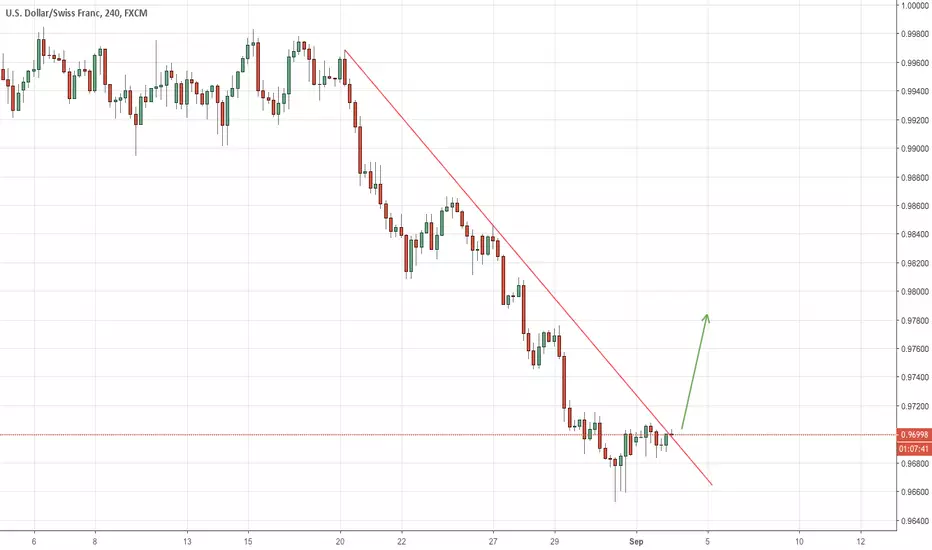
USDCHFNice bottoming formation on the lower time frames and downtrend has been broken on H4. Safe to start accumulating long positions.
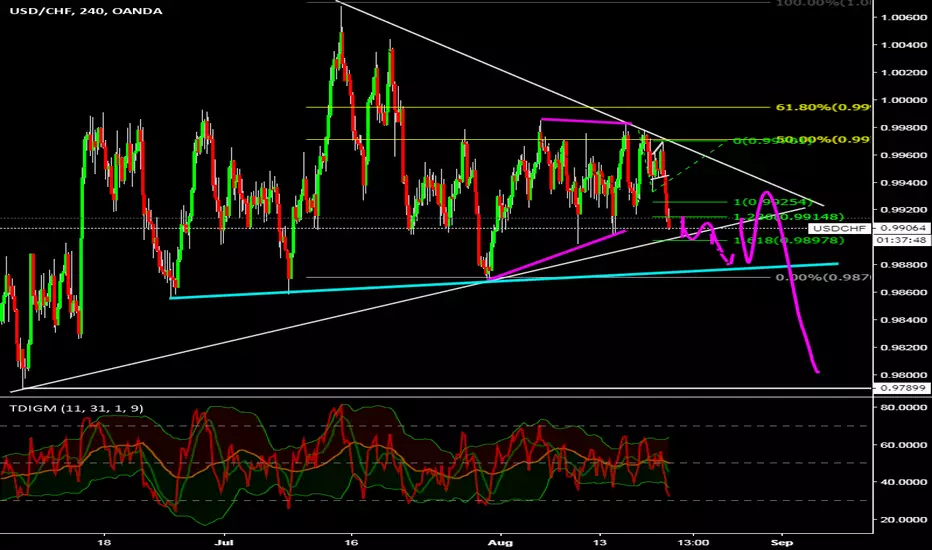
USD/CHFUchf looks like it made a contracted flat at this point. If it is gonna drop, watch for a possible small flag at the .9900 level/trend line... It seems like we are still gonna finish this correction. I prefer to see those corrections break the high before they drop, but it can be considered completed now. The real entry was at that smaller flag.
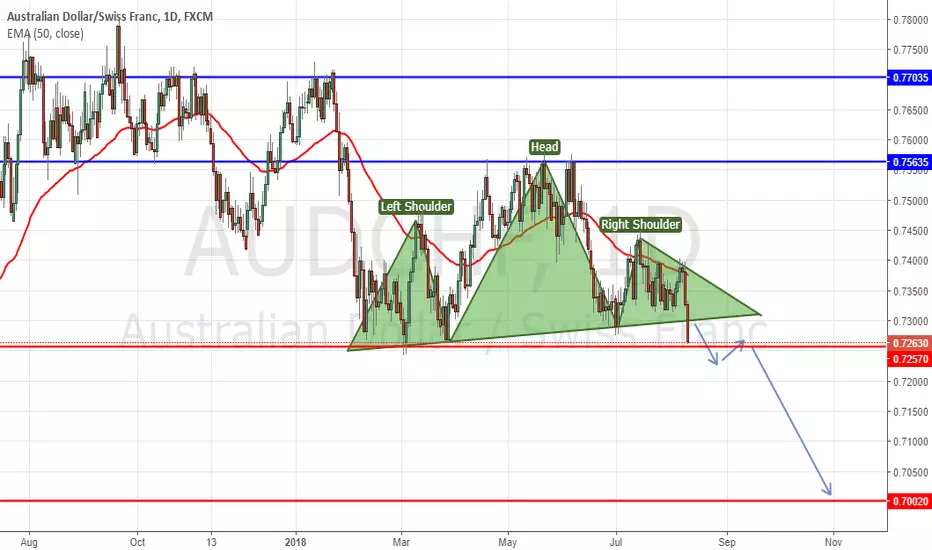
Will The AUDCHF Break The Neckline of H & S ?This symbol features the Australian Dollar - Swiss Franc cross pair. While less popular than the AUDJPY cross, the AUD/CHF has similar characteristics in that it can be used as a carry trade. Some may also view this pair as a reflection of risk sentiment due to the risk-on nature of the Australian currency and the safe-haven characteristics of the Swiss franc.
Source of above information: www.dailyfx.com
There is no doubt that the head and shoulders pattern have been forming on multiple currency pairs especially the EUR pairs, more specifically the EURUSD. Today the long standing Head And Shoulders pattern on the EURUSD should be completed as the bears are on rampage!. If the EURUSD tumbles in the coming weeks to record LOWS then we should see multiple safehaven FX pairs most notably the CHF and JPY gain momentum as well. This has everything to do with the currency correlation when trading.
Many traders are watching the EURUSD pair at the moment and a potential break to the downside is almost imminent in the coming week and therefore we take a look at the AUDCHF pair in this part of the analysis!. It has rejected the crucial resistance level on multiple occasions (see the blue lines) and its looking to head down. Currently the one of the most prominent confluence factor to support this fact is the formation of the H & S Pattern that is on the verge of completion and the only thing holding is the break of the neckline!
If and only if the weekly candle closes below this neckline (the red line on the chart) we will potentially see the pressure build up to the downside in the coming weeks. Personally for the entry criteria to be met, i would want the weekly candle to close below the neckline and the support level, followed by a slight retracement on the daily charts or 4 hours charts before i can enter this trade SHORT. The TP target is also favorable as the next crucial support level lies far down at 0.7000 psychological level!
It remains to be seen what happens in the coming week and this pair is highly dependent the EURUSD head and shoulders pattern. Personally the EURUSD is a great trade to take but i am already LONG on the USD (NZDUSD). See the related link. Due to this AUDCHF represents the best opportunity to trade if you already have an open position on the USD,
Stay tuned for any updates and signals. Follow me for more indepth analysis and signals. Cheers
GBPCHF Long.786 Fibonacci level holding, Large divergence on RSI/OBV, flat top Kumo, less trade war noise could see swiss franc retrace as it becomes less attractive as a haven currency
CADCHF ShortAs we can see from the diagram, a nice Head and Shoulders pattern unfolding on the Daily timeframe on this pair. BoC's hawkishness provided us the spike up today to form the right should and the price was stopped at old broken support that has now become resistance. Moreover, the price is capped on the topside by the 200EMA. We also have the bearish crossover on the MACD.
I expect the price to move down over the coming days.

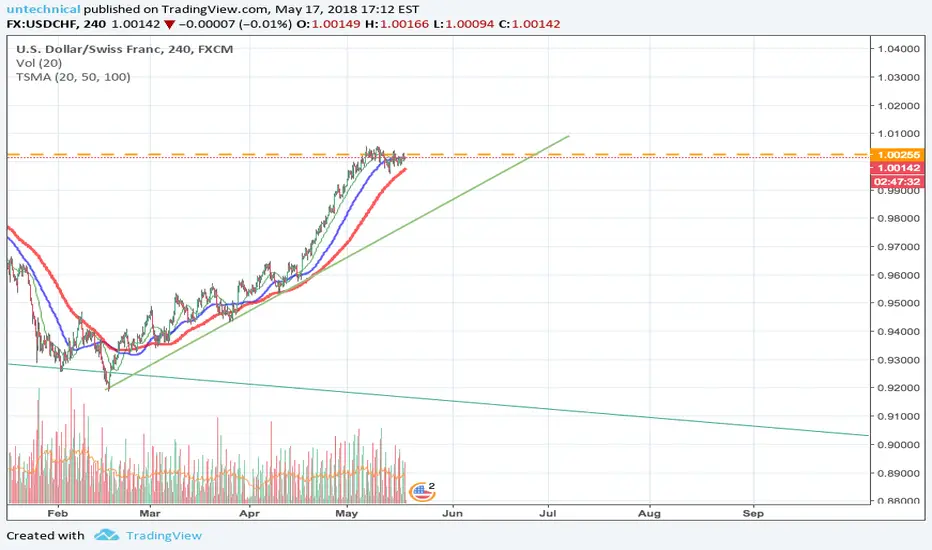
Short after rejecting the SMA50 tSince chart doesn't look very bearish, or at least I can't see clear downtrend, I will try some short-term trade.
If the chart will reject SMA50 I will open short position and keep it until price will be about 0.989. I will put stop-loss above 0.998.
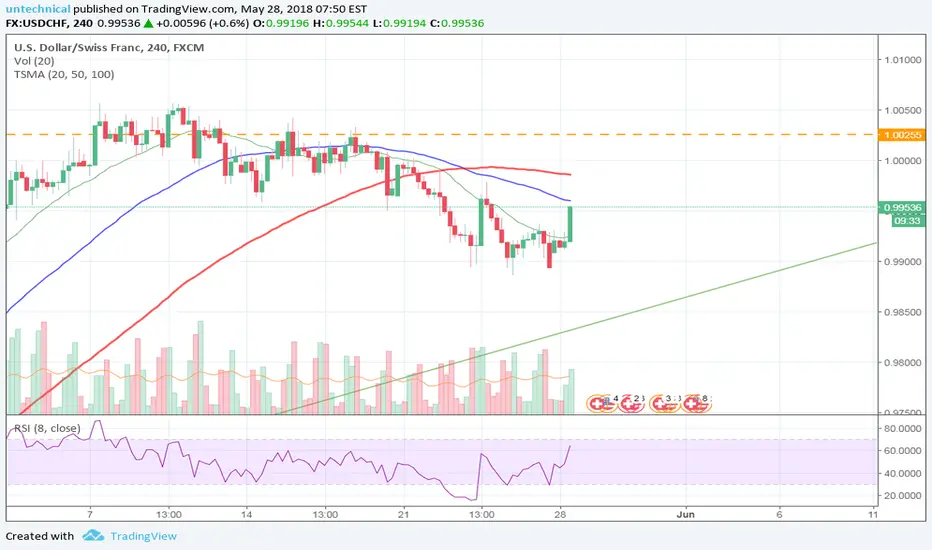
USD/CHF 4H Chart: Medium term declineThe US Dollar has been declining against the Swiss Franc in May. The decline began after the currency exchange rate met with the upper trend line of a dominant ascending channel up. Moreover, the reversal occurred just as the rate reached above the psychological 1.00 mark.
In the aftermath of the bounce off from the resistance, the currency exchange rate traded almost sideways. However, most recently the rate booked a point of reference, which provided the chance to mark a descending channel pattern.
The pattern is set to guide the rate to the lower trend line of the dominant channel. Although, that does not mean that the rate should be shorted, as the dominant support could be reached by trading sideways.

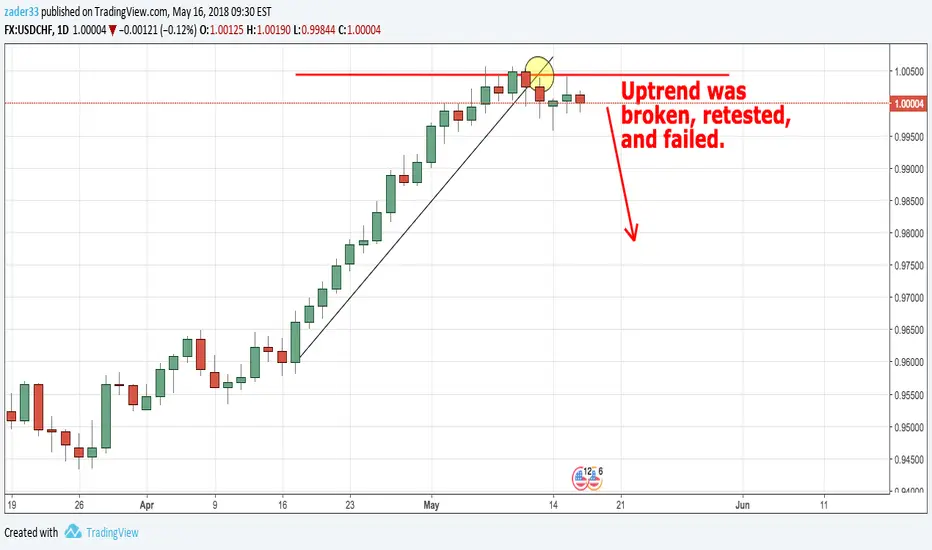
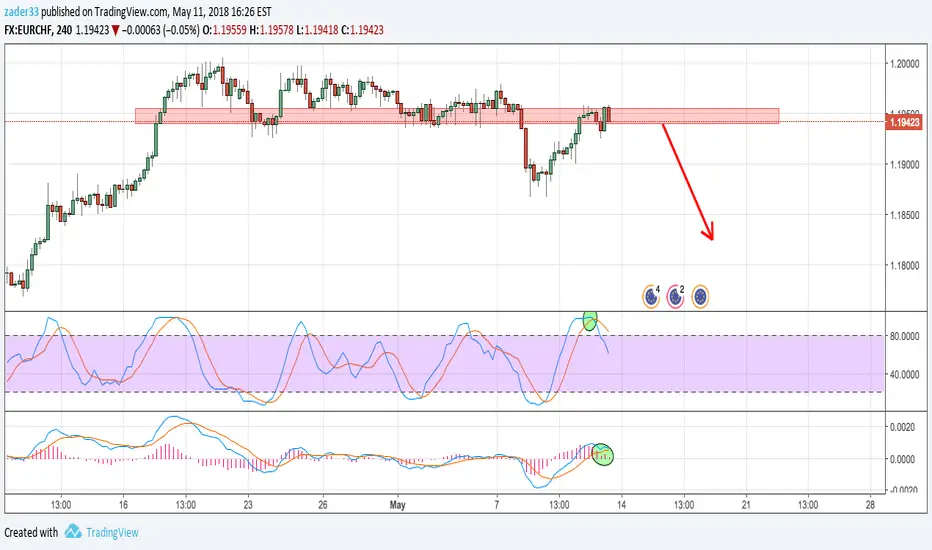
USDCHF ShortThe USDCHF rally has now been exhausted. The uptrend was broken, retested, and failed as demonstrated on the markup. Moreover, the RSI has now begun to roll over from the severely overbought (70+) region and a bearish crossover on the MACD (12,26,9) occurred on May 11, 2018. The Franc was also oversold across the board and I believe the stars have aligned of sorts to go long on the Franc at least in the mid-term.
Thank you for looking and as always, please share your feedback below. Thank you!
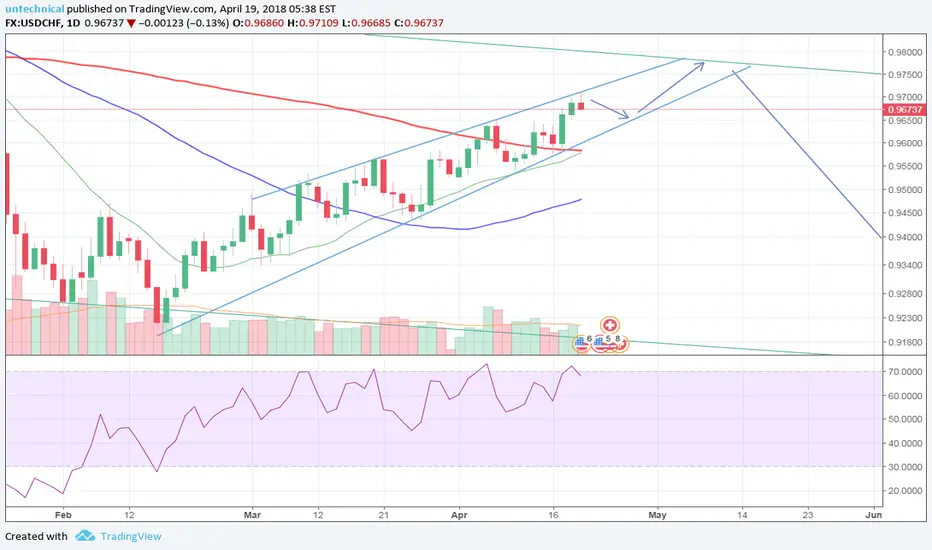
USDCHF - lets try short againUSDCHF price is high, so it is good time to look for short opportunity. Previously I unsuccessfully tried short at channel top, but market went up so I had to close my position. Right now I think it's great place to try short again, because chart is fighting with resistance zone.
My target is somewhere about short term uptrend line. I will set stop-loss few pips above local top.
EURCHF ShortThe MACD settings are 6, 13, closed, 9. The Stochastic RSI settings: LengthRSI 9, LengthStoch 9, SmoothK 6, and SmoothD 6.
As we can see, the settings are pinpoint accurate with StochRSI oscillator leading they way and the MACD confirming the trade once the crossover has taken place on the StochRSI. Based on my analysis, it would be a good idea to continue to go short on this pair.
Moreover, there is an inside bar pattern that formed on the weekly chart over the last two weeks. Having taken in to account all of those factors, shorts on EURCHF would be the best way to go.
Please leave your feedback below. And as always, thank you for looking and good luck!
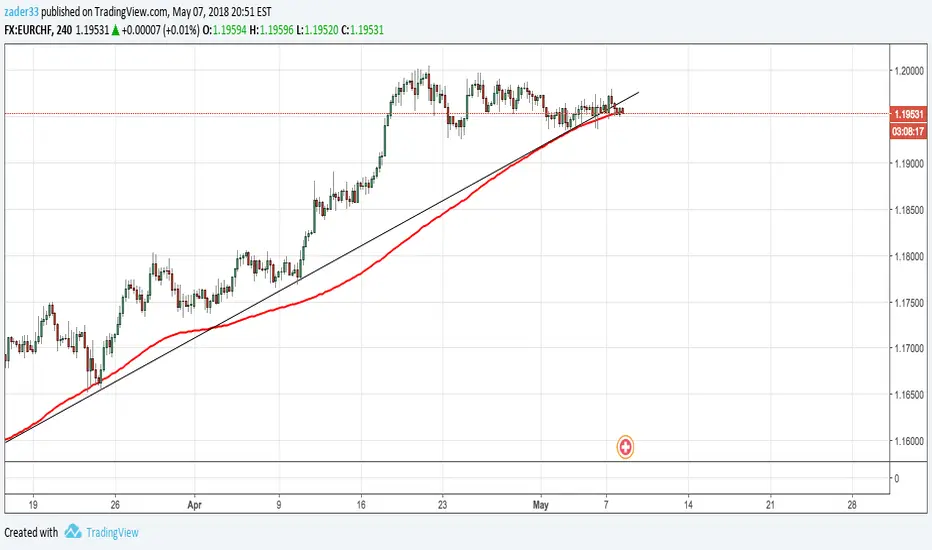
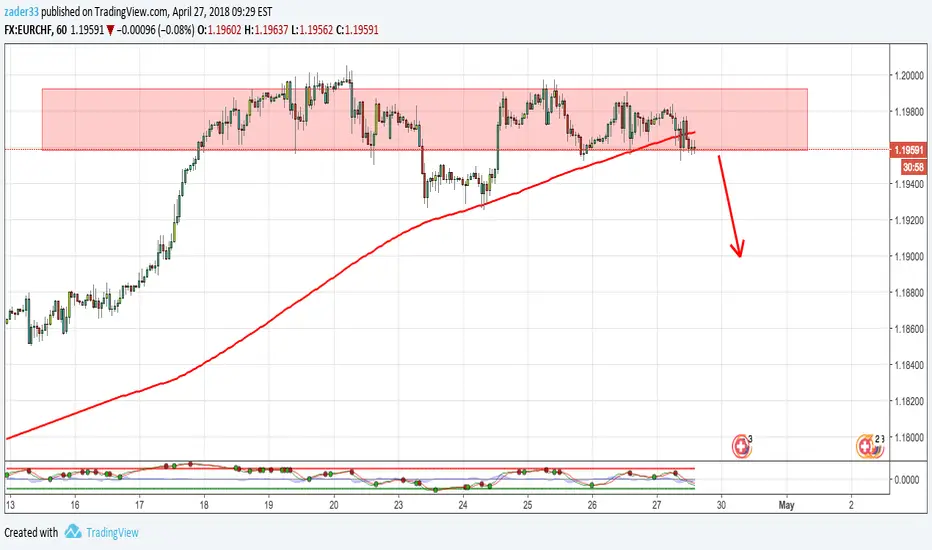
EURCHF ShortThis pair has finally broken it's uptrend that it began on March 2, 2018. Moreover, we have a bearish divergence crossover on the MACD (settings 12, 26, 9) on the daily chart as well that occurred on April 27, 2018. With bearish pressure mounting, it is only time before we have a 4H close below the 50MAV and an acceleration downwards.
Please comment your views below.
Thank you for looking and best of luck trading!
EURCHF ShortThis pair has finally broken its uptrend. It dropped significantly early in the week but bounced from the 200MAV on H1 and bulls were able to recover. But with poor data from the Eurozone and the ECB staying pat on future monetary policy, the Euro has been sold off across the board. We've now had multiple closes below 200MAV on H1 so it is now safe to short this pair.
Good luck to all and please feel free to comment your thoughts below.
Thanks!
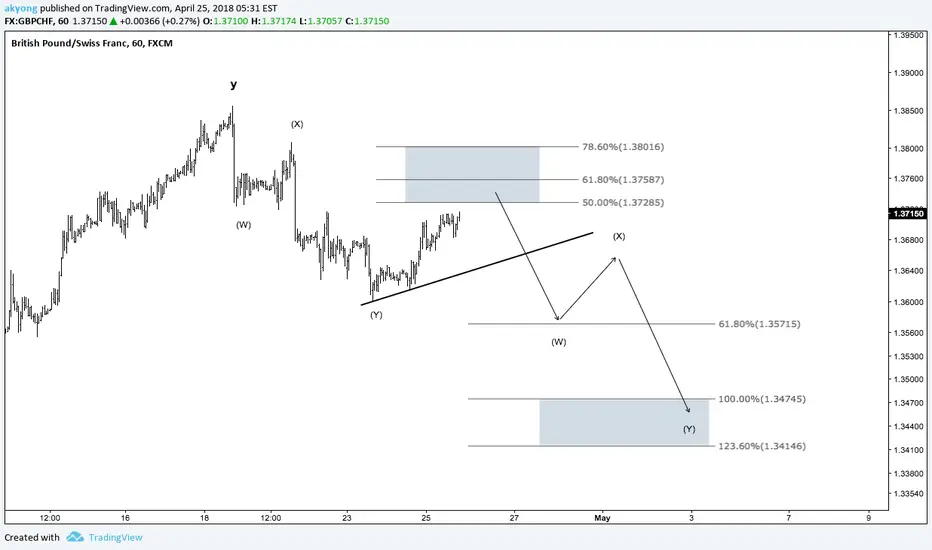
GBPCHF - Trading the next 3-wave downPrice made an initial 3-wave structure and is currently correcting the (x) leg.
We are expecting another 3-wave structure to the downside.
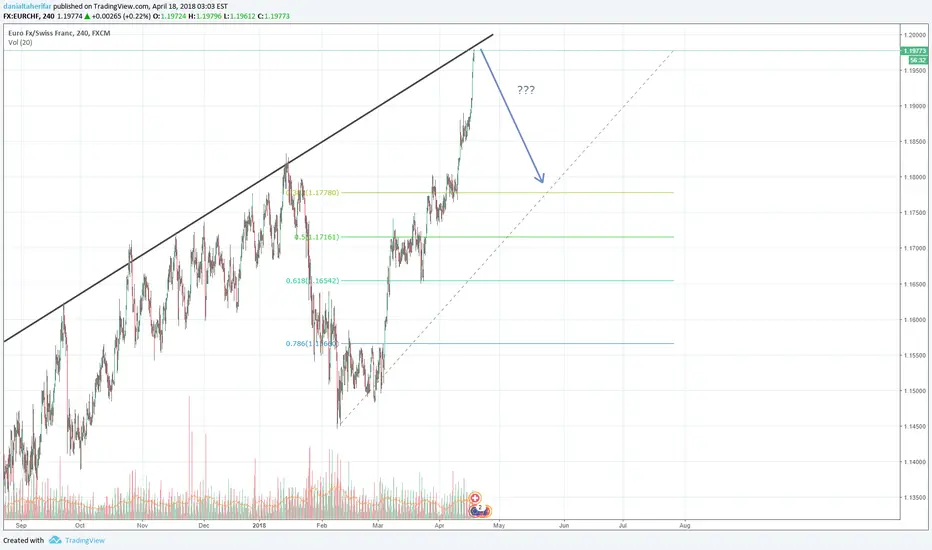
Ready for 200 pip ?EURCHF is complicated pair
but i think that can start a down trend or Major Retracement
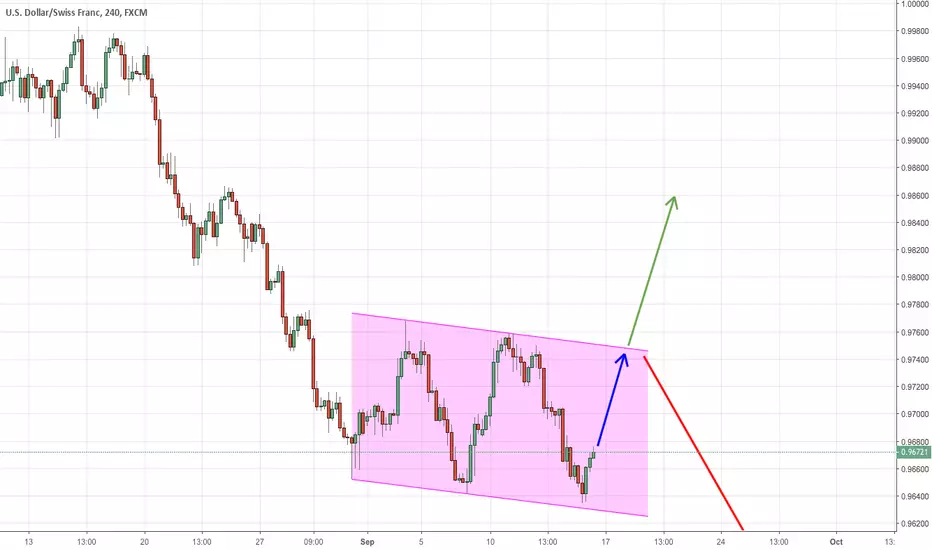
USDCHF chart updateOur long is doing great. I hope we will reach top of our mid-term channel soon.
As you can see on this chart, we are at the top of our short-term channel, so I guess market will go little bit down. If it will reach short-term channel bottom it will be great opportunity to build bigger long position.
This chart is related to my previous analysis. Click below image to check it: