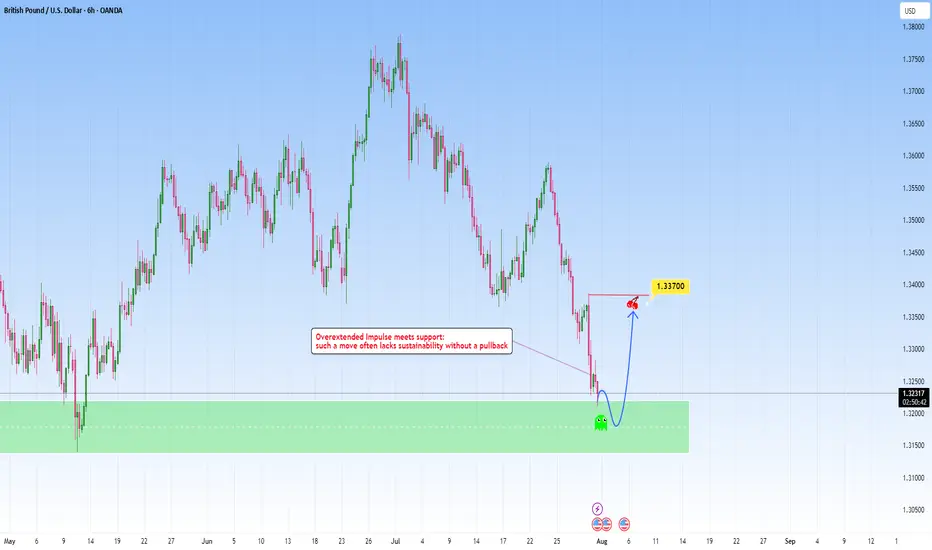
GBPUSD: Overextended move meets with supportAfter a steep and aggressive sell-off, price has tapped into a clear zone. This recent move wasn't gradual: it was impulsive and sharp, which tells us one key thing: exhaustion is likely.
The overextension into it without any meaningful pullback typically highlights imbalance, where price moves ahead of structure and becomes vulnerable to correction. But price doesn’t move in straight lines forever. Markets that fall too quickly tend to burn out just as fast. When such aggressive pushes meet with a clean, resistance like this one, they often trigger the exact opposite, a snapback correction.
I am now watching for signs of absorption and accumulation. This could play out in the form of sideways candles, wick rejections, or a sudden reversal spike. These are early signs that smart money might be stepping in.
My projected target would be toward the 1.33700 area, from the last impulsive drop. It’s a classic mean reversion setup, not just technical but psychological. Traders who chased the move late may find themselves trapped, fueling the correction as they’re forced to exit.
Freesignals
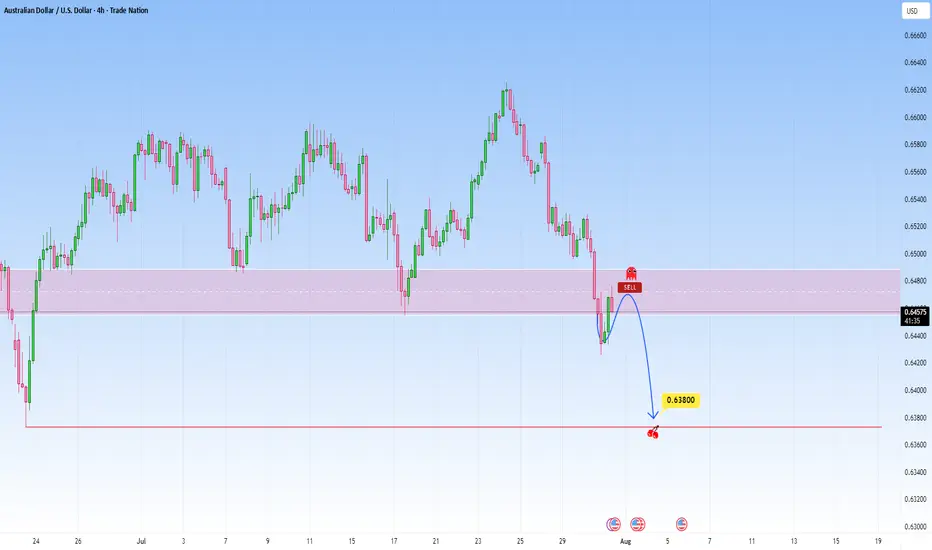
AUDUSD: Bearish Continuation from broken supportThe current setup is a clean example of a trend continuation play. Price recently broke decisively below a structure zone, this break and retest now flips the narrative, what once was a buy zone is now an opportunity for short entries.
Following the aggressive move down, price now began pulling back into that broken zone. The move appears corrective rather than impulsive, characterized by a slower, more rounded structure typical of pullback leg. This is classic behavior in continuation setups: fast drop, slow retrace, and then potential for the next leg lower.
The projected move targets a retest of the swing low at 0.63800. That level is significant, it's a level where prior demand reacted strongly and now it serves as the next probable magnet for price.
What makes this continuation trade high probability is the sharpness of the prior bearish impulse as it signals intent. The market seems to be in a controlled bearish sequence, where sellers dominate momentum and retracements offer fresh entries for trend followers.
The structure and zone alignment all point in the same direction continuation lower, not reversal.
Let me know in the comments what you think
Disclosure: I am part of Trade Nation's Influencer program and receive a monthly fee for using their TradingView charts in my analysis.
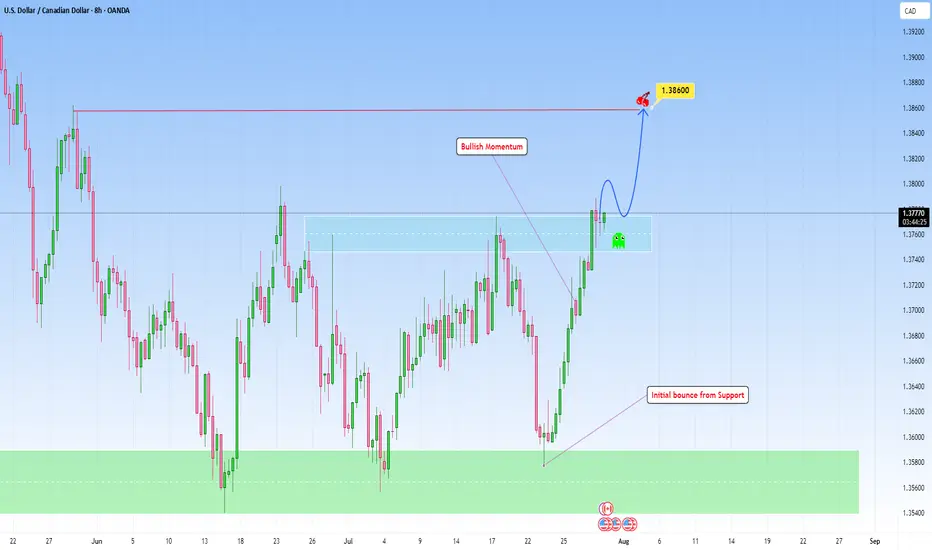
USDCAD bounced from Support and can continue higherLooking at the chart and the overall structure, I think we can favor the continuation setup with a emphasis on price action at key zones, particularly when price breaks out then can revisit this structure for a retest.
This bounce off support has been accomplished in my previous analysis:
Here, if price breaks with strength and dips back into the area and holds with bullish confirmation (likely a wick rejection or bullish engulfing on lower timeframes), that would be the cue to get in.
I am projecting the next target to 1.38600 that makes sense as a logical level for trend continuation and that I find achievable.
SUPER BUY GOLD XAUUSD Gold has ripped all levels of take profit and has gone up and gave us a small amount of drawdown with huge gains in return, simple trading price action and (M&Ws)
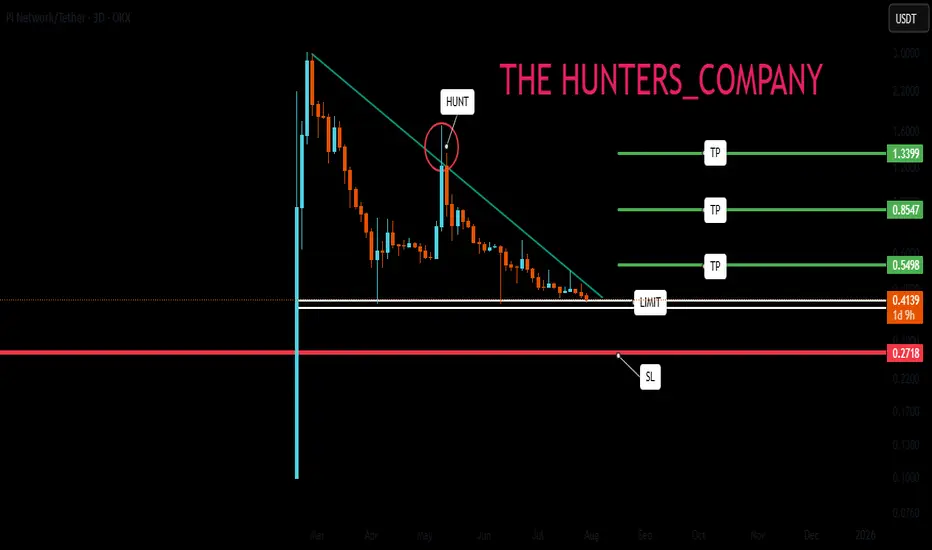
PI NETWORK : Will it finally be pumped?Hello friends🙌
👀According to the decline we had, you can see that the price has reached an important area and has formed a floor in this area. Considering the classic ego that is forming on support, you can enter the trade by breaking the resistance, of course, by managing risk and capital and moving with it to the specified goals.
🔥Follow us for more signals🔥
*Trade safely with us*
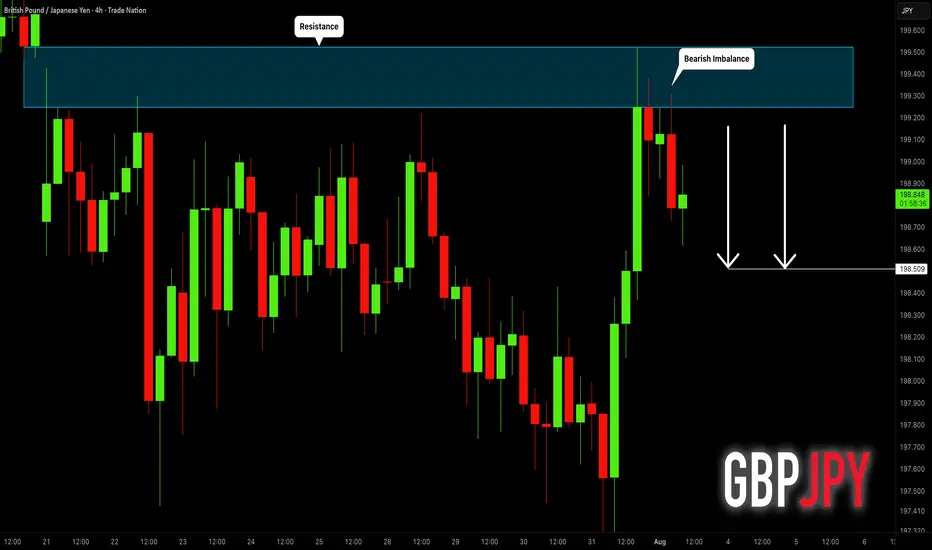
GBPJPY: Pullback From Resistance 🇬🇧🇯🇵
I think that GBPJPY will pull back from a wide
intraday supply area.
As a confirmation, I see a bearish imbalance candle that
is formed after its test.
Goal - 198.51
❤️Please, support my work with like, thank you!❤️
I am part of Trade Nation's Influencer program and receive a monthly fee for using their TradingView charts in my analysis.
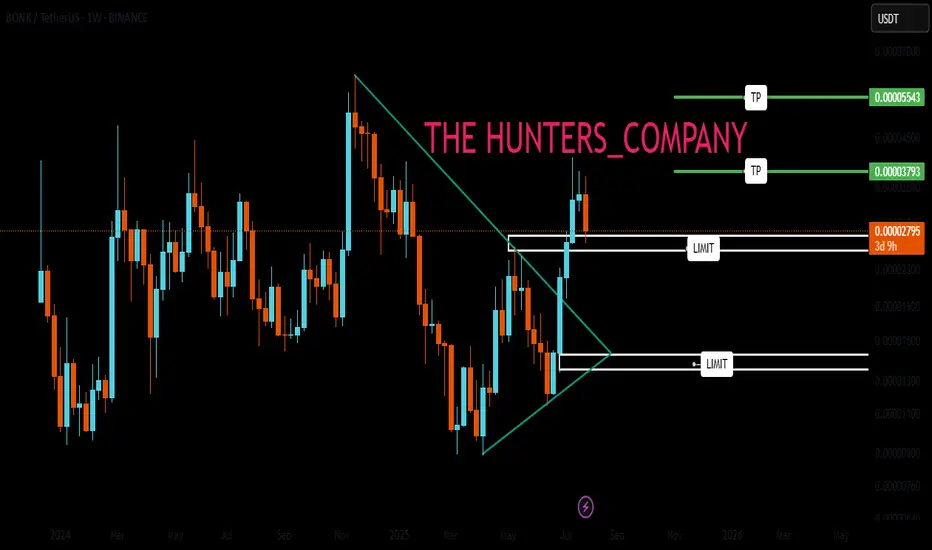
BONK : Best of luck to you...Hello friends🙌
👀Considering the decline we had, you can see that the price was supported by buyers and broke the specified resistance. Now, in the price correction, there is a good opportunity to buy with risk and capital management and in steps and be patient until the specified targets are reached.
🔥Follow us for more signals🔥
*Trade safely with us*
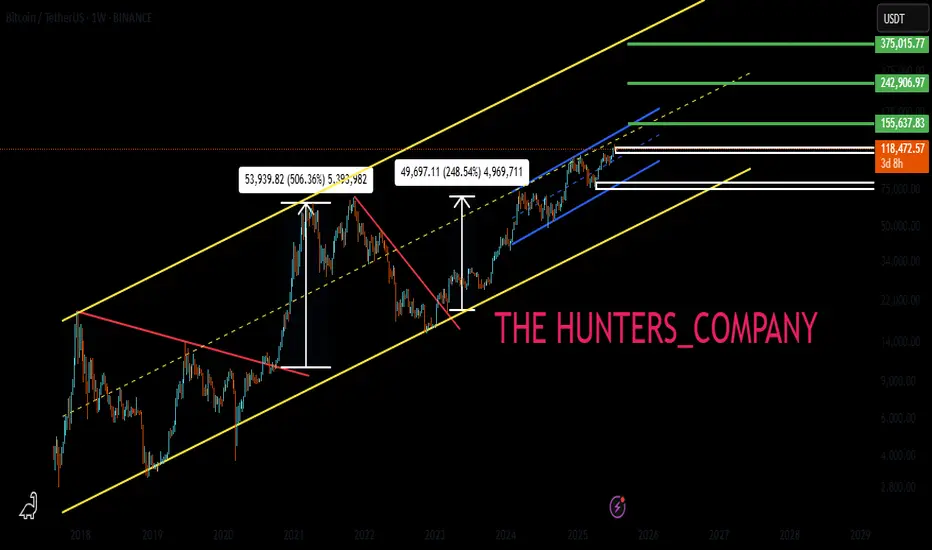
BTC : The future of Bitcoin...Hello friends🙌
👀According to the price history, the price has always been bullish and is in a long-term bullish channel.
📈Now that the price is struggling in the middle of the channel and is gathering strength for a big move, which is expected to break the middle of the channel in the form of a resistance or middle channel, the price will move to the ceiling of the channel.
⚠Don't forget risk and capital management.
🔥Follow us for more signals🔥
*Trade safely with us*
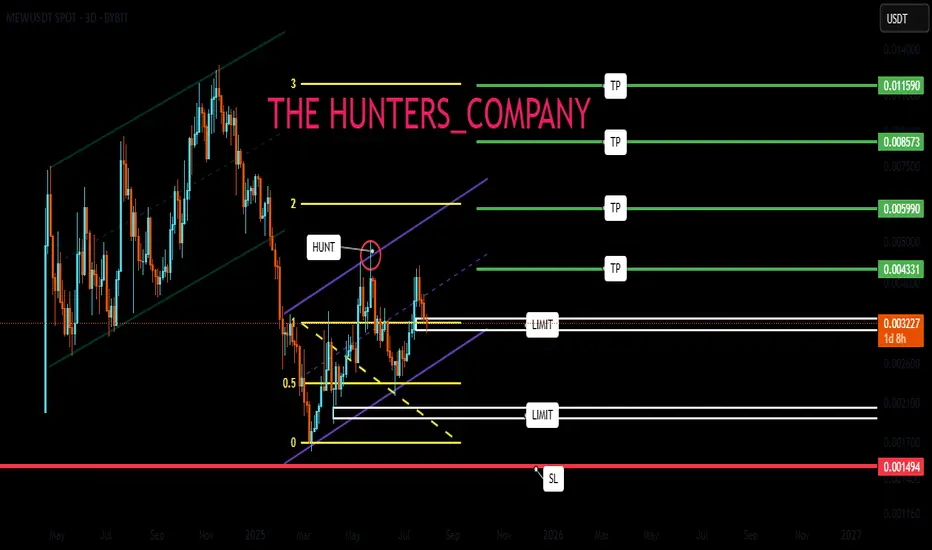
MEW : A meme coin that hasn't grown yetHello friends🙌
Given the decline we had, you can see that buyers entered the specified support area and entered the price into the ascending channel. That is why we can buy with risk and capital management and stay with it until the specified targets.
🔥Follow us for more signals🔥
*Trade safely with us*
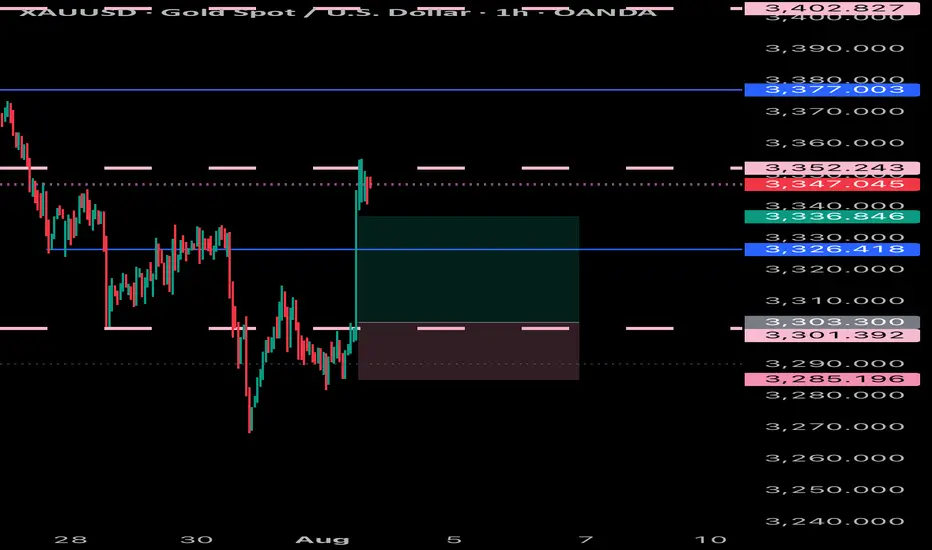
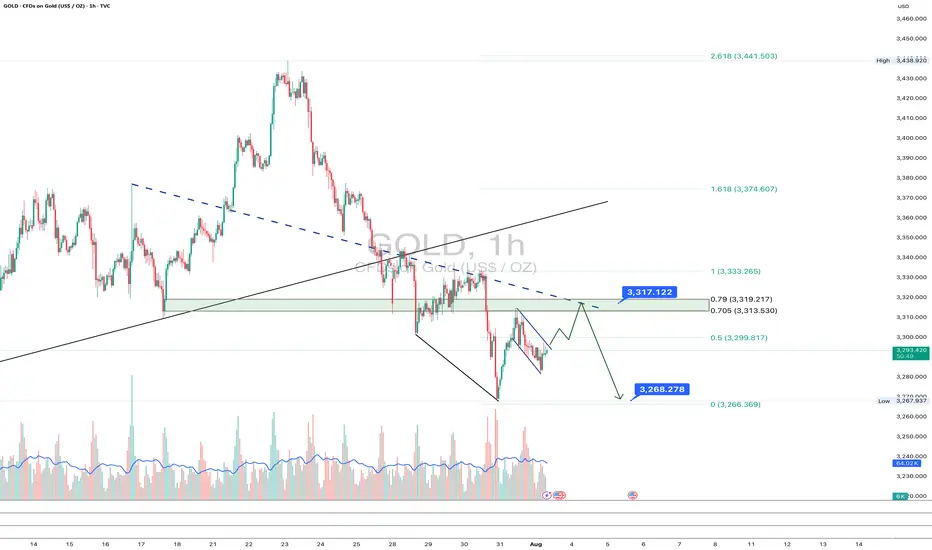
Gold: final pullback or bull trap?On the 1H chart, gold (GOLD) is forming a bullish flag after a sharp decline, which may just be a corrective move within a broader downtrend. The price is now approaching the key resistance zone around $3313–$3317 - this area holds the POC, broken trendline, and the 0.705–0.79 Fibonacci retracement from the last drop. This is the decision-making zone.
If bulls fail to push above it, we expect a move down toward $3268 - the next strong support and potential buy zone, also confirmed by Fibonacci and local demand. Stochastic divergence and slowing volume suggest a possible rebound from that level. However, if the price breaks and holds above $3317, this would indicate a local trend reversal, with targets at $3333 and $3374.
Watch the $3317 zone closely - bulls have yet to prove this is more than just a bounce.

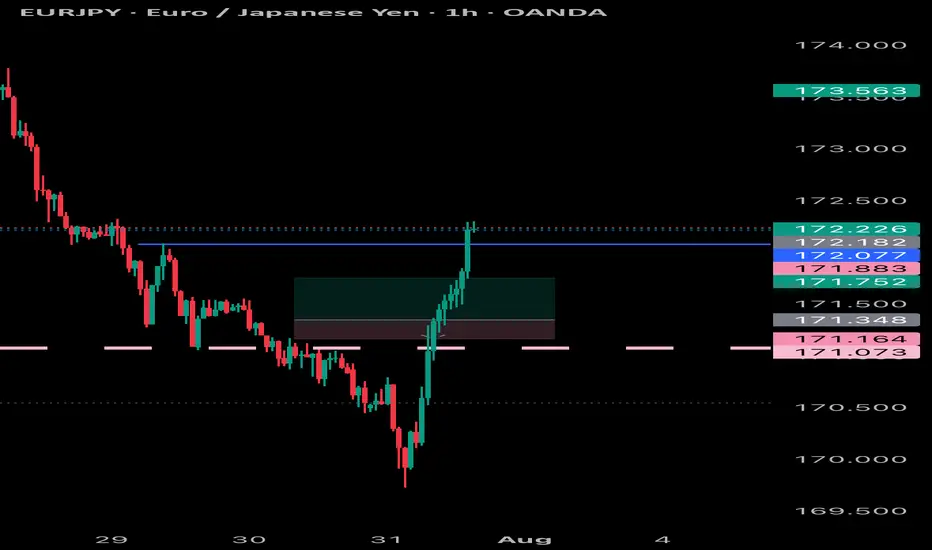
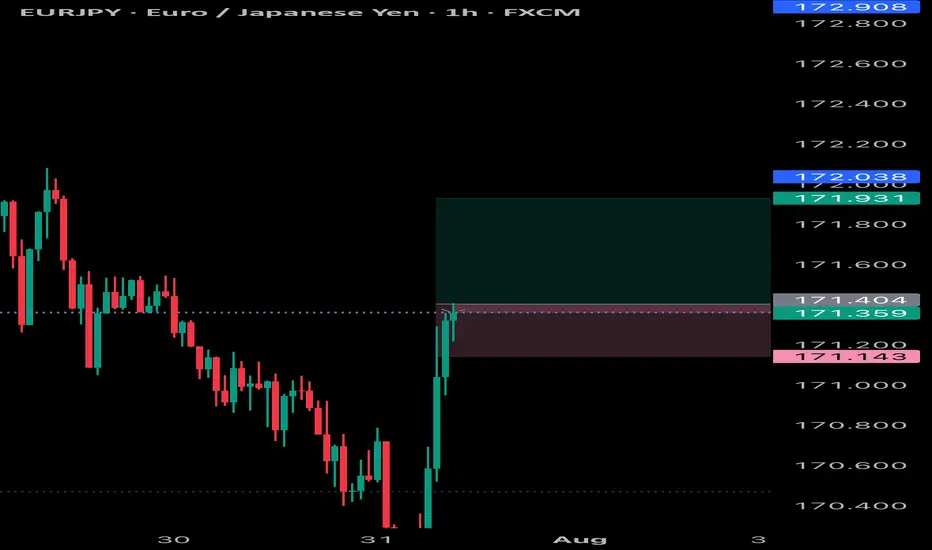
EURJPY SWEET BLUESEurjpy has hit all take profits with very little drawdown and huge profits very quickly nice pattern, simply followed

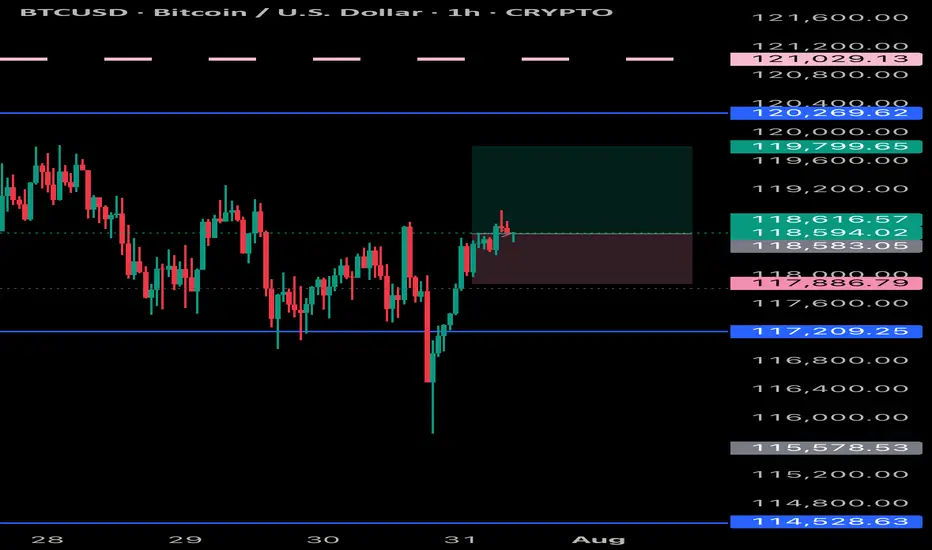
BTCUSD INCREASES Bitcoin looking to be targeting new highs and I’m simply following the trend and keeping trading simple
UP TREND EURJPYEurjpy will be buying and scalping will be moving my SL to BE or swing with it all the way to the top as it cannot sell forever
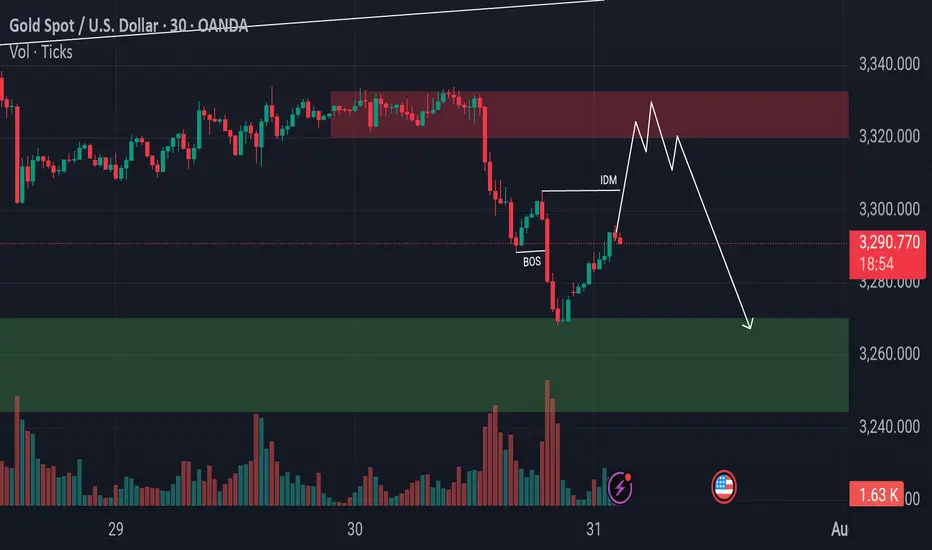
Gold Bulls Charging to 3305 But What’s Waiting There?Gold has recently taken support from the lower levels and has also shown a Break of Structure (BoS) to the downside. Currently, there is Imbalance and Internal Draw on Liquidity (IDM) resting around the 3305 level. The market appears to be moving upward to mitigate that imbalance. It's important to closely monitor this zone, as once the market reaches and fills this area, there is a high probability of a potential rejection or bearish move from that level
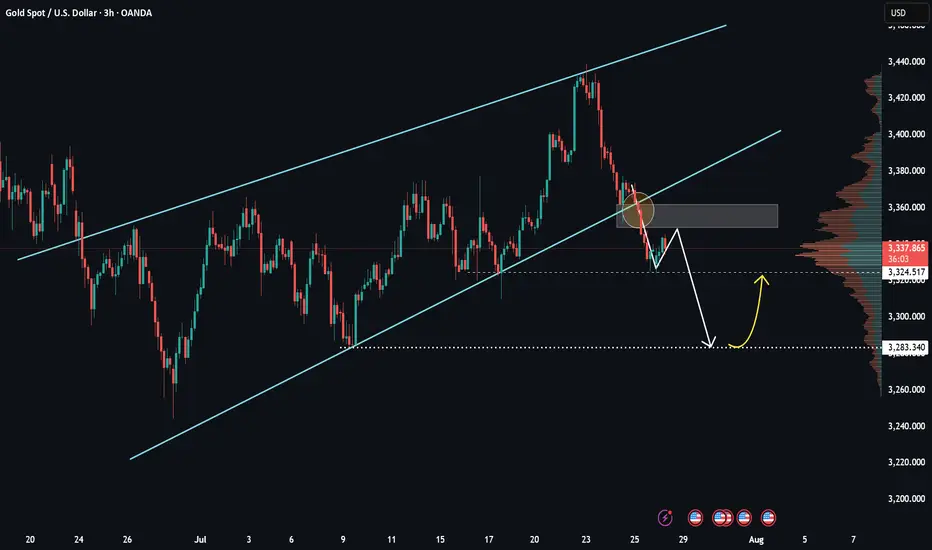
XAUUSD – Weak recovery, selling pressure still dominatesHello everyone! What do you think – is it time to buy or sell gold?
After clearly breaking the ascending trendline late last week, gold made a slight rebound from the 3,325 zone. However, in my view, this bounce was relatively weak and mostly technical in nature.
Currently, price is retesting a key confluence area around 3,345–3,355, which includes the previous trendline and a nearby resistance zone.
If we see a clear rejection candle form at this level, there's a high chance the price may reverse and continue its downward trend. The short-term target I’m watching is 3,300 USD – and if that level doesn’t hold, we could see stronger reactions near 3,283.
According to the VRVP indicator, volume is concentrated around lower price levels, suggesting that liquidity is still sitting near previous lows. Structurally, the market continues to form lower highs and lower lows, and with the EMA sloping downward, my primary bias remains to SELL on rallies within the trend.
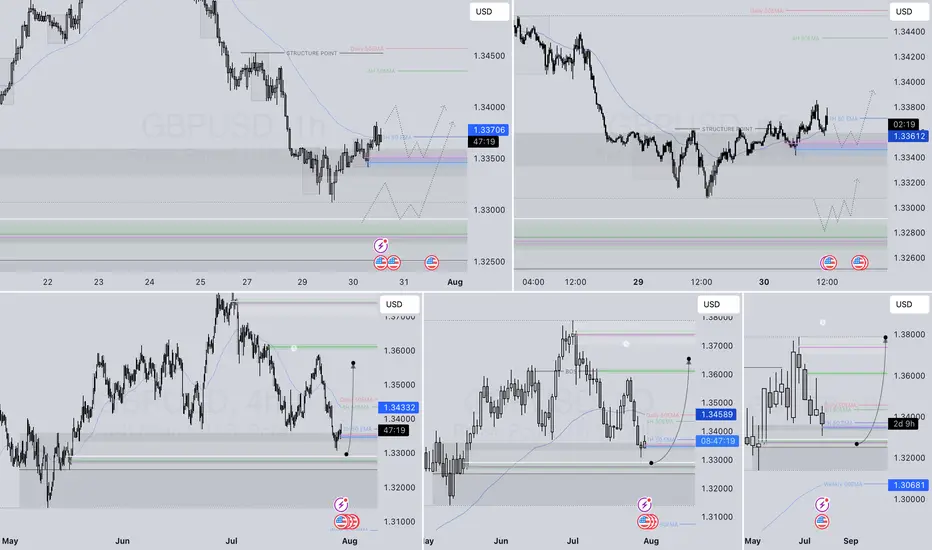
GBPUSD – DAILY FORECAST Q3 | W31 | D30 | Y25📊 GBPUSD – DAILY FORECAST
Q3 | W31 | D30 | Y25
Daily Forecast 🔍📅
Here’s a short diagnosis of the current chart setup 🧠📈
Higher time frame order blocks have been identified — these are our patient points of interest 🎯🧭.
It’s crucial to wait for a confirmed break of structure 🧱✅ before forming a directional bias.
This keeps us disciplined and aligned with what price action is truly telling us.
📈 Risk Management Protocols
🔑 Core principles:
Max 1% risk per trade
Only execute at pre-identified levels
Use alerts, not emotion
Stick to your RR plan — minimum 1:2
🧠 You’re not paid for how many trades you take, you’re paid for how well you manage risk.
🧠 Weekly FRGNT Insight
"Trade what the market gives, not what your ego wants."
Stay mechanical. Stay focused. Let the probabilities work.
FX:GBPUSD
AUDUSD – DAILY FORECAST Q3 | W31 | D30 | Y25📊 AUDUSD – DAILY FORECAST
Q3 | W31 | D30 | Y25
Daily Forecast 🔍📅
Here’s a short diagnosis of the current chart setup 🧠📈
Higher time frame order blocks have been identified — these are our patient points of interest 🎯🧭.
It’s crucial to wait for a confirmed break of structure 🧱✅ before forming a directional bias.
This keeps us disciplined and aligned with what price action is truly telling us.
📈 Risk Management Protocols
🔑 Core principles:
Max 1% risk per trade
Only execute at pre-identified levels
Use alerts, not emotion
Stick to your RR plan — minimum 1:2
🧠 You’re not paid for how many trades you take, you’re paid for how well you manage risk.
🧠 Weekly FRGNT Insight
"Trade what the market gives, not what your ego wants."
Stay mechanical. Stay focused. Let the probabilities work.
FX:AUDUSD

USDJPY – DAILY FORECAST Q3 | W31 | D30 | Y25📊 USDJPY – DAILY FORECAST
Q3 | W31 | D30 | Y25
Daily Forecast 🔍📅
Here’s a short diagnosis of the current chart setup 🧠📈
Higher time frame order blocks have been identified — these are our patient points of interest 🎯🧭.
It’s crucial to wait for a confirmed break of structure 🧱✅ before forming a directional bias.
This keeps us disciplined and aligned with what price action is truly telling us.
📈 Risk Management Protocols
🔑 Core principles:
Max 1% risk per trade
Only execute at pre-identified levels
Use alerts, not emotion
Stick to your RR plan — minimum 1:2
🧠 You’re not paid for how many trades you take, you’re paid for how well you manage risk.
🧠 Weekly FRGNT Insight
"Trade what the market gives, not what your ego wants."
Stay mechanical. Stay focused. Let the probabilities work.
FX:USDJPY

AUDCAD – DAILY FORECAST Q3 | W31 | D30 | Y25
📊 AUDCAD – DAILY FORECAST
Q3 | W31 | D30 | Y25
Daily Forecast 🔍📅
Here’s a short diagnosis of the current chart setup 🧠📈
Higher time frame order blocks have been identified — these are our patient points of interest 🎯🧭.
It’s crucial to wait for a confirmed break of structure 🧱✅ before forming a directional bias.
This keeps us disciplined and aligned with what price action is truly telling us.
📈 Risk Management Protocols
🔑 Core principles:
Max 1% risk per trade
Only execute at pre-identified levels
Use alerts, not emotion
Stick to your RR plan — minimum 1:2
🧠 You’re not paid for how many trades you take, you’re paid for how well you manage risk.
🧠 Weekly FRGNT Insight
"Trade what the market gives, not what your ego wants."
Stay mechanical. Stay focused. Let the probabilities work.
FX:AUDCAD

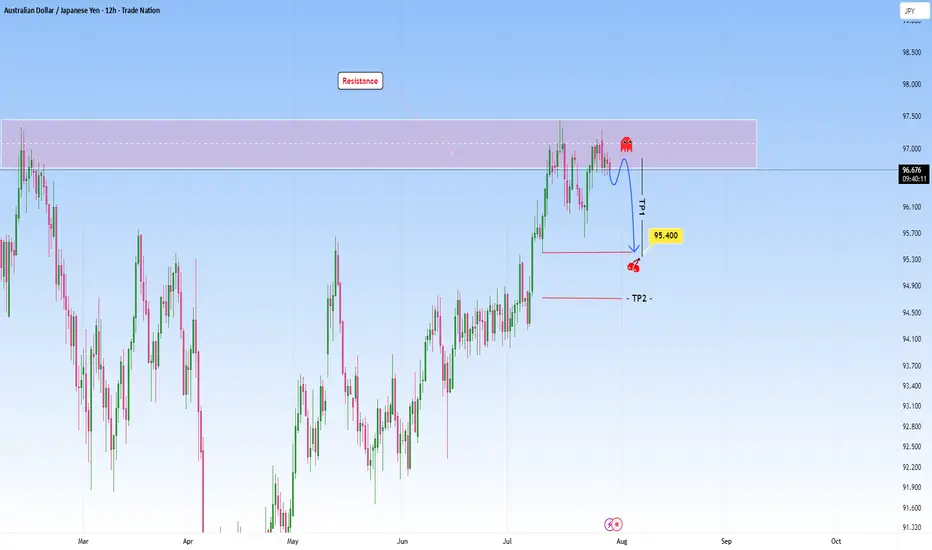
AUDJPY at Resistance: Could we see a reversal here?The market on this pair shows us a classic scenario where price presses into a resistance zone after a sustained bullish move. Price action approaching this zone appears hesitant, with smaller candles and wicks showing signs of exhaustion, meaning the possibility that buying momentum is weakening. There is a clear intention in this structure and I am anticipating a reversal here.
My first target (TP1) at 95.400 is placed just above a previous structure low and it’s a logical level for a partial exit, as price may pause or react there. The second target (TP2), placed even lower, hints at a full mean reversion idea targeting the origin of the previous bullish leg.
The setup requires patience, waiting for confirmation perhaps in the form of a strong bearish rejection before committing to the short. Overall, it’s a disciplined setup that mirrors the kind of analysis I like to gravitate toward: structured, simple and driven by high probability reversal zones.
Disclosure: I am part of Trade Nation's Influencer program and receive a monthly fee for using their TradingView charts in my analysis.
AUDJPY – DAILY FORECAST Q3 | W31 | D30 | Y25
📊 AUDJPY – DAILY FORECAST
Q3 | W31 | D30 | Y25
Daily Forecast 🔍📅
Here’s a short diagnosis of the current chart setup 🧠📈
Higher time frame order blocks have been identified — these are our patient points of interest 🎯🧭.
It’s crucial to wait for a confirmed break of structure 🧱✅ before forming a directional bias.
This keeps us disciplined and aligned with what price action is truly telling us.
📈 Risk Management Protocols
🔑 Core principles:
Max 1% risk per trade
Only execute at pre-identified levels
Use alerts, not emotion
Stick to your RR plan — minimum 1:2
🧠 You’re not paid for how many trades you take, you’re paid for how well you manage risk.
🧠 Weekly FRGNT Insight
"Trade what the market gives, not what your ego wants."
Stay mechanical. Stay focused. Let the probabilities work.
FX:AUDJPY
