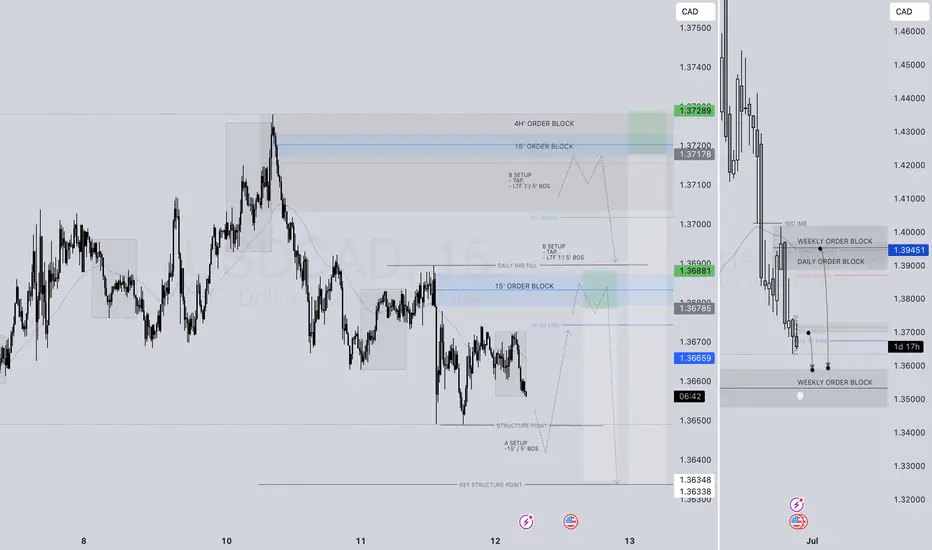
USDCAD SHORT FORECAST Q2 W24 D12 Y25USDCAD SHORT FORECAST Q2 W24 D12 Y25
Professional Risk Managers👋
Welcome back to another FRGNT chart update📈
Diving into some Forex setups using predominantly higher time frame order blocks alongside confirmation breaks of structure.
💡Here are some trade confluences📝
✅4H order block rejection
✅HTF 50 EMA
✅Intraday bearish breaks of structure to be identified
✅15’ order block identified
🔑 Remember, to participate in trading comes always with a degree of risk, therefore as professional risk managers it remains vital that we stick to our risk management plan as well as our trading strategies.
📈The rest, we leave to the balance of probabilities.
💡Fail to plan. Plan to fail.
🏆It has always been that simple.
❤️Good luck with your trading journey, I shall see you at the very top.
🎯Trade consistent, FRGNT X
Freesignals
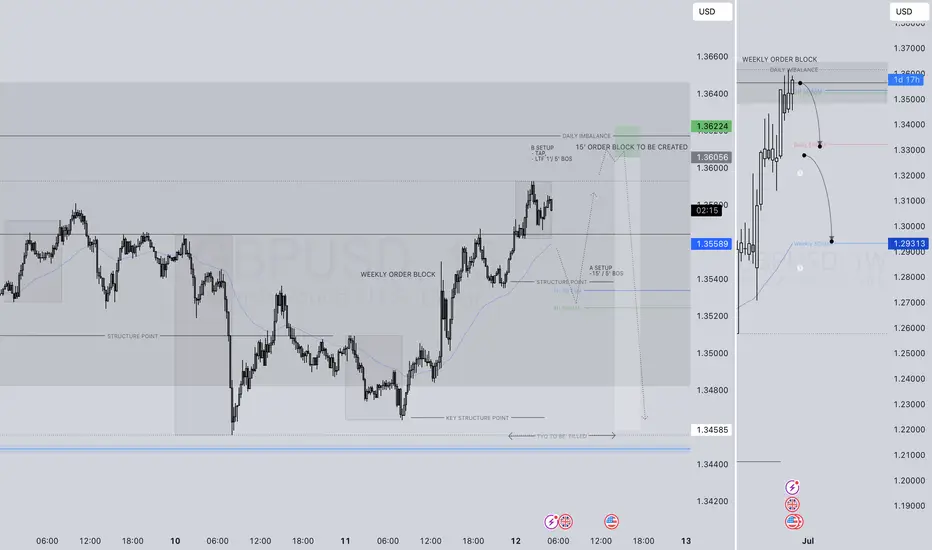
GBPUSD SHORT FORECAST Q2 W24 D12 Y25GBPUSD SHORT FORECAST Q2 W24 D12 Y25
Professional Risk Managers👋
Welcome back to another FRGNT chart update📈
Diving into some Forex setups using predominantly higher time frame order blocks alongside confirmation breaks of structure.
Let’s see what price action is telling us today!
💡Here are some trade confluences📝
✅Weekly order block
✅15' order block
✅Intraday 15' break of structure
✅Tokyo ranges to be filled
🔑 Remember, to participate in trading comes always with a degree of risk, therefore as professional risk managers it remains vital that we stick to our risk management plan as well as our trading strategies.
📈The rest, we leave to the balance of probabilities.
💡Fail to plan. Plan to fail.
🏆It has always been that simple.
❤️Good luck with your trading journey, I shall see you at the very top.
🎯Trade consistent, FRGNT X
BTCUSDT – Bearish signs emerge below resistanceAfter a strong bullish run, BTCUSDT is now showing clear signs of weakness near the resistance zone around 109,600–112,000. Price action has formed a cluster of rejection candles at the top, failing to break above this key level – signaling that selling pressure is gaining control.
The current structure suggests a potential trend reversal, especially as the latest bearish candle came with rising volume, confirming selling interest from the supply zone. If the price breaks below the 101,500 support, BTC may continue dropping toward the 93,500–84,500 range – a high-liquidity area on the volume profile.
The previous bullish momentum appears to have lost strength, and this pullback may be confirming a shift after reaching its upper limit. As long as BTC remains below the 112,000 resistance, the bearish bias remains dominant.

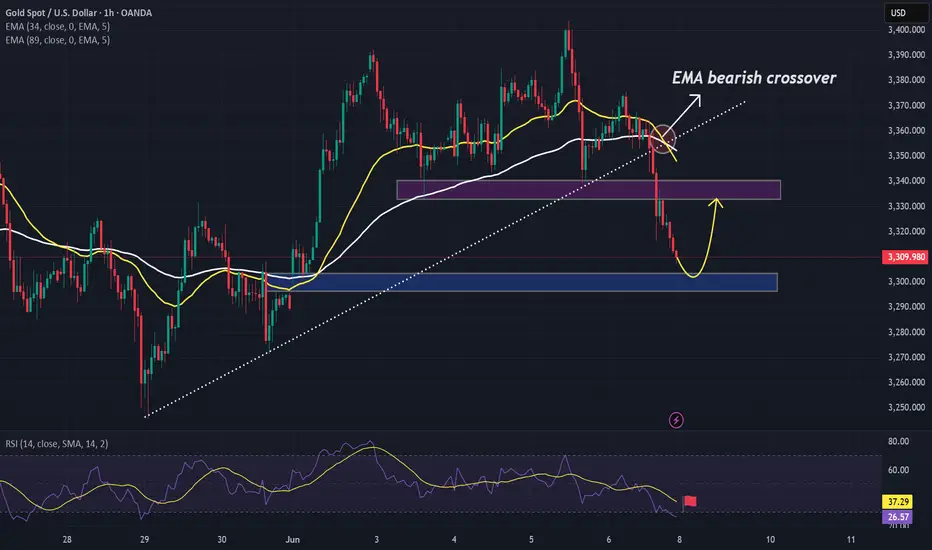
Will gold continue its uptrend from the 3,300 USD level?Hello dear traders!
Gold prices continued to decline against the US Dollar (USD) on Friday, falling below the previous psychological support level, which is now resistance, at 3,350 USD. The main reason was that the US Dollar gained some positive momentum as the market leaned toward the Fed maintaining its current policy in July following the May report, causing XAUUSD to move lower into the weekend.
From a technical perspective, as previously analyzed, gold broke below the psychological support level of 3,350 USD on Friday, with prices approaching the 3,300 USD support level at the time of writing. However, the RSI has dropped to the 30 level, indicating that selling pressure may be losing momentum, and global economic stress could potentially limit further losses.
Crypto Signal TodayHello friends🙌
Given the buyers' support for the price and their entry, you can buy in steps in the specified areas with capital and risk management and move to the specified targets📈
Follow us for more signals😉
*Trade safely with us*
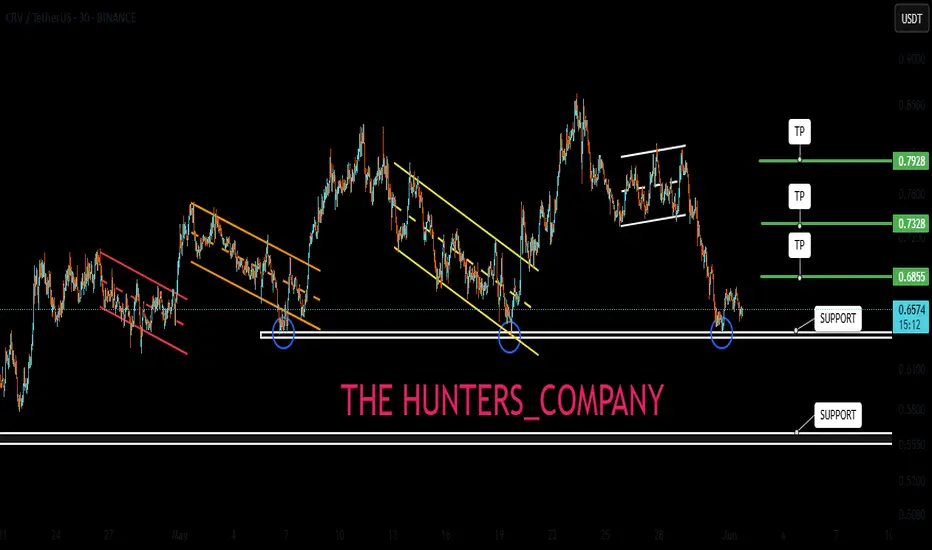
Maintaining support is necessary, not essential, for the climb.Hello friends🙌
🔊Given the price drop, you can see that the support we identified has worked well for you so far and buyers have supported the price.
Now, given the heavy price drop and disappointment in the market, we can expect a rise until the targets are set.
Don't forget capital and risk management, friends.🙏
🔥Join us for more signals🔥
*Trade safely with us*

Today's Bitcoin Signal: Time to be braveHello friends🙌
Given the good price movement from support and buyers entering, now we can enter the position with capital and risk management and move with it to the specified targets.
🔥Join us for more signals🔥
*Trade safely with us*

USDJPY: Strong Intraday Bullish Price Action 🇺🇸🇯🇵
On the today's live stream, we discussed a very bullish setup
on USDJPY.
The price retested a recently broken horizontal resistance.
A resistance line of a falling wedge pattern was violated with
a strong bullish movement then.
We see its retest at the moment.
I think that the price will resume growth soon and reach 145.25 level.
❤️Please, support my work with like, thank you!❤️
I am part of Trade Nation's Influencer program and receive a monthly fee for using their TradingView charts in my analysis.

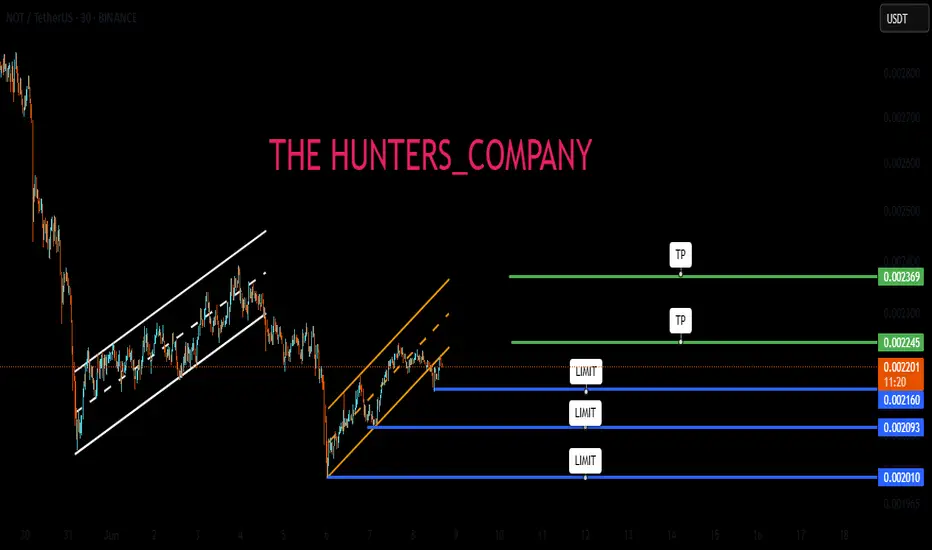
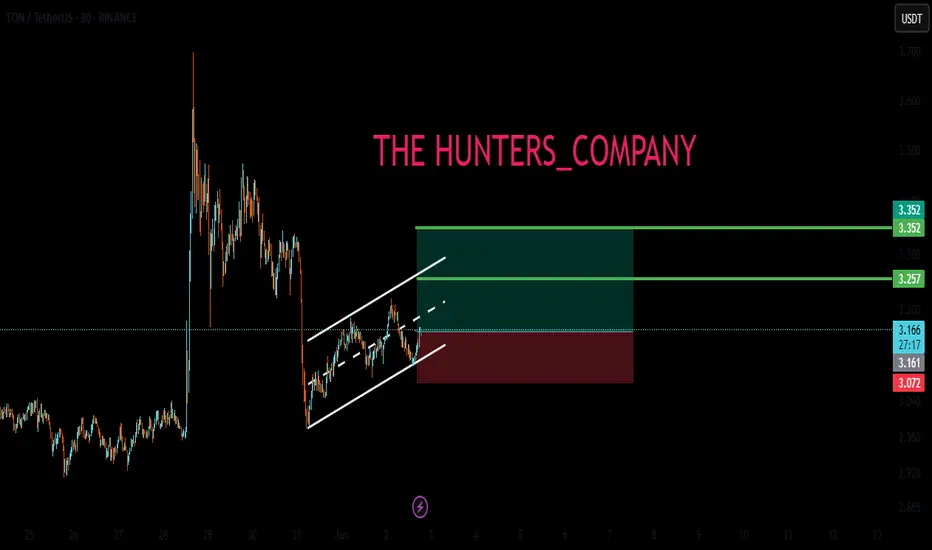
NOTcoin: Where can we buy it? I wrote to you...Hello friends🙌
🔊Considering the price drop we had, you can see that the price has finally found support, but our channel has been broken, and the indicated supports are good points for buying in steps and with capital and risk management...📈
🔥Join us for more signals🔥
*Trade safely with us*
FREE SIGNALHello friends
Given the price range that has formed and the power of buyers in case of failure, we can open a position with capital and risk management to move towards the specified goals.
*Trade safely with us*
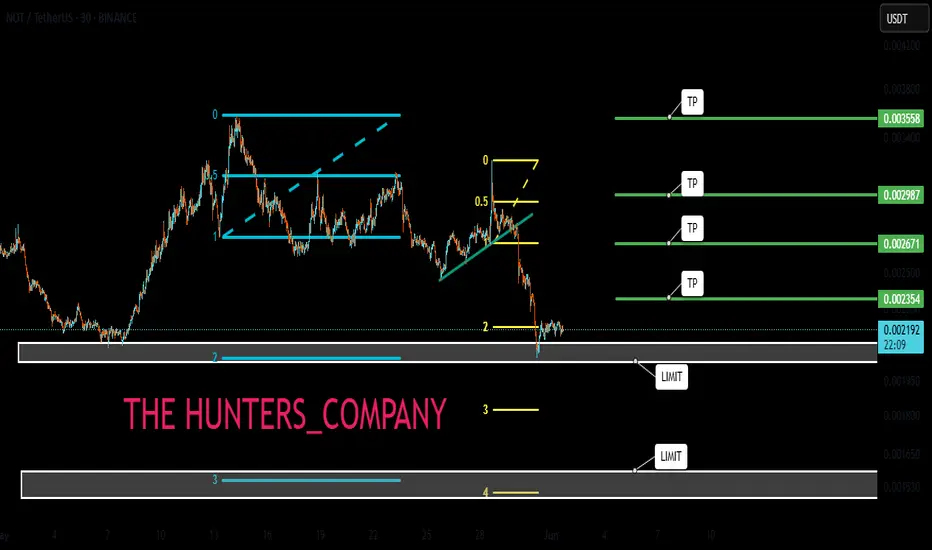
Should we buy Natcoin now or wait?Hello friends
According to the complete analysis we have done for you, we have concluded that the price has reached an important support with a deep correction that buyers were able to support the price to some extent, and if the support is broken, there is another important support that we have determined that the price can be expected to grow from there.
Our suggestion is to buy steps at important supports, of course with capital and risk management...
Targets have also been specified.
*Trade safely with us*
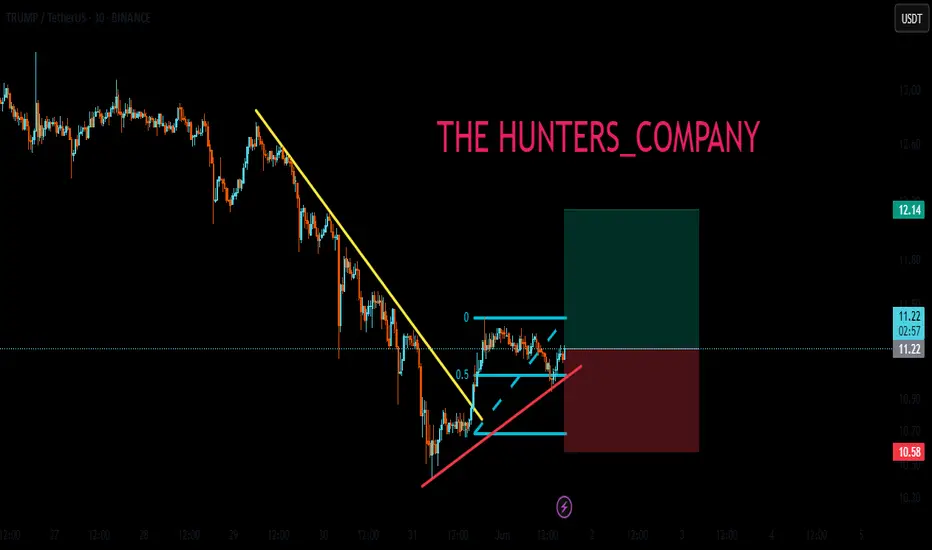
Live Trump TradeHello friends
Based on the analysis and research we have concluded that it is possible to enter into a transaction with risk and capital management, given the entry of buyers and the price pullback.
*Trade safely with us*
LIVE TRADEHello friends
Given the ascending channel that has formed, we can open positions with capital and risk management to move towards the specified goals.
*Trade safely with us*
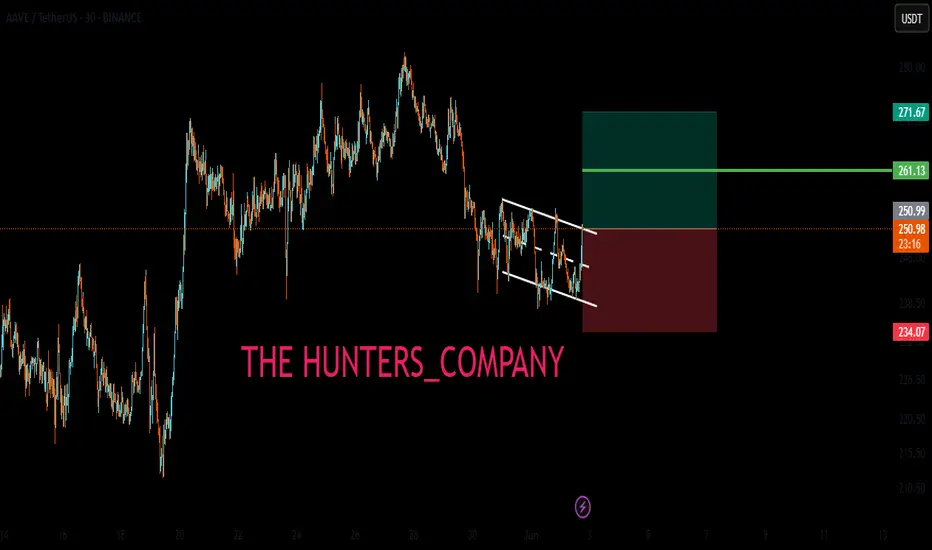
Spot signalHello friends
As the price reaches the specified support level and buyers enter, you can see that higher ceilings have formed and you can take advantage of this opportunity and now buy with capital and risk management and move towards the specified goals.
*Trade safely with us*

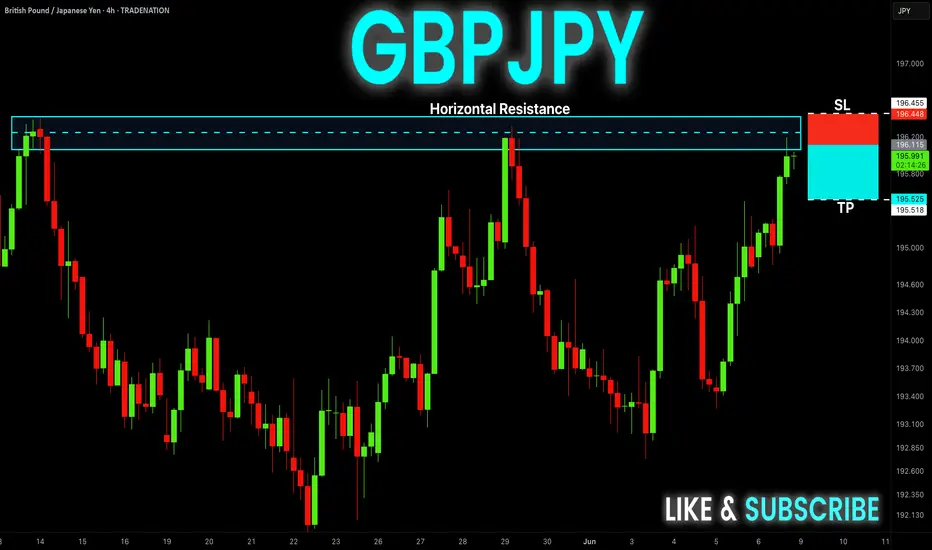
GBP-JPY Free Signal! Sell!
Hello,Traders!
GBP-JPY made a retest of
The strong horizontal resistance
Of 196.260 and the pair seems
To be locally overbought
So we will go short with
The Take Profit of 195.525
And the Stop Loss of 196.455
Sell!
Comment and subscribe to help us grow!
Check out other forecasts below too!
Disclosure: I am part of Trade Nation's Influencer program and receive a monthly fee for using their TradingView charts in my analysis.
GBPCAD SELL OPPORTUNITY 5 MIN TIMEFRAMEClear trend breakout and retest has occured. Targetting for it to hit the large imbalance on the left before going down which it did. Targetting imbalances on 5 min tf. the 30 min and 4 hr 10 and 20 EMA on downtrend too

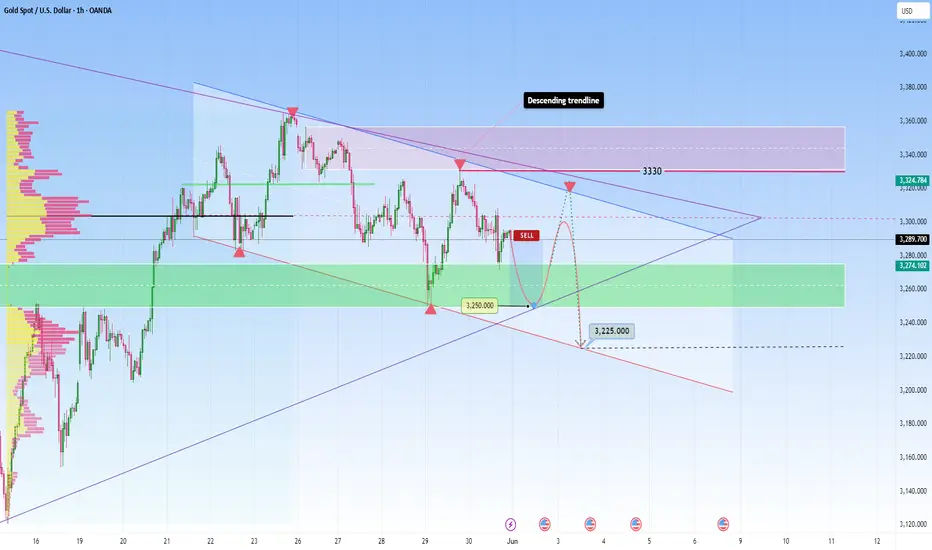
GOLD conditions seem to remain bearish: Pay attention to hintsFor now, we can see that Gold’s bullish momentum has stalled and since Friday Gold has been under pressure from 3325. Not surprisingly though, the market structure performed as expected this past week.
I believe that short-term price action in gold may remain choppy next week due to Trump’s temporary tariff measures so caution is advised.
My bias is still the same as before, I think that on Monday the market will open bearish likely pushing price lower initially.
As you can see in my previous analysis, the forecasted move played as expected:
So this being said I plan to react based on how price behaves at support of 3270-3250 on the lower side in the short term.
If price tags the support as shown on my chart, I’ll be watching for a possible rebound toward 3300. This range in particular should not be overlooked . This area aligns with the point of control, and given how price often gravitates back to high-volume zones after sharp moves, a recovery to that level would be a natural reaction.
The key point lies in how the market will open and how price will behave, as well as the overall sentiment.
Gold's next move won’t be random, there are strong confluences at play that will guide and give us hints, so it’s up to us to stay attentive.
If we were to break upside above the $3,330 level, then we can see more bullish outlook next
The other scenario, to be taking into account would be to start with a strong bullish candle and reach 3330 before a drop.
Wishing you a profitable trading weekend ahead. This is just a forecast and should not be considered financial advice.
Below the current price, several demand zones have been marked!Gold Analysis (1H Timeframe):
On the 1-hour chart, Gold has previously formed a bearish engulfing candlestick pattern, which signaled a potential reversal and has since led to a downward move in the market. At present, another bearish engulfing pattern has formed, suggesting renewed selling pressure. If the price retraces back to this level, there is a high probability that it may continue to decline from there.
Below the current price, several demand zones have been marked. These zones correspond to areas where bullish engulfing patterns have previously formed or are likely to form. These zones have been carefully filtered for quality and relevance.
The recommended approach is to patiently wait for the price to enter these demand zones. If the market provides a valid bullish confirmation signal (such as bullish candlestick formations, divergence, or volume confirmation) within these zones, it could present a high-probability buying opportunity.
> ⚠️ Disclaimer: This analysis is for educational purposes only. Always conduct your own research (DYOR) before making any trading decisions. This is not financial advice.

AUDJPY SHORT FORECAST Q2 W23 D3 Y25AUDJPY SHORT FORECAST Q2 W23 D3 Y25
Professional Risk Managers👋
Welcome back to another FRGNT chart update📈
Diving into some Forex setups using predominantly higher time frame order blocks alongside confirmation breaks of structure.
Let’s see what price action is telling us today! 👀
💡Here are some trade confluences📝
✅Weekly Order block rejection
✅15' Order block identification
✅4H 50EMA
✅Daily 50 EMA
🔑 Remember, to participate in trading comes always with a degree of risk, therefore as professional risk managers it remains vital that we stick to our risk management plan as well as our trading strategies.
📈The rest, we leave to the balance of probabilities.
💡Fail to plan. Plan to fail.
🏆It has always been that simple.
❤️Good luck with your trading journey, I shall see you at the very top.
🎯Trade consistent, FRGNT X

XAUUSD 8H: This isn’t balance — it’s broadening distributionAt first glance, it may seem like gold is consolidating. In reality, price is unfolding inside a broadening formation — a structure where highs stretch higher, lows drop deeper, and real direction vanishes behind controlled volatility. This isn’t random noise. It’s Smart Money engineering a distribution phase under the cover of market indecision. And right now, the direction is forming clearly — downward.
The key moment was the failed breakout above 3357 on May 24. Volume spiked 19% above average, but the candle body collapsed. That’s a textbook deviation — a classic liquidity grab. The next candle confirmed the failure by closing back below the level, and no bullish recovery followed. Instead, price printed a lower high around 3305–3315, failing to retest the top. And when price can’t go higher — it usually goes lower.
Confirmation comes from the Anchored VWAP from May 13, which was broken cleanly and never retested. That’s a major shift in control — from buyer to seller. Now price trades below VWAP, with every bullish candle fading and every bearish reaction gaining strength. This is not trend continuation. This is exhaustion.
Volume profile shows the Point of Control between 3297 and 3301 — and price sits well below it. The bulk of liquidity is now overhead. That zone between 3305–3315 is where Smart Money already sold once — and if price returns there, it becomes an ideal re-entry short zone, especially if followed by rejection candles or low-volume pushups.
Targets are clean:
→ 3228 — first liquidity shelf.
→ 3164 — former impulse base.
→ 3084 — if breakdown accelerates.
Everything lines up: deviation, failed breakout, VWAP lost, volume fading, lower highs forming. This isn’t a pause. This is a phase transition — and the market already voted.

Fiery support was revealed...Hello friends
According to our technical analysis and research on this currency, we were able to find important supports for you so that you can buy on those supports in stages and with capital management.
The targets are also specified...
*Trade safely with us*
Don't miss today's signal.Hello friends
Based on the extensive and comprehensive analysis we conducted, we were able to obtain the buying points and targets for this currency for you so that you can buy in stages with risk and capital management.
*Trade safely with us*

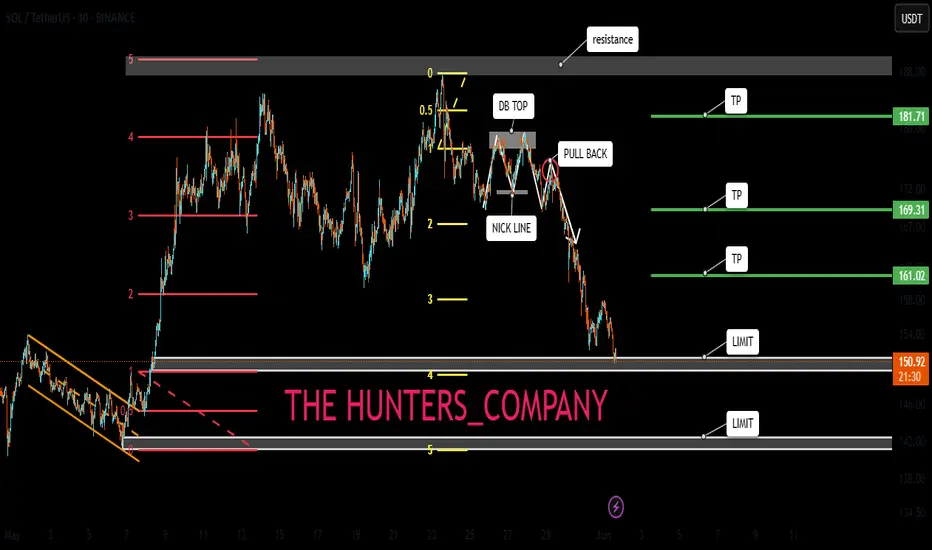
Watch out for Solana today.Hello friends
You can see that in the image we have done a complete and comprehensive analysis of Solana for you and identified points that are good supports and can be bought in the areas.
Given the deep correction we had, the market has fallen into fear and a good opportunity has been provided for buying.
The targets have also been identified.
Please observe capital management and avoid irrational risks.
*Trade safely with us*