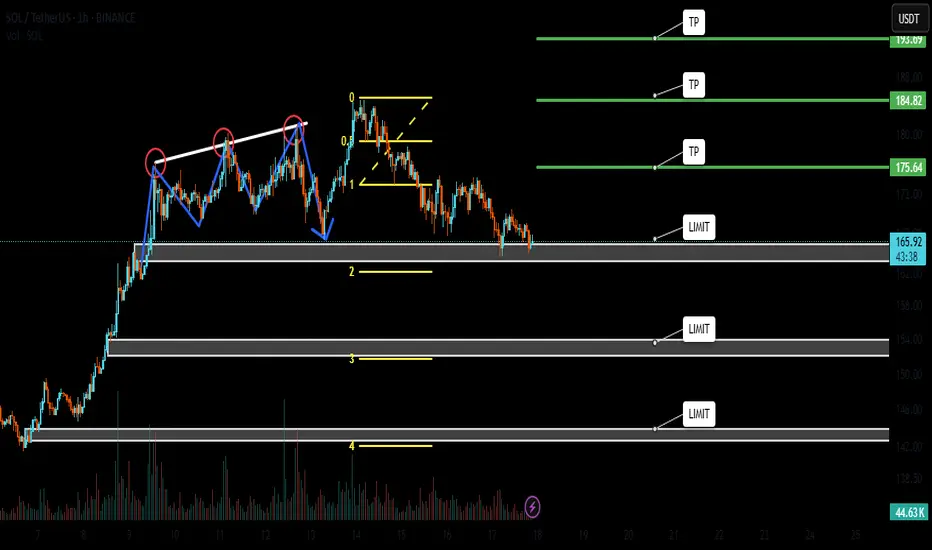
SOLANA BUYLIMITHello friends
Considering the good growth we had, you can see that the price has made a small correction after reaching its ceiling and has entered a range.
Now, with the price correction, there is a good opportunity to buy in stages and with capital management and move towards the specified goals.
*Trade safely with us*
Freesignals
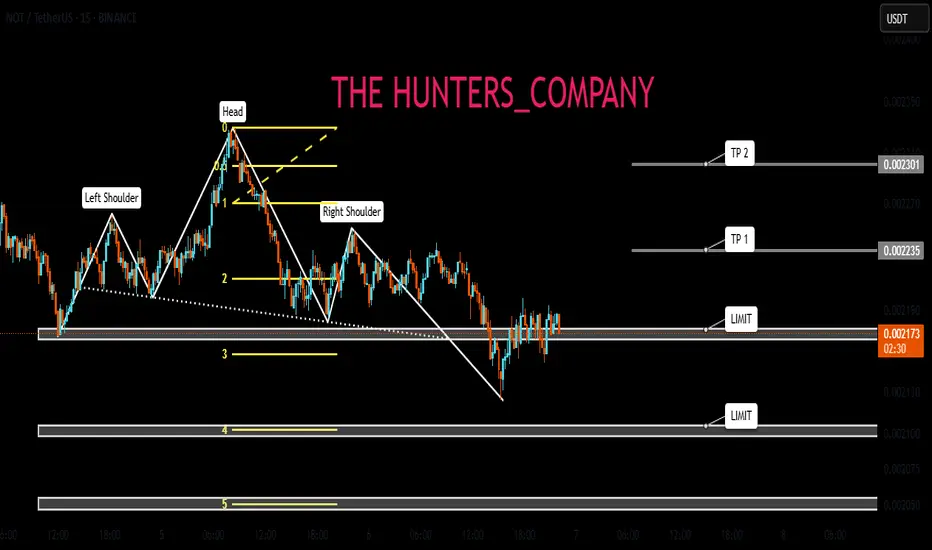
NOTCOIN : IT'S TIME TO BUY GUYSHello dears
If you are risk-averse, this analysis is for you...
According to the bullish pattern that has formed, you can see that we had a decline and now it is time to take a logical risk, that is, we buy at the specified levels with capital management to move towards the specified goals...
*Trade safely with us*
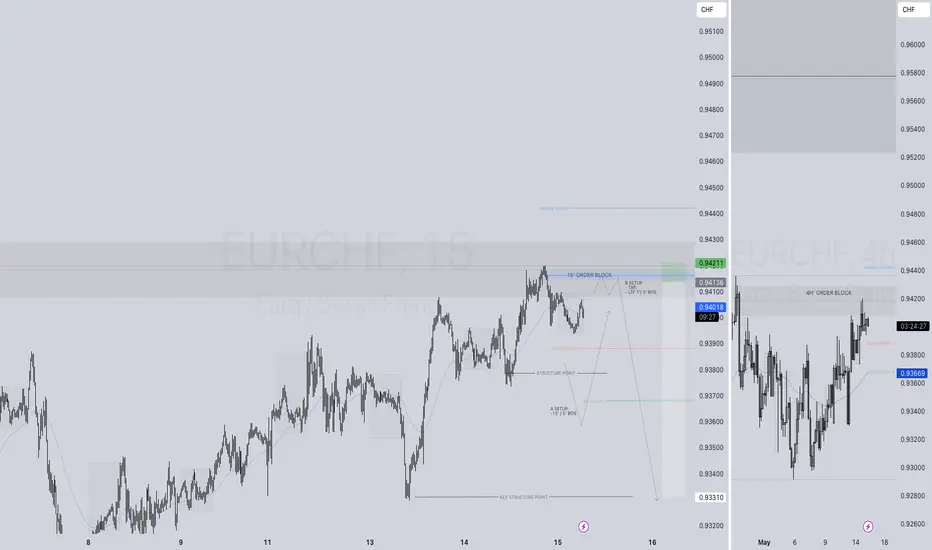
EURCHF SHORT FORECAST Q2 W20 D15 Y25EURCHF SHORT FORECAST Q2 W20 D15 Y25
Professional Risk Managers👋
Welcome back to another FRGNT chart update📈
Diving into some Forex setups using predominantly higher time frame order blocks alongside confirmation breaks of structure.
Let’s see what price action is telling us today!
💡Here are some trade confluences📝
✅4 Hour order block rejection
✅4 Hour 50 EMA rejection
✅Intraday 15' order block
✅Tokyo ranges to be filled
🔑 Remember, to participate in trading comes always with a degree of risk, therefore as professional risk managers it remains vital that we stick to our risk management plan as well as our trading strategies.
📈The rest, we leave to the balance of probabilities.
💡Fail to plan. Plan to fail.
🏆It has always been that simple.
❤️Good luck with your trading journey, I shall see you at the very top.
🎯Trade consistent, FRGNT X
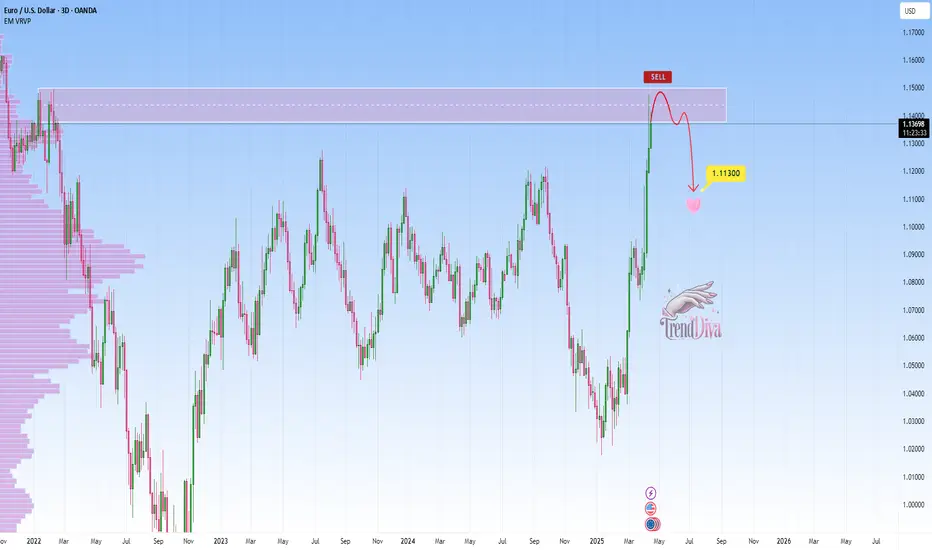
EURUSD - at Resistance: Will it drop to 1.11300?OANDA:EURUSD price is now at a strong resistance level, this is an area where it has struggled to break through in the past and reversed to the downside. It's also where sellers have stepped in before, so it’s worth keeping an eye on, especially for anyone considering short trades.
If we start seeing signs that the price is getting rejected here: like long wicks, bearish candles, or buyers starting to lose momentum, I think we could see a move down toward the 1.11300 level. But if price breaks through this zone clearly, that might dismiss the bearish idea and suggest even more upside will continue.
This area is pretty important and could give us a better idea of where price is headed next.
Just sharing my thoughts on support and resistance, this isn’t financial advice. Always confirm your setups and manage your risk wisely.
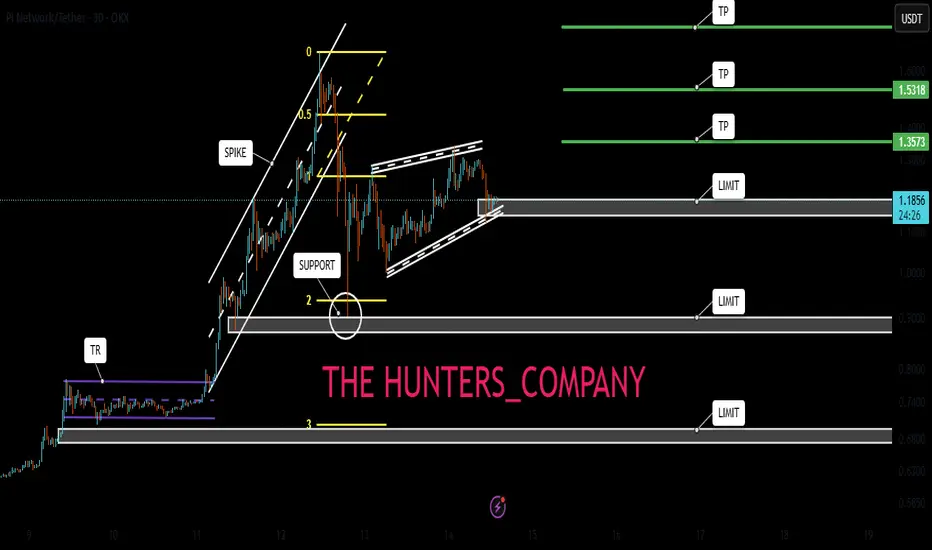
If you're stuck, watch (full analysis)Hello friends
Given the high growth of this token, now that it has made a good correction, it makes sense to buy in stages and with capital management and move with it to the specified goals.
*Trade safely with us*
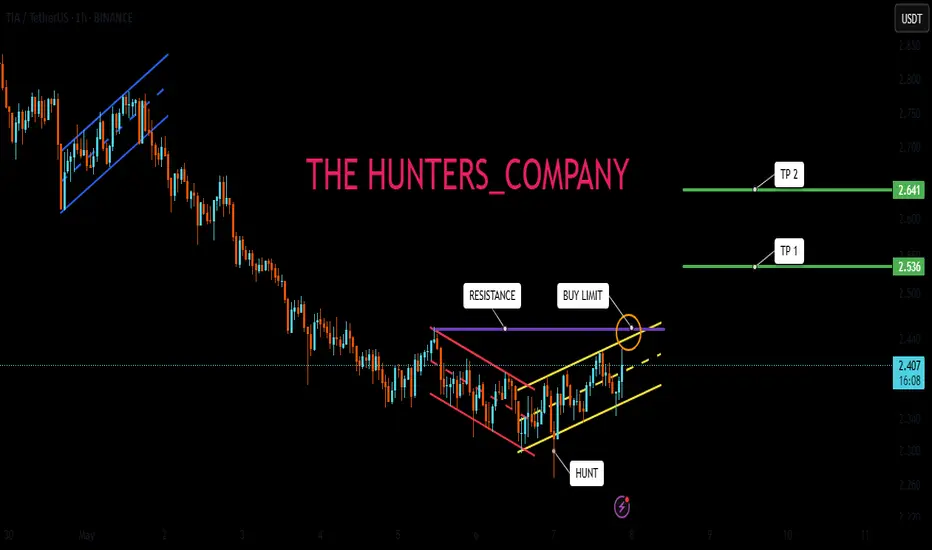
TIA SIGNALSHello friends
As you can see, this currency has a beautiful chart and the technical analysis we did is that if the valid resistance is broken, we can open a buy trade with capital and risk management and move with it to the specified targets.
*Trade safely with us*
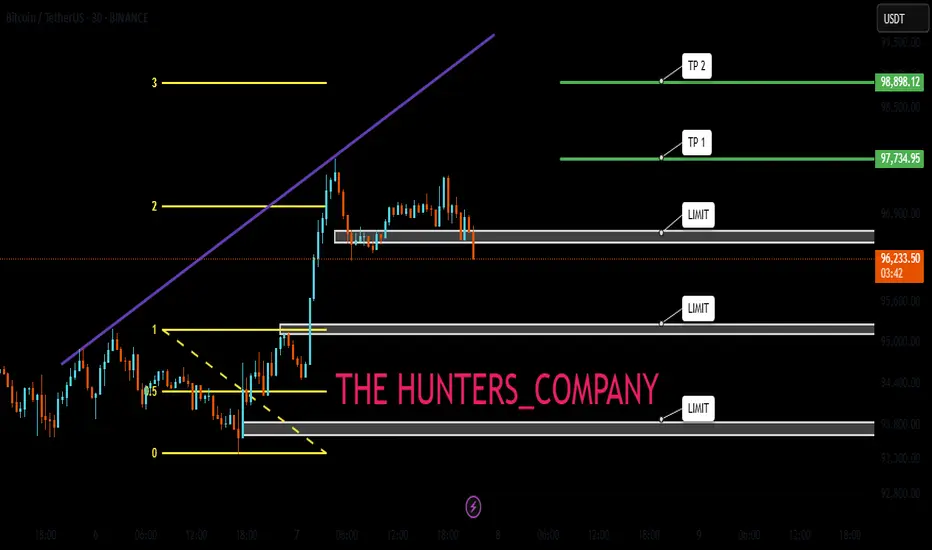
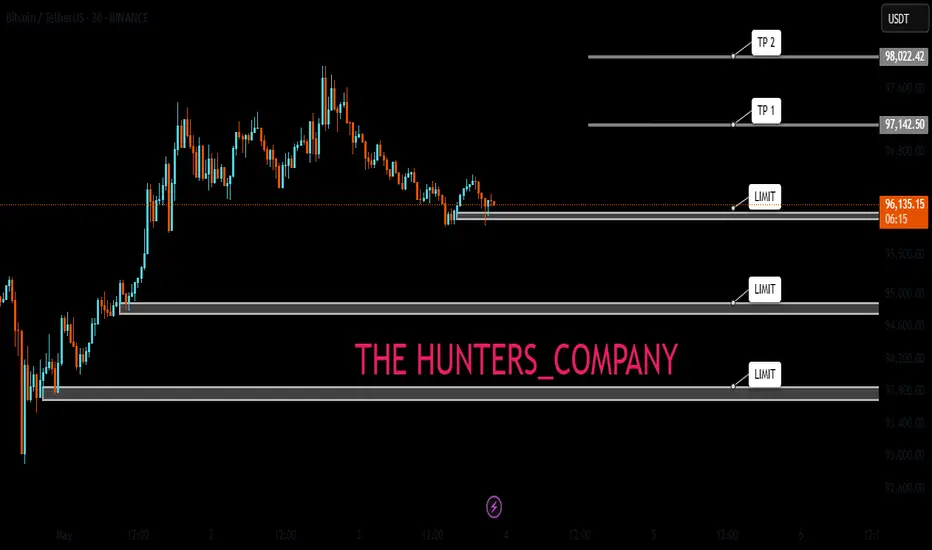
BITCOIN BUY LIMIT Hello friends
If you are a risk taker, this position is for you...
Given the price growth, we expect a correction, so in the pullback we have identified important points to buy with capital and risk management and move towards the specified goals.
*Trade safely with us*
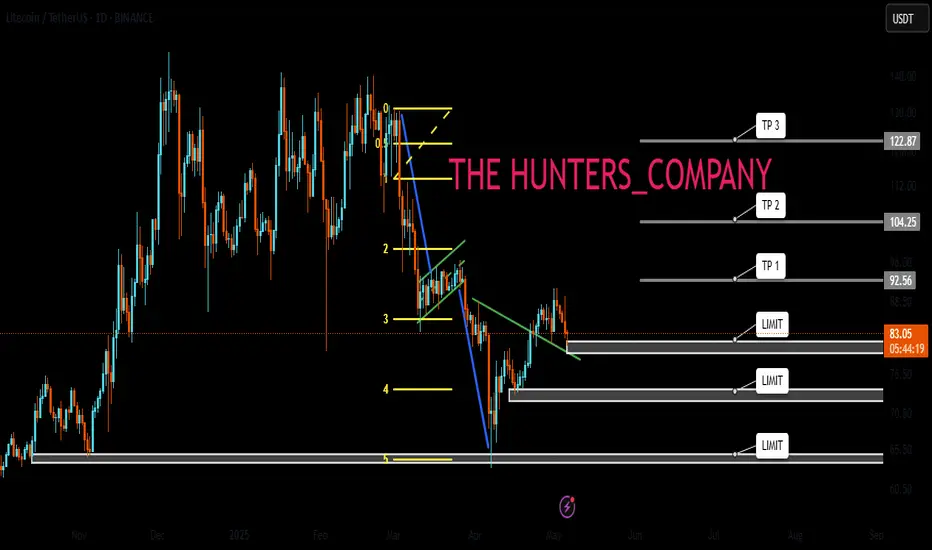
LITCOIN SIGNALSHello dears
You see that after a good growth, the price was in a range and then we had a decline until the support area was identified, which is also a good area and it was able to record a new ceiling, which is a good sign. Now the best and least risky thing is to buy steps.
We have identified the buying steps for you and the targets...
Note that this analysis is in daily time and may take a while, so if you are not patient, do not enter.
*Trade safely with us*
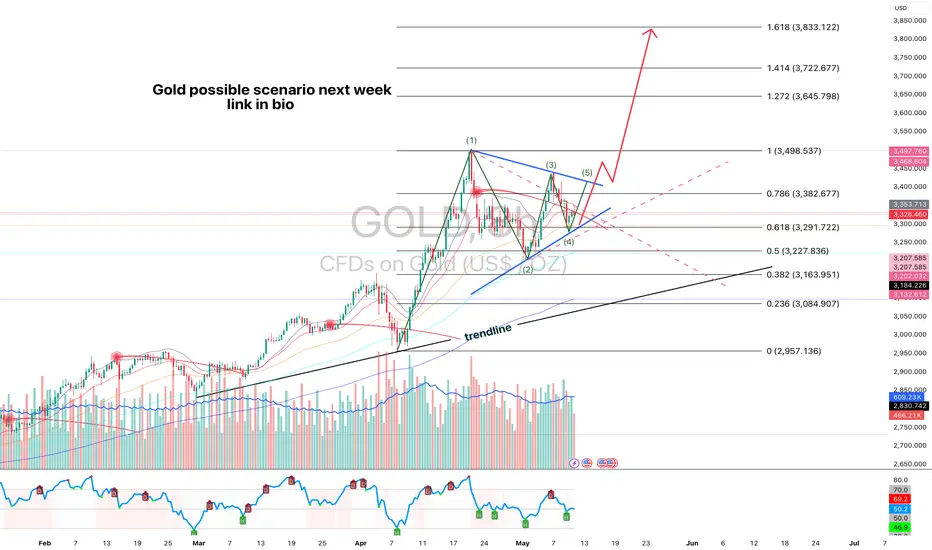
Gold 8H – Probable Scenario Until the End of May 2025Briefly today!
Greetings, let’s take a look at the current situation for gold.
Technically, we can see a classic symmetrical triangle forming on the 8-hour chart, with a support zone established in the 3291–3300 range.
I'm expecting a move towards the 3440–3450 area, followed by a retest and an upward push toward the 3833 level.
Fundamentally, we take into account Trump's policy stance and the ongoing conflict between Pakistan and India.
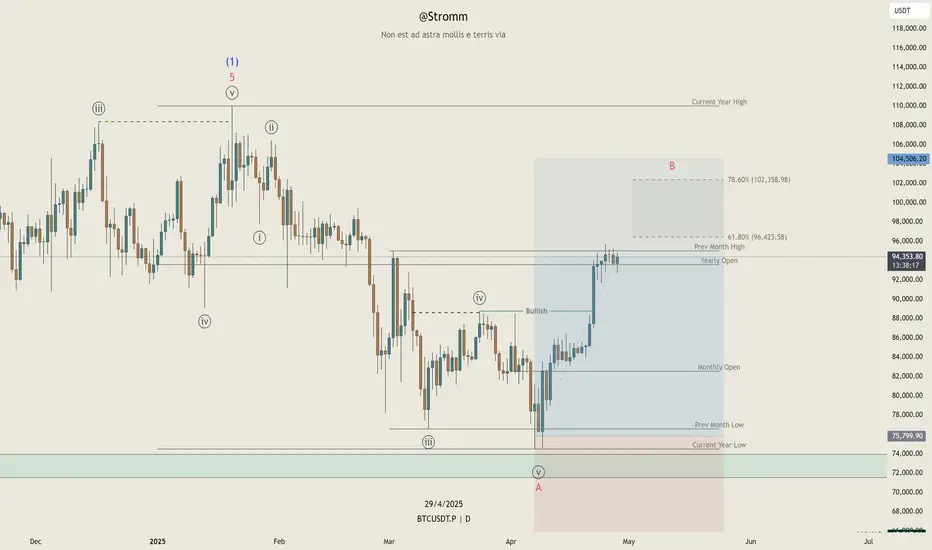
Stromm | BITCOIN Are You BULLISH Enough? When you zoom out to the 12-hour chart , Bitcoin actually looks really clean right now. Since my entry at $75,800, we’ve seen a solid 25% rally that’s clearly shifted the momentum back to bullish. -
But even with that move, I’m not fully convinced yet that we’re on our way straight to a new all-time high.
There’s still a lot of work to be done before that happens.
Right now, I’m watching the zone between $96,400 and $102,300 as a potential reaction area — basically a spot where we could see Wave B complete.
We’re hovering around the Yearly Open, which historically acts as both strong support and resistance, and we’re also right at the Previous Monthly High.
If BTC can hold this zone, we absolutely could push higher toward $102K.
However, I don’t think it’s realistic yet to expect a clean shot to $110K without a deeper pullback first.
Most likely, we’ll need another flush lower to reset before any major breakout.
That said, I’m still long and staying patient.
If we do somehow rip toward $120K, I’m already well-positioned.
And if we get another sell-off?
I’ll be adding even more — no hesitation there.
Of course, a lot of this depends on how the political and macro situation evolves.
There’s definitely a world where the perfect narrative gets laid down, and we rocket to $120K.
But there’s also a world where that doesn't happen — and it’s important to stay mentally flexible between "must happen," "could happen," and "might not happen at all."
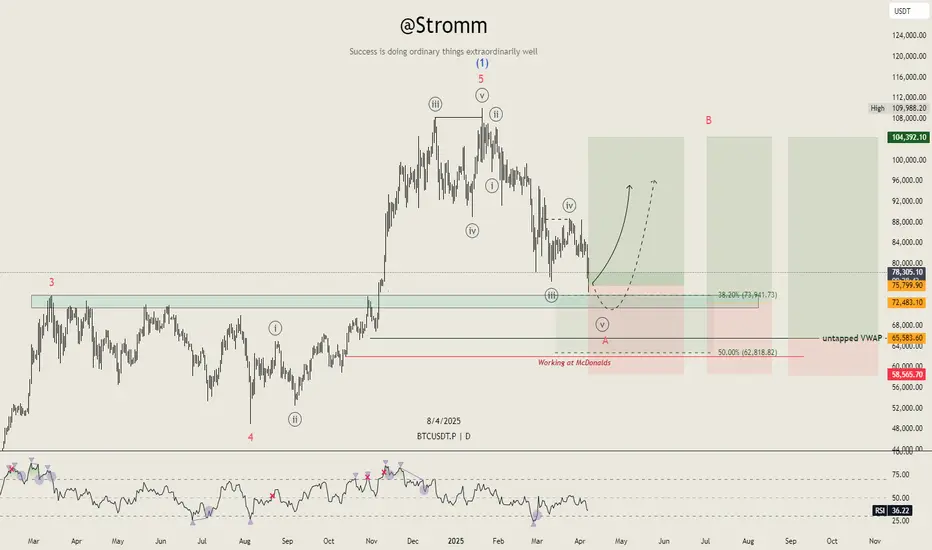
Bitcoin: Blood in the Streets – Now is the Time!Once again, there’s blood in the streets—and from this point on I start scaling into spot positions again, slowly but deliberately.
All of these are spot entries with soft stop-losses—not hard exits, but areas I’ll react to if needed.
So why now? For one, we’re sitting right above the 38,2% Fibonacci level for the ending of the wave A. At the same time, we’re about to tap into a daily Fair Value Gap, while trying to hold the range support—two important technical levels lining up on the higher time frame.
Below that, we have an untapped VWAP at $65.5K, which could act as a magnet, as it often does. And yeah—if we go under $62K or even $60K, the classic “time to work at McDonald’s” joke comes back. But seriously: in markets like this, you need to stay calm, have some humor, and most of all, know what’s possible.
So I’m cautiously watching the S&P 500 closely, which plays a big role in this setup for me.
That’s where I stand on BTC right now—careful optimism, grounded in context and reasoning for me.
BNB BUY LIMIT Hello friends
Due to the entry of buyers and the registration of higher ceilings and floors, we can buy in the direction of the trend and with capital and risk management within the specified ranges and move to the specified targets.
*Trade safely with us*
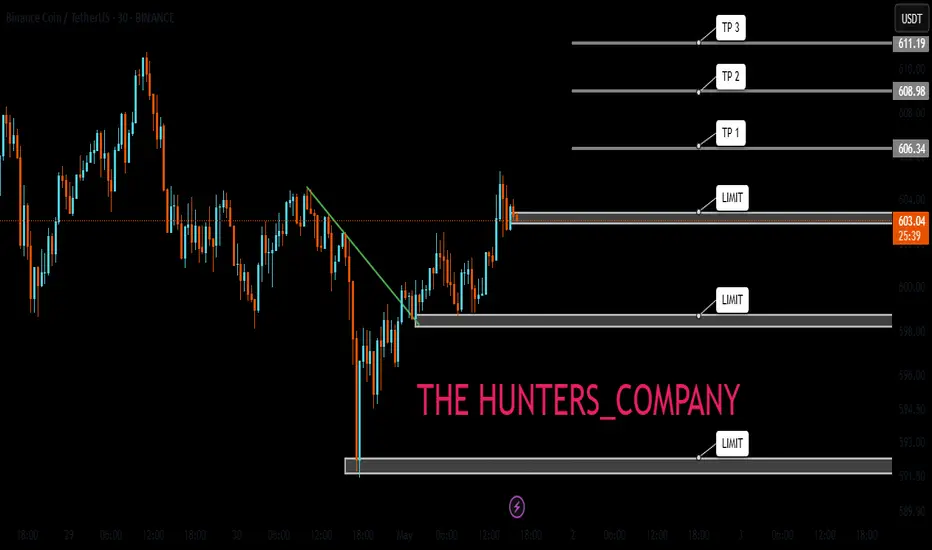
BTC LIMITHello friends
Due to the price drop, we can buy in the price drop and move with it to the specified targets, of course with capital and risk management.
*Trade safely with us*
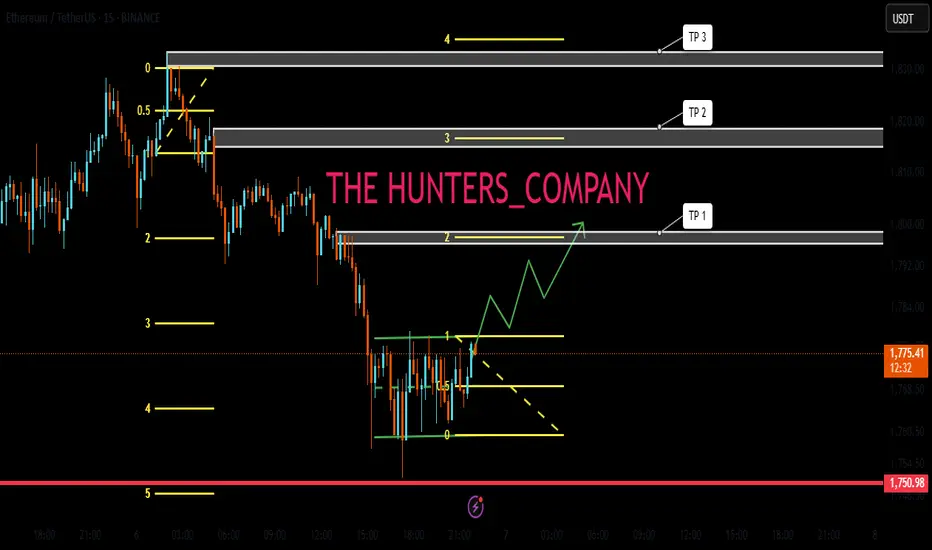
BUY MARKET!!!Hello dears
If you are risk-averse, this analysis is for you...
Given the decline we had, you can see that the price was supported within the specified support range and a range was formed that can be purchased with risk and capital management and moved to the specified ranges...
*Trade safely with us*
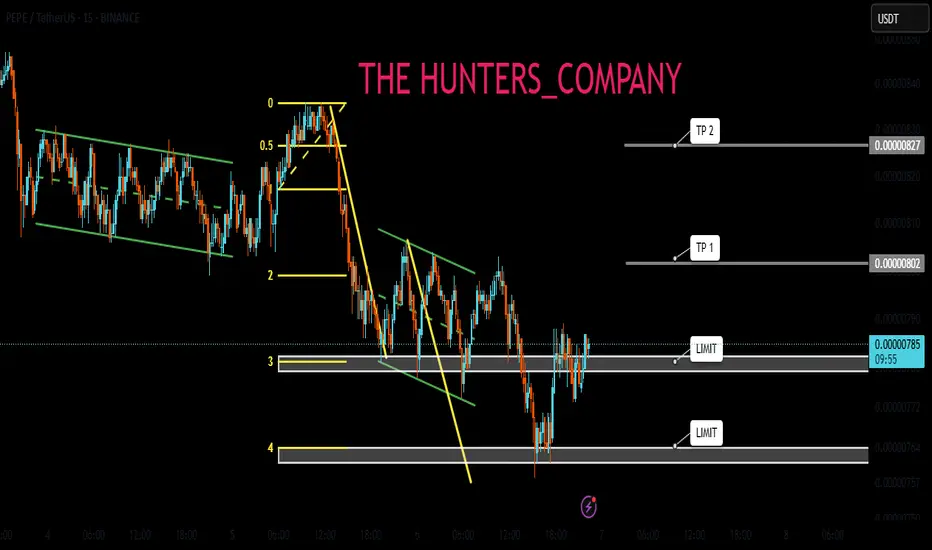
PEPE BUY ...Hello friends
Due to the price drop, good conditions have been created to buy with risk and capital management and move towards the specified goals...
If you are risk-averse, this signal is for you...
*Trade safely with us*
SOL LIVE TRADEHello dears
Given the price support by buyers and the formation of higher ceilings and floors, we can open a trade with risk and capital management.
*Trade safely with us*

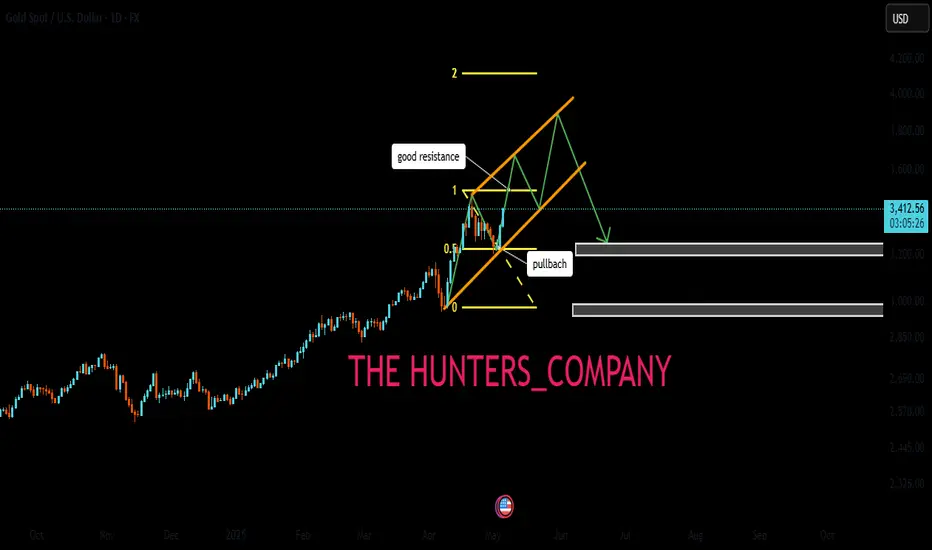
WHAT DO YOU THINK ?Hello dears
Given the regular sinusoidal trend that gold is taking, it was expected to move to the specified numbers, but don't forget that we are at a price ceiling and a sharp upward movement at the end of the upward trend can be a trap...
In case of a drop, the specified ranges are good support.
*Trade safely with us*
EURAUD | 4H | SWING TRADINGHey there;
Traders, your likes are always my biggest source of motivation for me to share analysis. For this reason, I would like to ask each and every one of my followers; please do not miss your likes.
I sincerely thank everyone who supports me with their likes.
SIGNAL ALERT
BUY LIMIT ORDER ( EURAUD ) 1,74560
🟢TP1:1,75388
🟢TP2:1,77709
🟢TP3:1,81747
🔴SL:1,71135
RR / 2,00

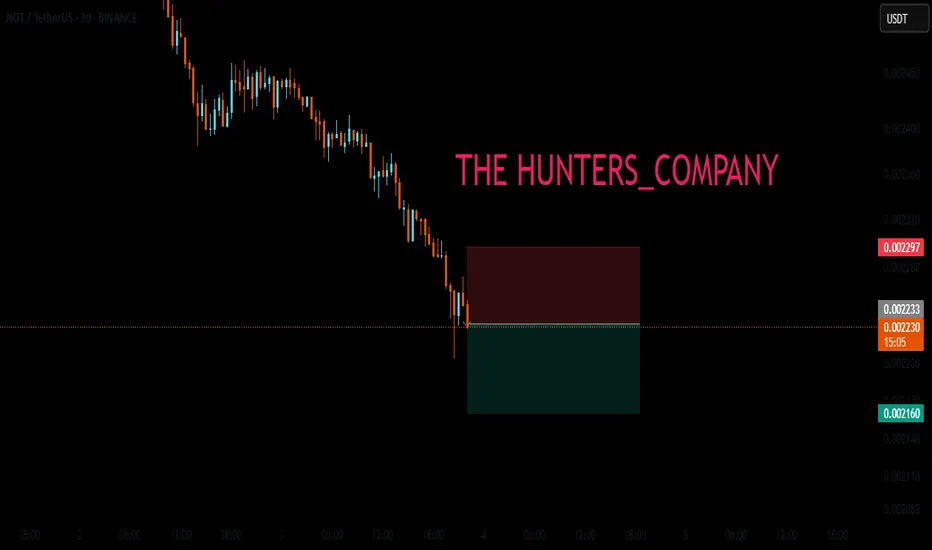
NOT SELLHello friends
Due to the sharp drop in price, we can open a trade in the direction of the trend, of course with capital and risk management.
*Trade safely with us*
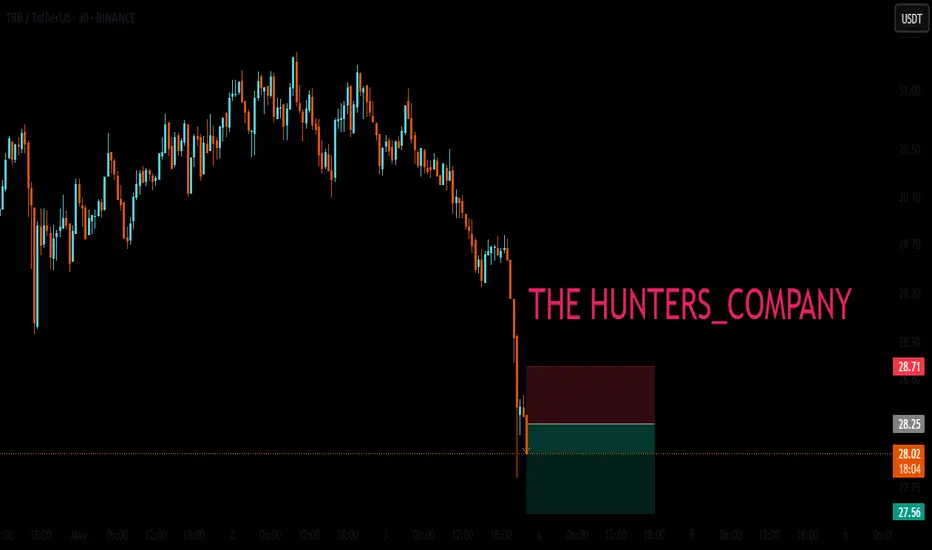
TRB SELLHello friends
Due to the sharp drop in price, we can open a trade in the direction of the trend, of course with capital and risk management.
*Trade safely with us*
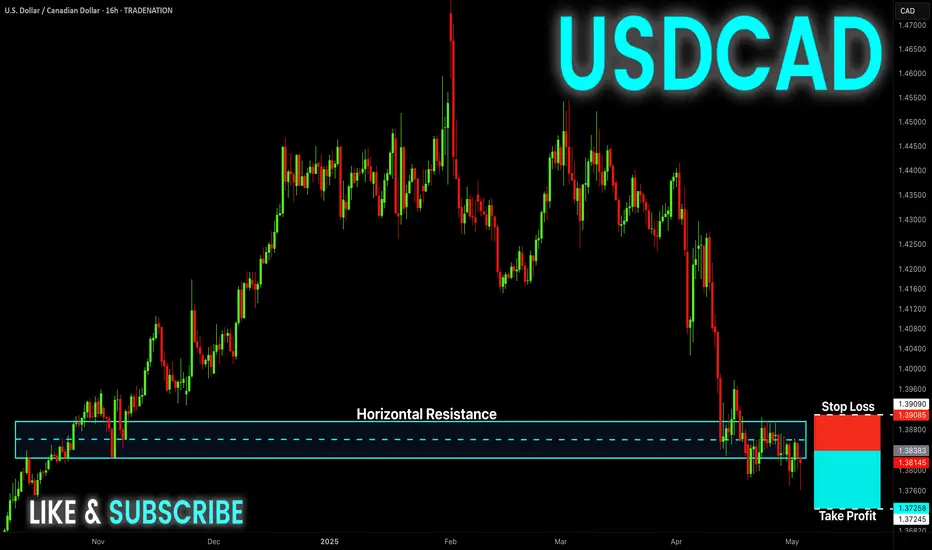
USD-CAD Free Signal! Sell!
Hello,Traders!
USD-CAD is trading in a
Downtrend and the pair is
Consolidating below the
Horizontal resistance
Around 1.3880 so we are
Bearish biased and we can
Enter a short trade on Monday
With the Take Profit of 1.3725
And the Stop Loss of 1.3908
Sell!
Comment and subscribe to help us grow!
Check out other forecasts below too!
Disclosure: I am part of Trade Nation's Influencer program and receive a monthly fee for using their TradingView charts in my analysis.
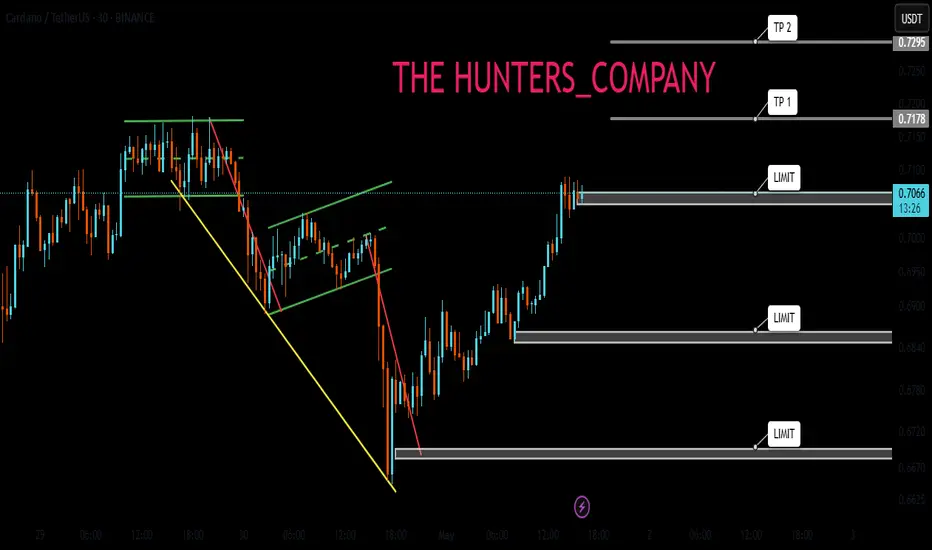
ADA BUY LIMIT (FREE)Hello friends
Due to the entry of buyers and the registration of higher ceilings and floors, we can buy in the direction of the trend and with capital and risk management within the specified ranges and move to the specified targets.
*Trade safely with us*
TON TON TONHello friends
Due to the entry of buyers and the registration of higher ceilings and floors, we can buy in the direction of the trend and with capital and risk management within the specified ranges and move to the specified targets.
*Trade safely with us*
