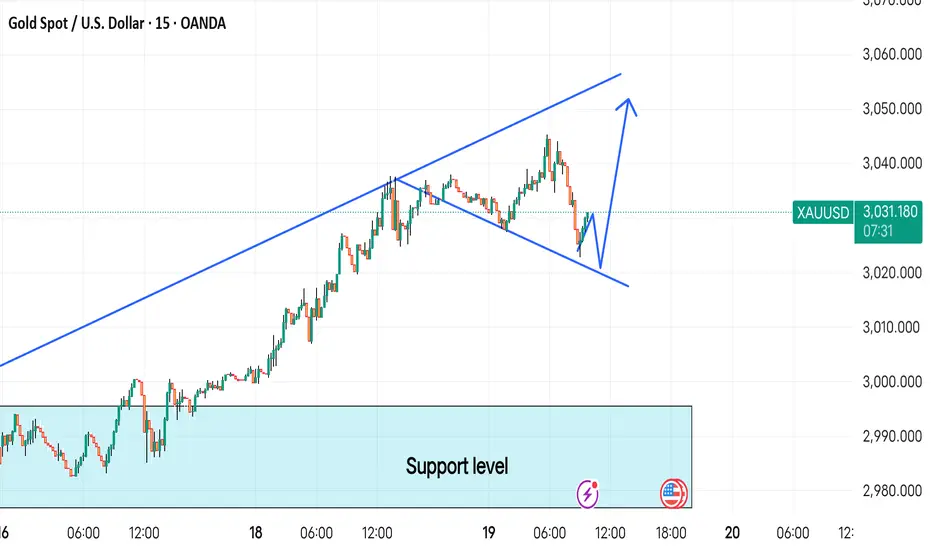
GOLD 15MINUTES CHART TECHNICAL ANALYSIS NEXT MOVE POSSIBLE...This chart shows XAU/USD (Gold) price action forming an ascending wedge pattern.
Price is currently retracing from the upper trendline.
A potential bounce from the lower trendline could trigger another bullish move.
If price respects the wedge structure, the next target is the previous high near 3,060.
A break below the wedge could indicate a deeper correction toward the support level around 2,980.
Overall, bullish bias remains, but confirmation at the support zone is key.
Freesignals
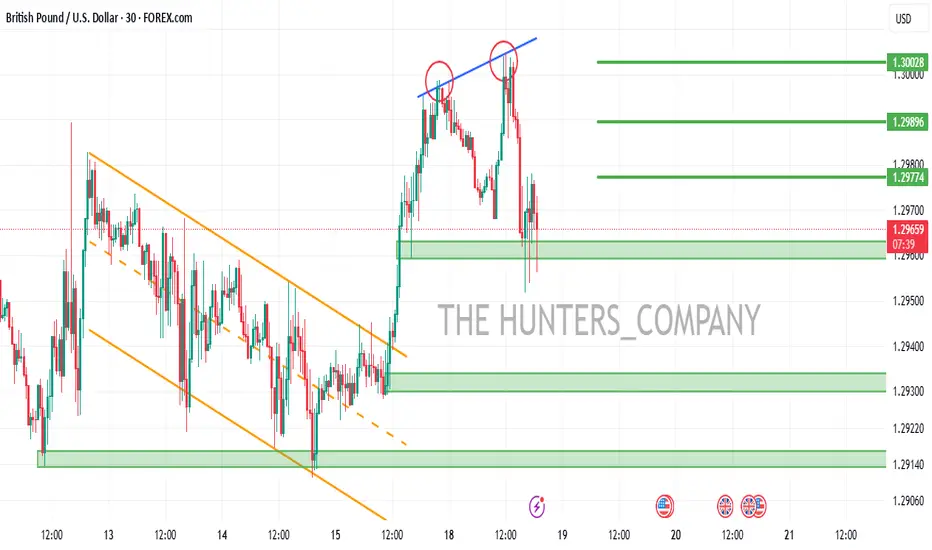
GBPUSDHello friends
Given the channel breakdown and the good price growth, we can now buy in the support areas during the pullbacks that the price makes, of course with capital and risk management...
*Trade safely with us*
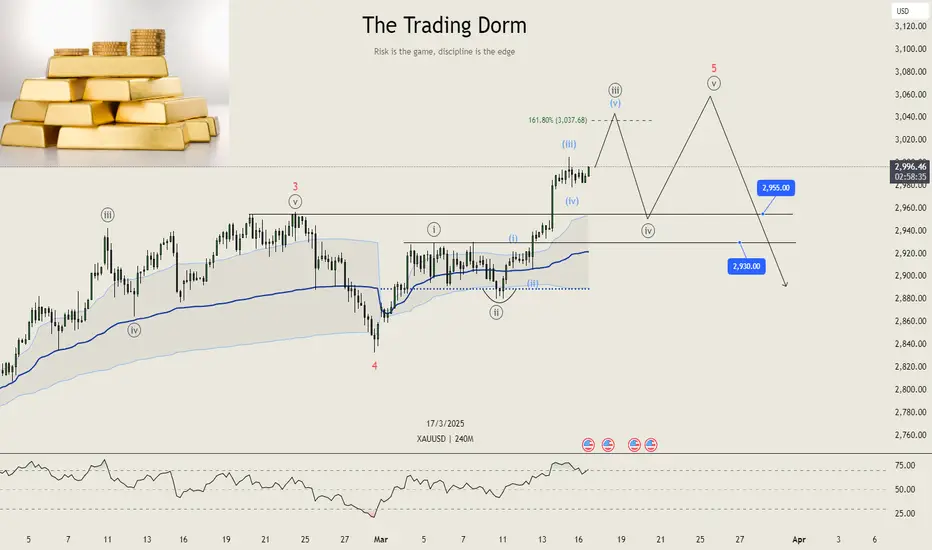
$XAUUSD | Gold - Nearing ExhaustionGold has seen a strong rally over the past week – technically impressive, but from a Risk-On perspective, it’s more of a warning sign. As I mentioned in my Nvidia market report, I don’t think the Risk-Off phase will last forever. But for now, I believe we’re not quite done with it yet.
From where I stand, Gold could push a bit higher. My next target is the 161.8% Fibonacci extension at $3,038, which I expect to act as a reaction level. After that, I’m targeting a drop back down into the $2,955 to $2,930 area – this is where I expect sub-wave ((iv)) to complete.
What happens next will depend on how price reacts within that zone. Ideally, we’ll see one final move up to complete sub-wave (v) or roman ((iii)), but where exactly that ends is still unclear – I’ll reassess as we approach the zone.
For now, Gold remains strong – but I believe it's nearing exhaustion.
USOILHello friends
Due to the price falling in the identified support area, buyers were able to support the price, but given the weakness of the trend we are witnessing, it seems that sellers have more power...
Now, for the price to rise, the identified resistance must be broken, and for the price to fall, if the support is broken, the price will continue to fall.
*Trade safely with us*

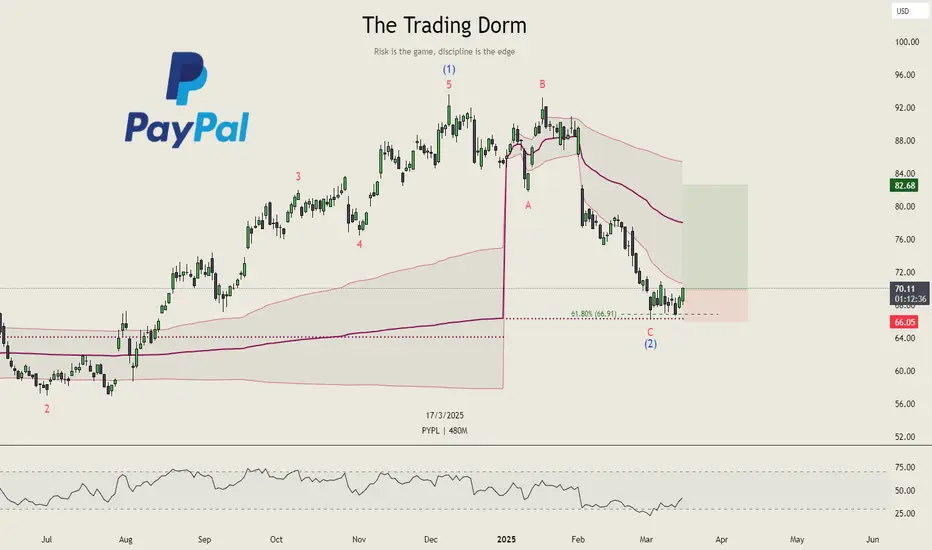
PayPal - Multiple Signals Pointing to a Potential Bottom!I’ve just entered a position in PayPal, and the reason is that several overlapping factors are lining up in a way that suggests a potential bottom may be in.
First, it looks very likely that Wave (2) is complete. The stock tapped the 61.8% Fibonacci retracement level with precision and has held that level over the past few days – all while the RSI has been climbing, which is a strong bullish divergence signal in my book.
Second, PayPal just touched last year’s VWAP level perfectly, which I view as another strong technical indicator for a potential reversal.
How far this move could go is still unclear, but the open gap above is definitely something I’m watching closely. For that to be in play, $71 needs to be reclaimed. And from here on, $66 should not be touched again.
That’s my plan – and that’s how I’m trading it. Let’s see if the market plays along.
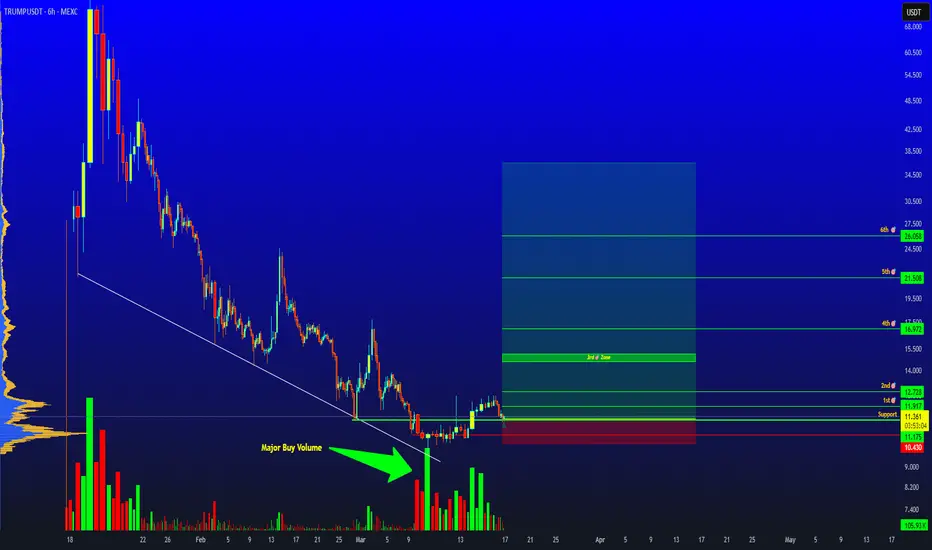
TrumpHello Traders,
Today we are posting a trade we see that we know you are all eyeing. BINANCE:TRUMPUSDT
This is a trade we saw in our weekly trade hunt. If you are not familiar in TA and have a hard time understanding the chart feel free to reach out to us and we will happily help you understand.
Stay profitable,
Savvy
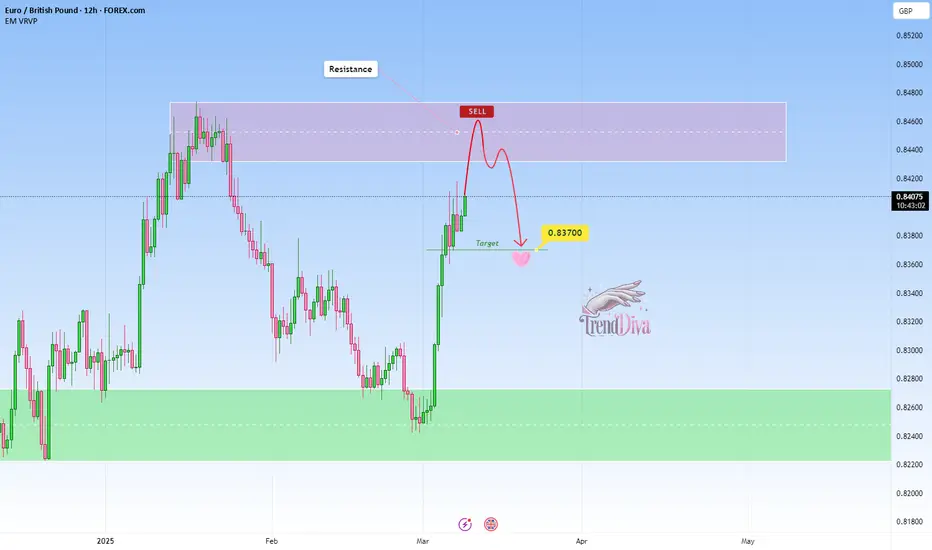
EURGBP nearing resistance – Drop toward 0.8370 next?OANDA:EURGBP is getting close to a key resistance level that has previously acted as a strong barrier, triggering bearish momentum in the past -
This zone is once again a potential point of interest for those looking for short opportunities. Given this, how price reacts here could set the tone for the next move.
If signs of rejection appear: such as long upper wicks, bearish candlestick formations, or a slowdown in bullish momentum, a move toward the 0.83700 is highly possible . However, a decisive breakout above this resistance may invalidate the bearish bias and lead to further upside. Price action at this level will be critical in determining the next move.
Just my perspective on key levels, always confirm setups and maintain solid risk management.

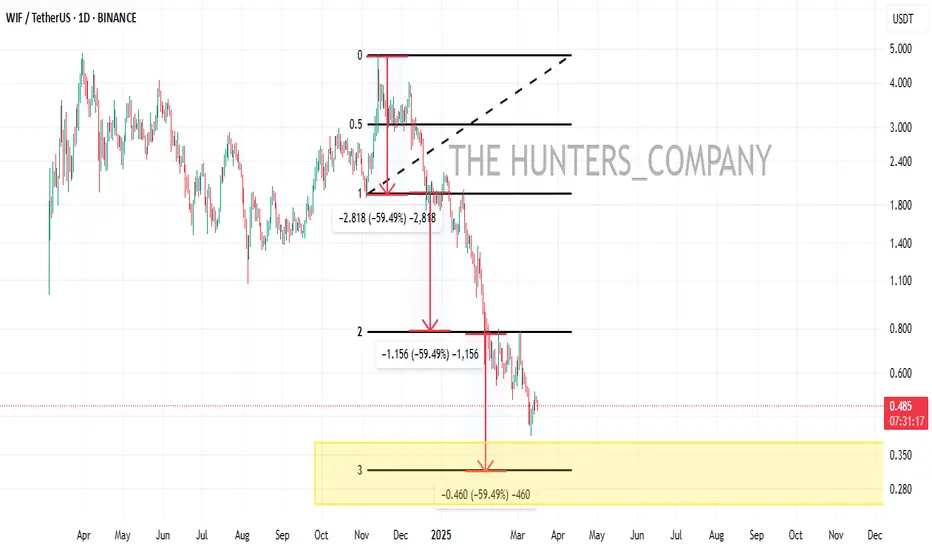
WIF/USDTHello friends
According to the market cycle, the price decline is ongoing and is expected to continue.
Now the only important support is the green area, which the price reaches there and we will see what reaction we get from the buyers.
Will they support the price or will the decline continue...
If you want to be with us in this alt season, send us a message.
*Trade safely with us*
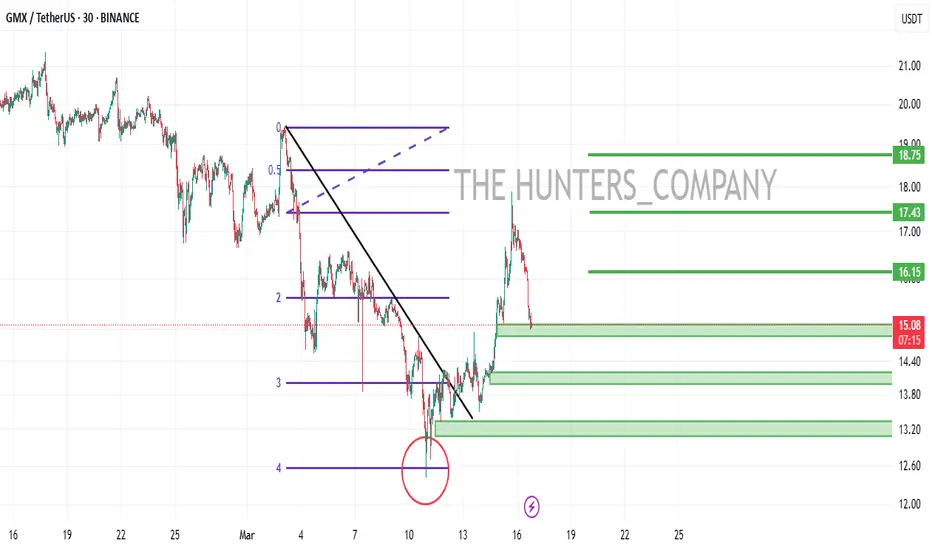
GMX/USDTHello friends
Due to the heavy price drop on the indicated support, buyers have provided good support for the price, which has caused a good price growth.
Now you can buy in steps in the indicated support areas.
If you want to be with us in the Alt Season, send us a message.
*Trade safely with us*
SPELL/USDTHello friends
Given the strong support of the price, you can buy within the specified ranges with capital and risk management.
Price targets are also specified...
*Trade safely with us*

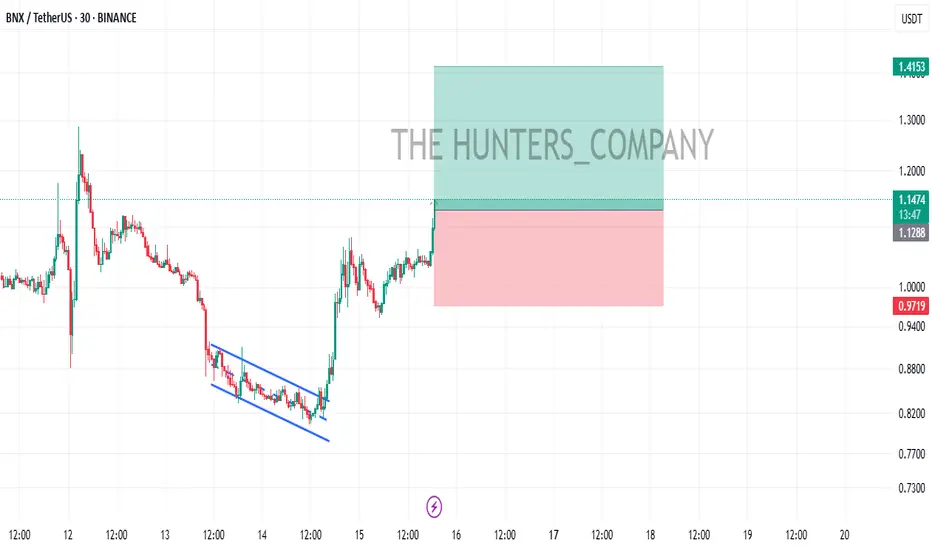
BNX/USDTHello friends
Given the price growth and the arrival of buyers, now that the price has corrected, you can enter the transaction with risk and capital management.
*Trade safely with us*
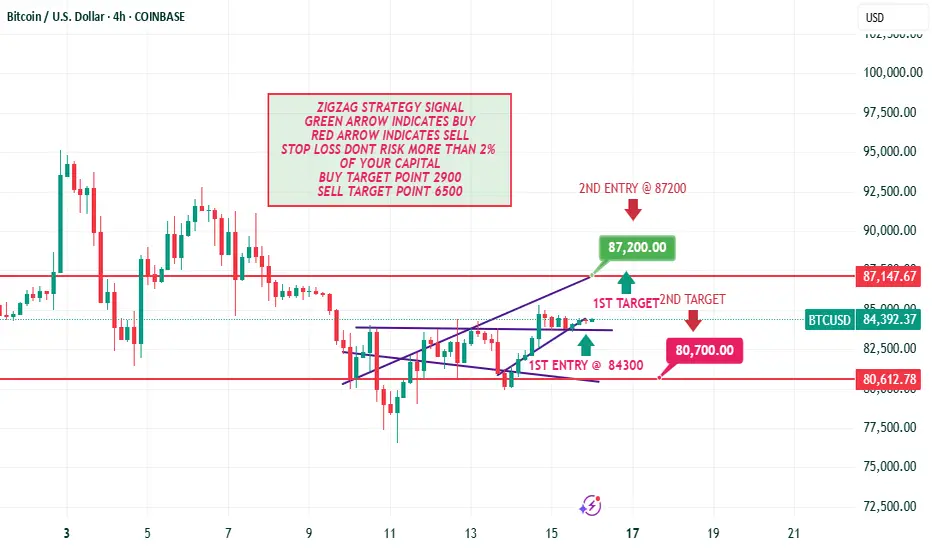
BTC FOR SCALPERS AND DAY TRADERS *9400 POINTS **Guys pls like, share and follow my ideas
Entry price ,stoploss and Target already marked in the chart itself FYI.
Thank You All
ZIGZAG STRATEGY SIGNAL
GREEN ARROW INDICATES BUY
RED ARROW INDICATES SELL
STOP LOSS DONT RISK MORE THAN 2%
OF YOUR CAPITAL
BUY TARGET POINT 2900
SELL TARGET POINT 6500
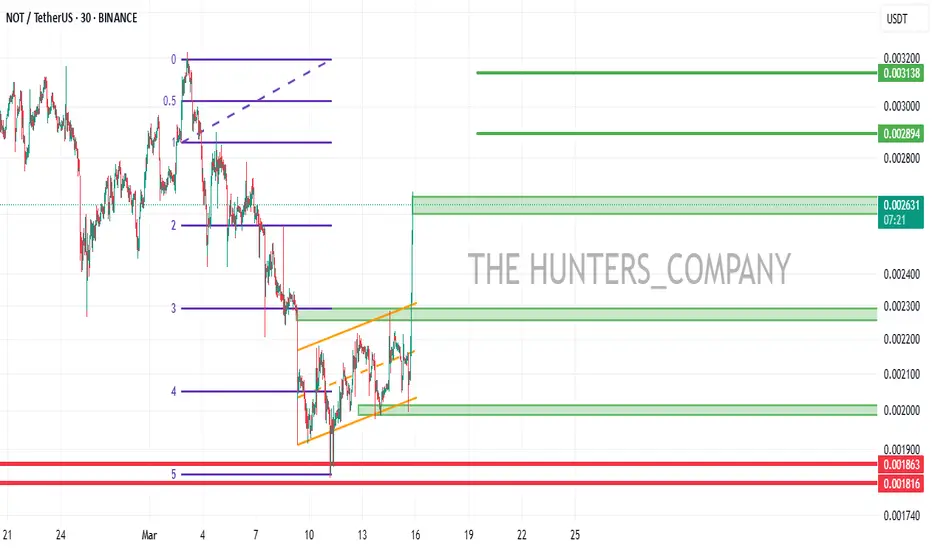
NOTCOINHello friends
As you can see, the price has been very strongly supported by buyers from the support area we have identified, causing a price pump.
Now, in the areas we have identified, you can buy in steps with capital management and move to the specified targets.
*Trade safely with us*
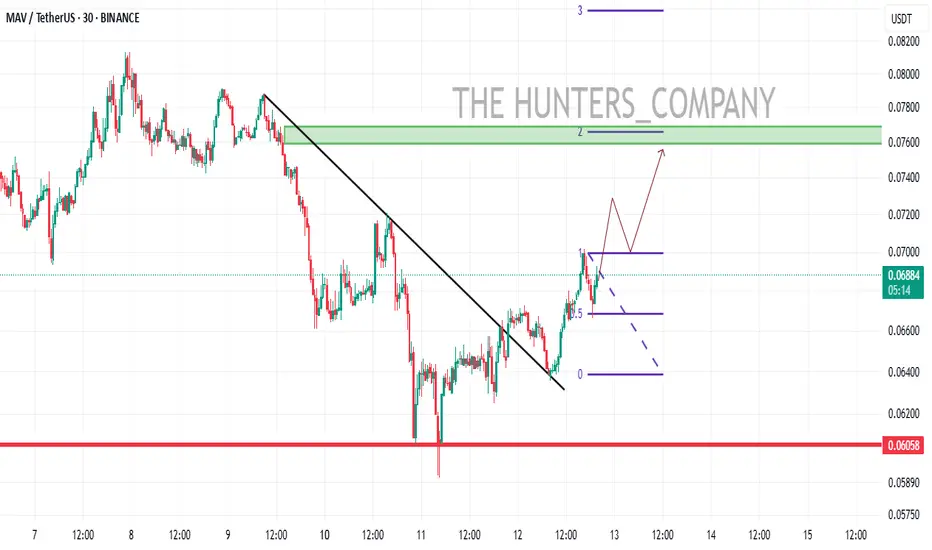
MAV/USDTHello friends
After a heavy fall, now with the trend line broken and the ceiling and floor hit higher, it is expected to move to the resistance area.
You can enter the capital with capital management.
*Trade safely with us*
TRB...Hello friends
According to the formation of a trading range, if the price manages to break through the price, the specified ranges can be a good support.
*Trade safely with us*

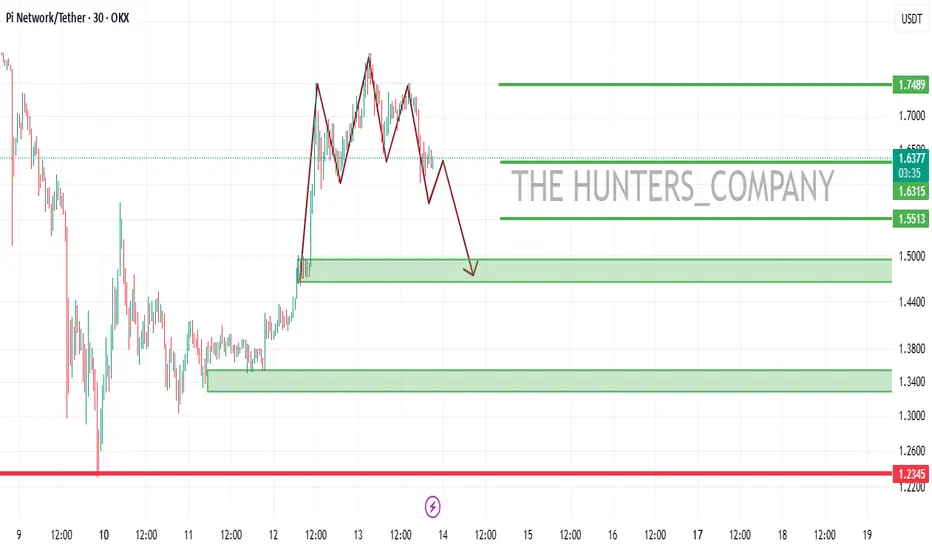
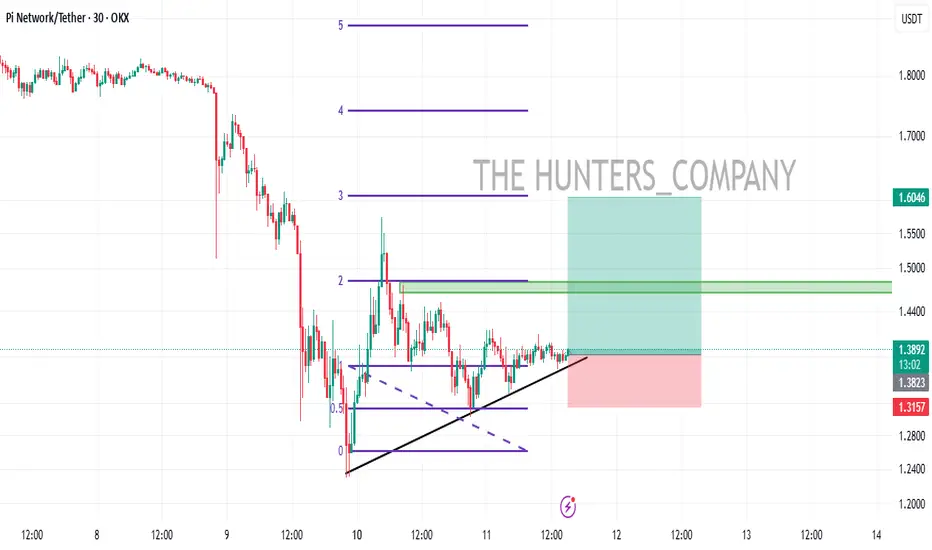
PI...Hello friends
Given the good growth we had, we now have the opportunity to buy in the pullback...
You can buy in steps within the limits we have specified for you with capital management...
*Trade safely with us*
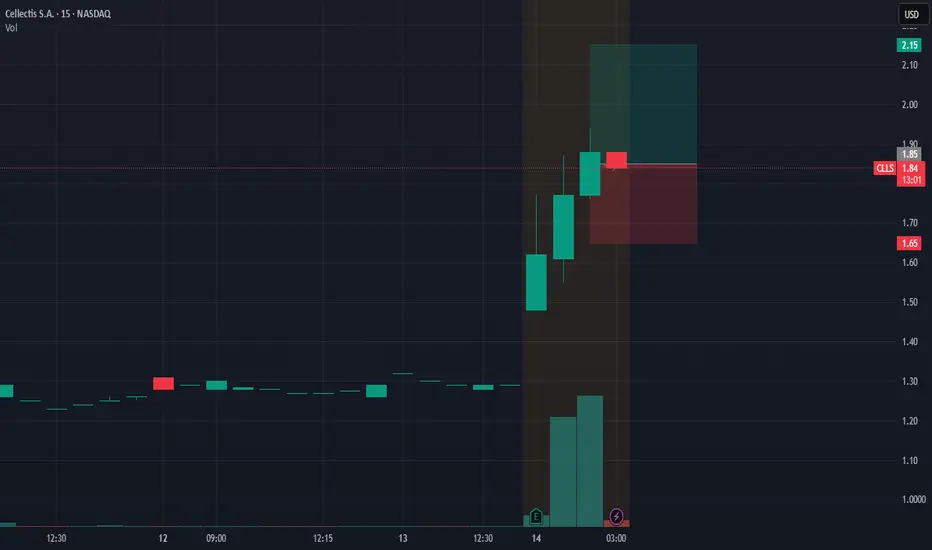
$CLLS free signal of the week.With a positive fundamental behind, we may see some action today on NASDAQ:CLLS
EURGBP - Approaching Key Resistance: Is 0.8370 the next target?OANDA:EURGBP is nearing a key resistance level that has previously acted as a strong barrier, triggering bearish momentum in the past. This zone also aligns with prior supply areas where sellers have stepped in, making it a potential point of interest for those looking for short opportunities. Given its historical significance, how price reacts here could set the tone for the next move.
If bearish signals emerge, such as rejection wicks, bearish candlestick patterns, or signs of weakening bullish pressure, I anticipate a move toward the 0.83700 level. However, a clear breakout above this resistance could challenge the bearish outlook and open the door for further upside. It's a pivotal area where price action will likely provide clearer clues on the next direction.
Just my take on support and resistance zones, not financial advice. Always confirm your setups and trade with a proper risk management.
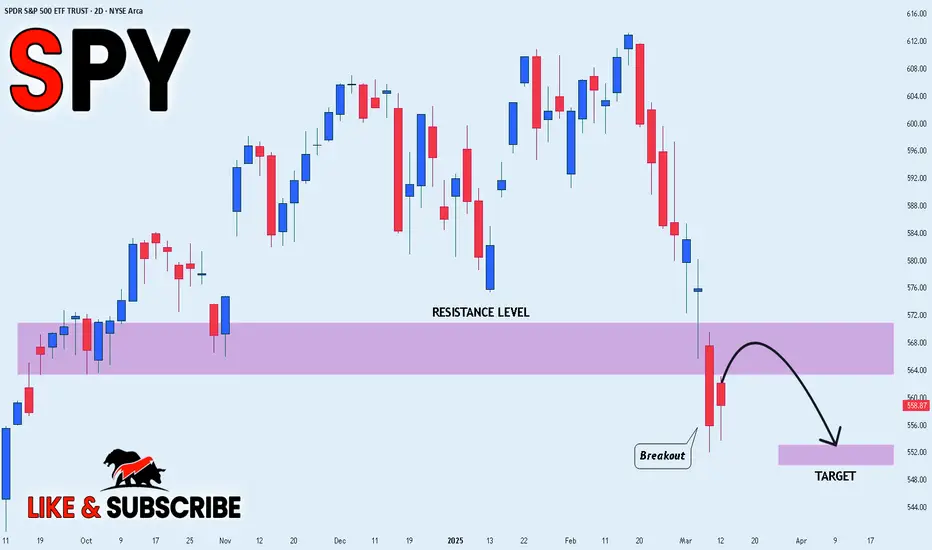
SPY STRONG BREAKOUT|SHORT|
✅SPY made a bearish breakout
Of the key horizontal level
Of 568.00$ which is now
A resistance and the breakout
Is confirmed so we are bearish
Biased and we will be expecting
A further bearish move down
SHORT🔥
✅Like and subscribe to never miss a new idea!✅
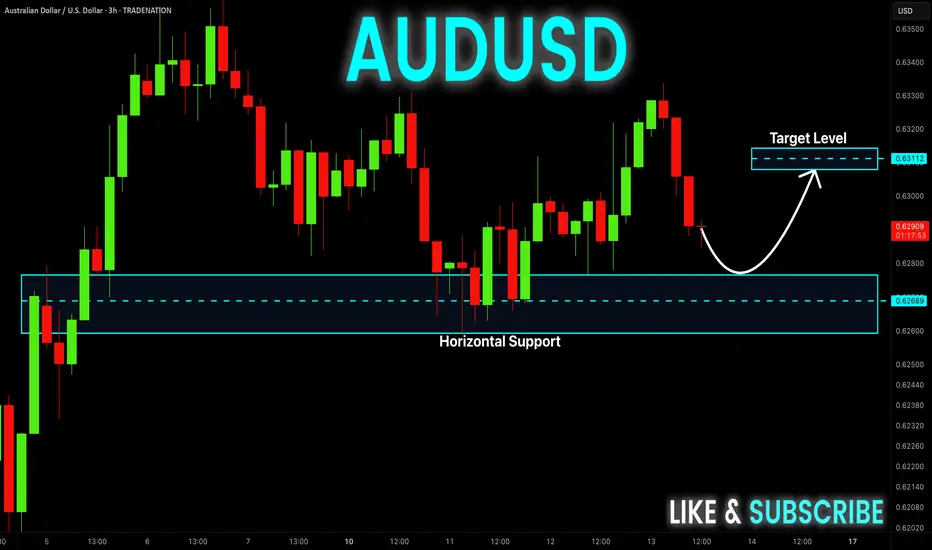
AUD-USD Support Ahead! Buy!
Hello,Traders!
AUD-USD is going down
And will soon retest a
Horizontal demand level
Of 0.6260 from where we
Will be expecting a local
Rebound and a move up
Buy!
Comment and subscribe to help us grow!
Check out other forecasts below too!
Disclosure: I am part of Trade Nation's Influencer program and receive a monthly fee for using their TradingView charts in my analysis.
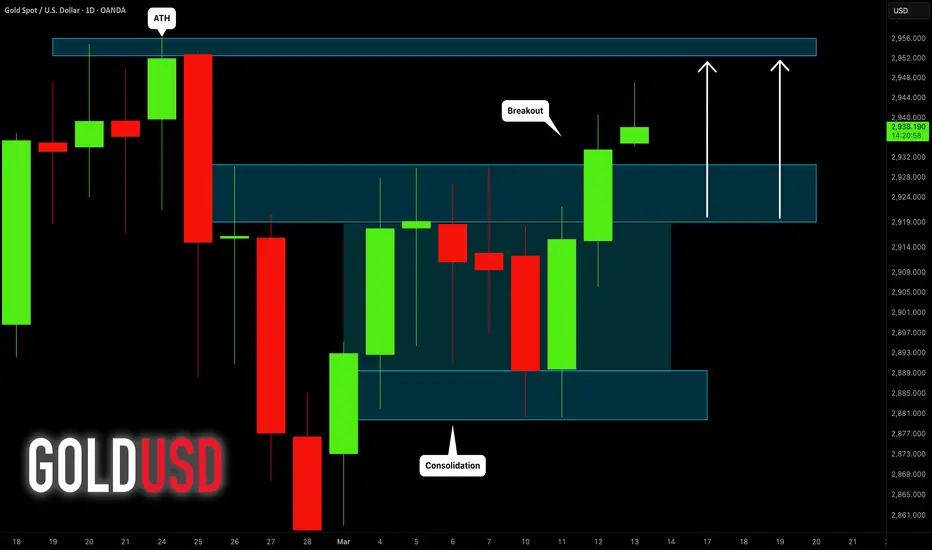
GOLD (XAUUSD): Rise Continues
Gold broke and closed above a resistance line of a horizontal
consolidation range on a daily.
We can expect a bullish movement to the All-Time high now.
Goal - 2952
❤️Please, support my work with like, thank you!❤️
PI/USDT (UPDATE)Hello friends
Given the price drop, now with the formation of a triangle and the price compression, we will probably have a good pump, so we have determined the entry point and price targets for you to enter with risk and capital management.
*Trade safely with us*
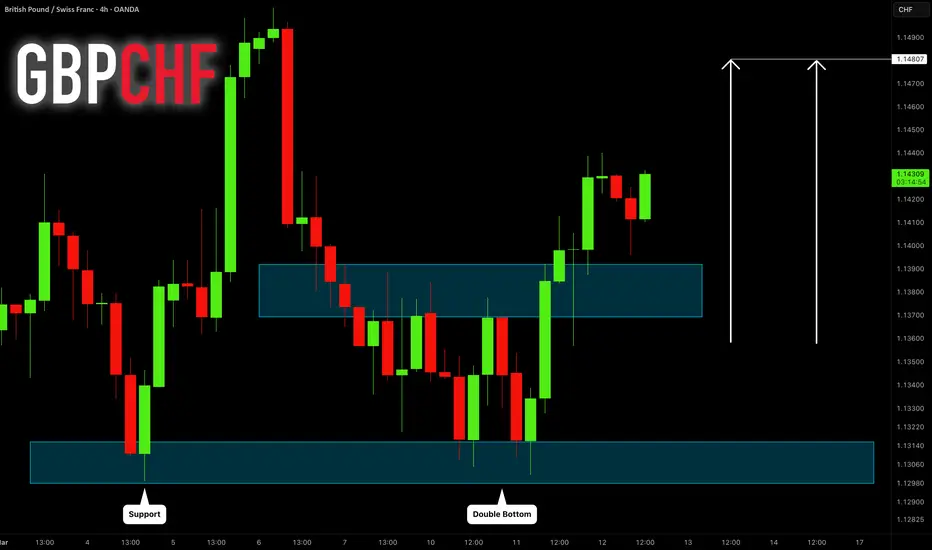
GBPCHF: Bullish Wave Continues 🇬🇧🇨🇭
As I predicted yesterday, GBPCHF went up from support.
I see one more bullish pattern today:
this time we have a confirmed breakout of a neckline of a double bottom.
The market is going to rise and reach 1.148 level soon.
❤️Please, support my work with like, thank you!❤️