GBPUSD – DAILY FORECAST Q3 | W31 | D30 | Y25📊 GBPUSD – DAILY FORECAST
Q3 | W31 | D30 | Y25
Daily Forecast 🔍📅
Here’s a short diagnosis of the current chart setup 🧠📈
Higher time frame order blocks have been identified — these are our patient points of interest 🎯🧭.
It’s crucial to wait for a confirmed break of structure 🧱✅ before forming a directional bias.
This keeps us disciplined and aligned with what price action is truly telling us.
📈 Risk Management Protocols
🔑 Core principles:
Max 1% risk per trade
Only execute at pre-identified levels
Use alerts, not emotion
Stick to your RR plan — minimum 1:2
🧠 You’re not paid for how many trades you take, you’re paid for how well you manage risk.
🧠 Weekly FRGNT Insight
"Trade what the market gives, not what your ego wants."
Stay mechanical. Stay focused. Let the probabilities work.
FX:GBPUSD
Freesignals
AUDUSD – DAILY FORECAST Q3 | W31 | D30 | Y25📊 AUDUSD – DAILY FORECAST
Q3 | W31 | D30 | Y25
Daily Forecast 🔍📅
Here’s a short diagnosis of the current chart setup 🧠📈
Higher time frame order blocks have been identified — these are our patient points of interest 🎯🧭.
It’s crucial to wait for a confirmed break of structure 🧱✅ before forming a directional bias.
This keeps us disciplined and aligned with what price action is truly telling us.
📈 Risk Management Protocols
🔑 Core principles:
Max 1% risk per trade
Only execute at pre-identified levels
Use alerts, not emotion
Stick to your RR plan — minimum 1:2
🧠 You’re not paid for how many trades you take, you’re paid for how well you manage risk.
🧠 Weekly FRGNT Insight
"Trade what the market gives, not what your ego wants."
Stay mechanical. Stay focused. Let the probabilities work.
FX:AUDUSD

USDJPY – DAILY FORECAST Q3 | W31 | D30 | Y25📊 USDJPY – DAILY FORECAST
Q3 | W31 | D30 | Y25
Daily Forecast 🔍📅
Here’s a short diagnosis of the current chart setup 🧠📈
Higher time frame order blocks have been identified — these are our patient points of interest 🎯🧭.
It’s crucial to wait for a confirmed break of structure 🧱✅ before forming a directional bias.
This keeps us disciplined and aligned with what price action is truly telling us.
📈 Risk Management Protocols
🔑 Core principles:
Max 1% risk per trade
Only execute at pre-identified levels
Use alerts, not emotion
Stick to your RR plan — minimum 1:2
🧠 You’re not paid for how many trades you take, you’re paid for how well you manage risk.
🧠 Weekly FRGNT Insight
"Trade what the market gives, not what your ego wants."
Stay mechanical. Stay focused. Let the probabilities work.
FX:USDJPY

AUDCAD – DAILY FORECAST Q3 | W31 | D30 | Y25
📊 AUDCAD – DAILY FORECAST
Q3 | W31 | D30 | Y25
Daily Forecast 🔍📅
Here’s a short diagnosis of the current chart setup 🧠📈
Higher time frame order blocks have been identified — these are our patient points of interest 🎯🧭.
It’s crucial to wait for a confirmed break of structure 🧱✅ before forming a directional bias.
This keeps us disciplined and aligned with what price action is truly telling us.
📈 Risk Management Protocols
🔑 Core principles:
Max 1% risk per trade
Only execute at pre-identified levels
Use alerts, not emotion
Stick to your RR plan — minimum 1:2
🧠 You’re not paid for how many trades you take, you’re paid for how well you manage risk.
🧠 Weekly FRGNT Insight
"Trade what the market gives, not what your ego wants."
Stay mechanical. Stay focused. Let the probabilities work.
FX:AUDCAD

AUDJPY – DAILY FORECAST Q3 | W31 | D30 | Y25
📊 AUDJPY – DAILY FORECAST
Q3 | W31 | D30 | Y25
Daily Forecast 🔍📅
Here’s a short diagnosis of the current chart setup 🧠📈
Higher time frame order blocks have been identified — these are our patient points of interest 🎯🧭.
It’s crucial to wait for a confirmed break of structure 🧱✅ before forming a directional bias.
This keeps us disciplined and aligned with what price action is truly telling us.
📈 Risk Management Protocols
🔑 Core principles:
Max 1% risk per trade
Only execute at pre-identified levels
Use alerts, not emotion
Stick to your RR plan — minimum 1:2
🧠 You’re not paid for how many trades you take, you’re paid for how well you manage risk.
🧠 Weekly FRGNT Insight
"Trade what the market gives, not what your ego wants."
Stay mechanical. Stay focused. Let the probabilities work.
FX:AUDJPY

EUROYENEurjpy has shorter pullbacks within an ascending structure ,shall keep following it and expect it to reach a fair mount of highs or levels
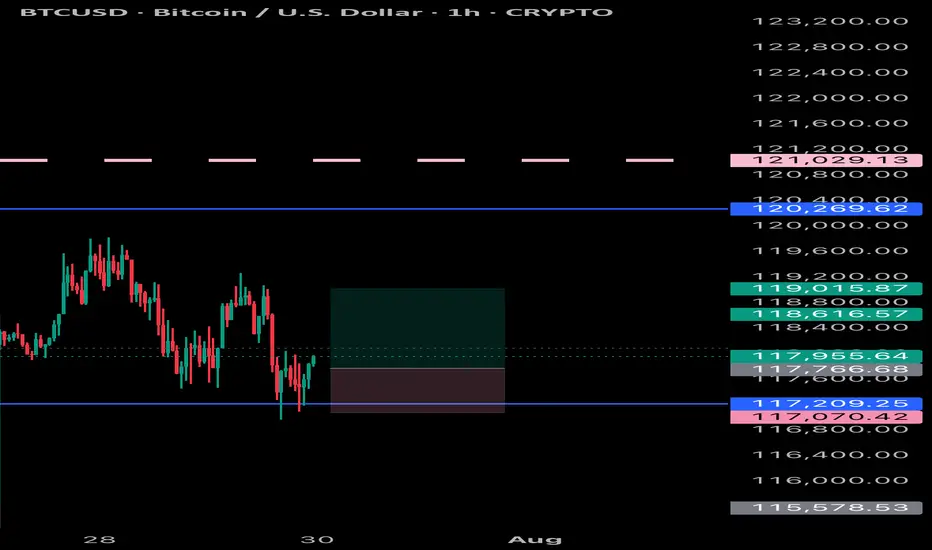
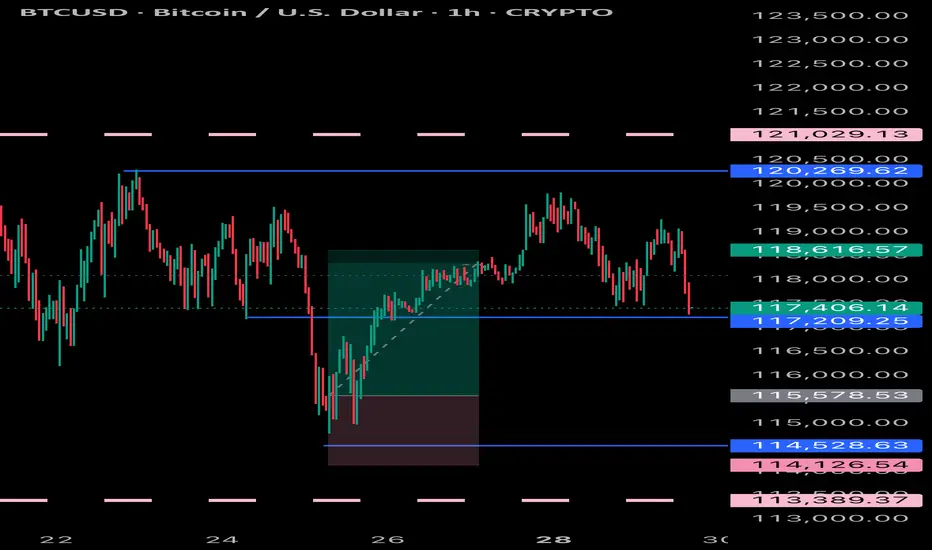
BITCOIN BULLYING Bitcoin hit take profit previously and now I will be looking at another buy within this trend and price action combined with patterns
GOLD GOLDEN XauUsd is now still respecting the trend and will keep holding expecting an even stronger push to the up side
GOLD XAUUSD Gold moving as expected respecting our price and entries, will look for swinging opportunities ,and SL adjustments to BE
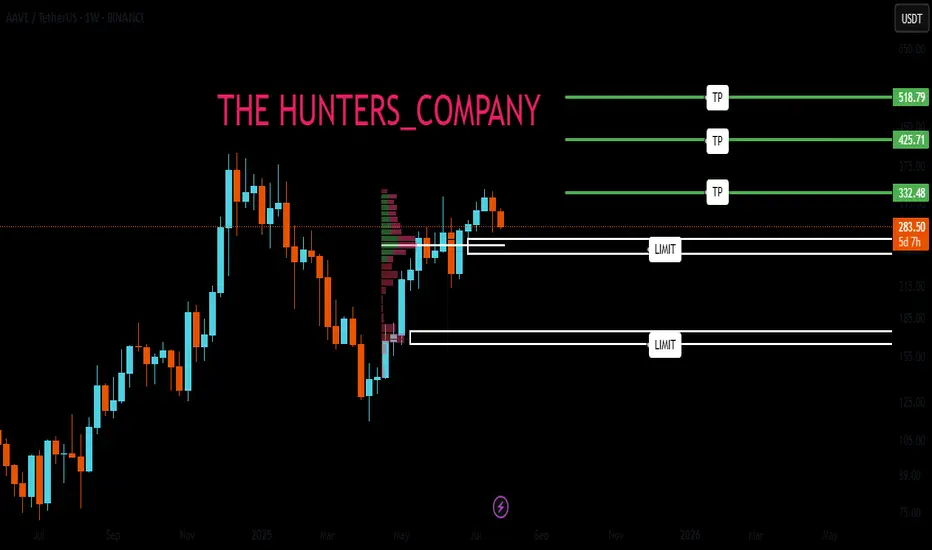
AVVE IS TIME TO BUYHello friends🙌
Given the good growth we had, now in a correction there is a good opportunity for the price to reach our high volume range or even lower and we can buy in steps and with risk and capital management.
🔥Follow us for more signals🔥
*Trade safely with us*
Trendline Liquidity Taken Watching for MSS at Support in EUR/USDEUR/USD has taken liquidity above the previous trendline resistance during the New York session and is now declining. The pair is approaching a key support zone. If it reaches this level and shows a market structure shift (MSS) or any other bullish confirmation, there is potential for a reversal from this zone. In that case, price could move upward toward the marked bearish Fair Value Gap (FVG). Always conduct your own research (DYOR) before making any trading decisions.

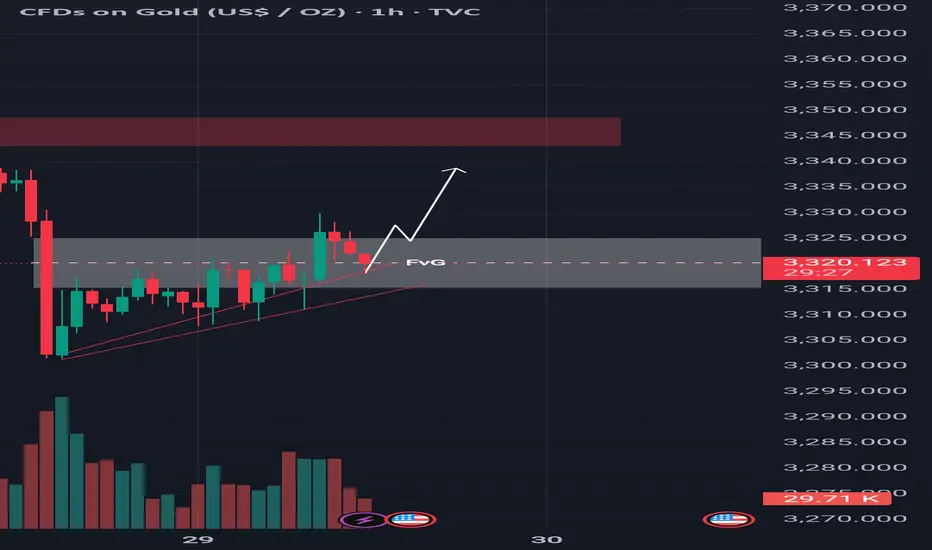
Technical Shift FVG Break and Retest Hints at Further Upside!Gold is currently showing strength after taking support from the trendline, indicating buyers are stepping in around that level. Moreover the price has successfully broken above the 4-hour bearish Fair Value Gap (FVG), which suggests a shift in market sentiment. This FVG zone has now transitioned into an inversion level meaning what was once a resistance area could now act as support. At the moment, the market is pulling back, likely to retest this newly flipped zone. If buyers defend this area on the retest, it could provide the base for a potential bullish continuation. From this zone, we may witness a strong upward move, with the next target likely being the liquidity resting above key resistance levels. As always, it’s important to conduct your own analysis and manage risk accordingly (DYOR).
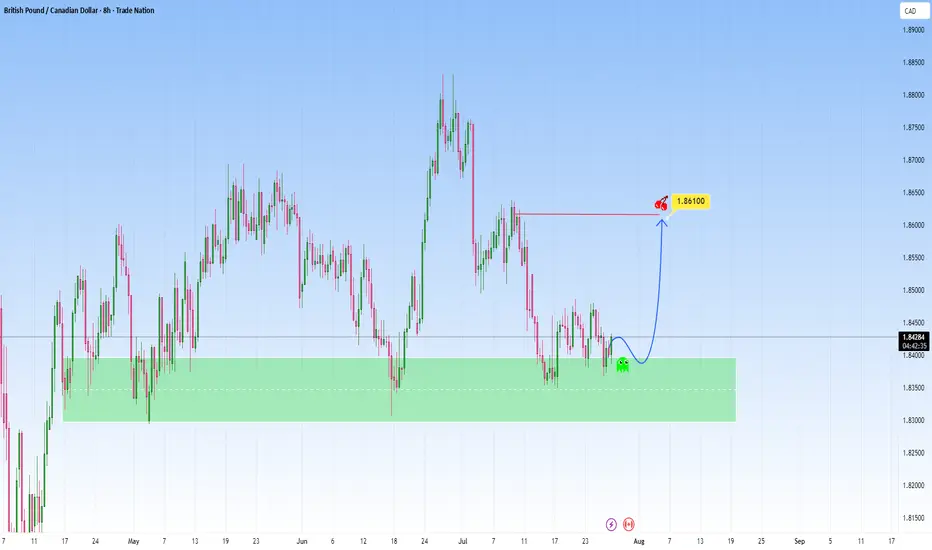
GBPCAD At Support - High probability reversalGBPCAD descended with strength, and has now reached a strong support zone.
Price now hovers above and this zone and is a great indication to use for possible reversal move, that could send price into the 1.86100 level.
But if price breaks below support with momentum, then I’ll back off this bullish bias and reassess, and consider the reversal idea invalidated, with potential for further downside.
Just sharing my thoughts for the charts, this isn’t financial advice. Always confirm your setups and manage your risk properly.
Disclosure: I am part of Trade Nation's Influencer program and receive a monthly fee for using their TradingView charts in my analysis.
EURUSD – DAILY FORECAST Q3 | W31 | D29 | Y25📊 EURUSD – DAILY FORECAST
Q3 | W31 | D29 | Y25
Daily Forecast 🔍📅
Here’s a short diagnosis of the current chart setup 🧠📈
Higher time frame order blocks have been identified — these are our patient points of interest 🎯🧭.
It’s crucial to wait for a confirmed break of structure 🧱✅ before forming a directional bias.
This keeps us disciplined and aligned with what price action is truly telling us.
📈 Risk Management Protocols
🔑 Core principles:
Max 1% risk per trade
Only execute at pre-identified levels
Use alerts, not emotion
Stick to your RR plan — minimum 1:2
🧠 You’re not paid for how many trades you take, you’re paid for how well you manage risk.
🧠 Weekly FRGNT Insight
"Trade what the market gives, not what your ego wants."
Stay mechanical. Stay focused. Let the probabilities work.
FX:EURUSD

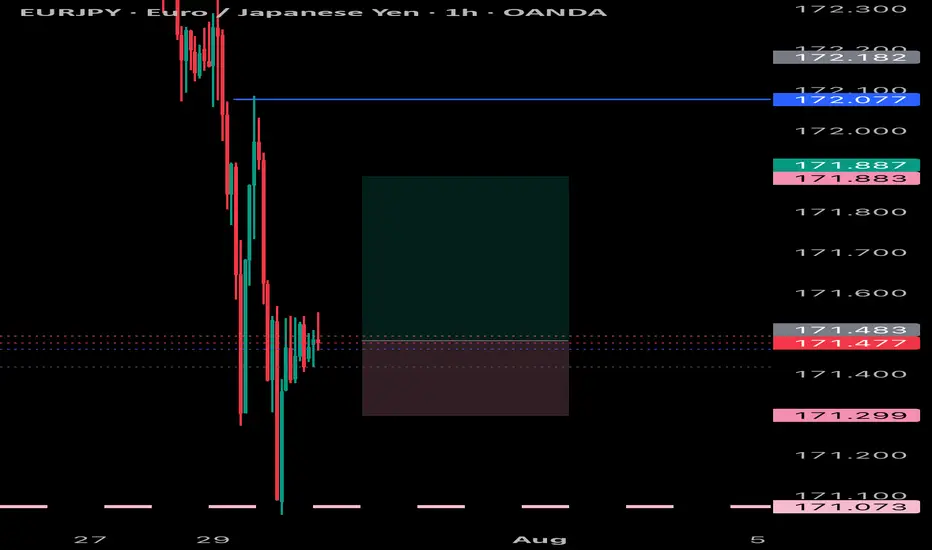
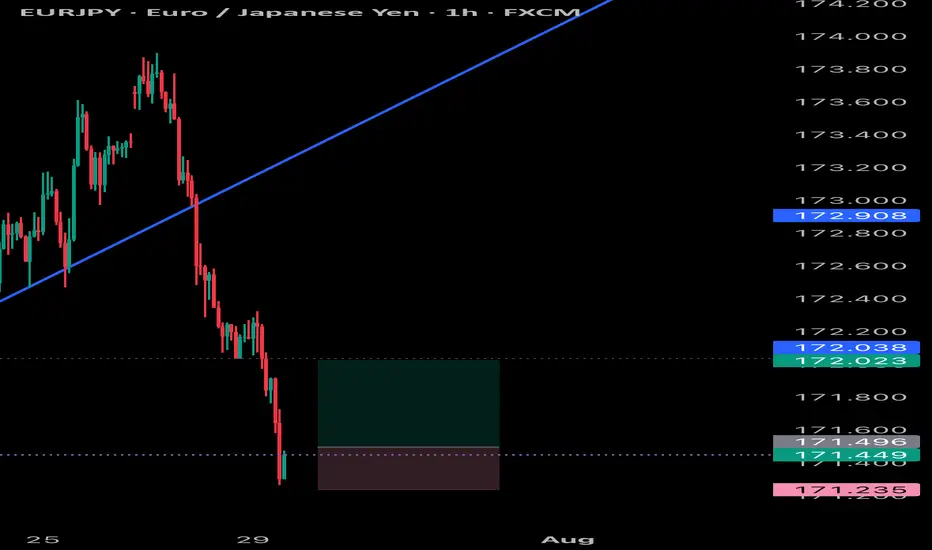
EURJPY SCALP Eurjpy quick scalp trade as it can still drop so it would be wise to not target higher than normal take profits , but will scalp it
USDJPY – DAILY FORECAST Q3 | W31 | D29 | Y25📊 USDJPY – DAILY FORECAST
Q3 | W31 | D29 | Y25
Daily Forecast 🔍📅
Here’s a short diagnosis of the current chart setup 🧠📈
Higher time frame order blocks have been identified — these are our patient points of interest 🎯🧭.
It’s crucial to wait for a confirmed break of structure 🧱✅ before forming a directional bias.
This keeps us disciplined and aligned with what price action is truly telling us.
📈 Risk Management Protocols
🔑 Core principles:
Max 1% risk per trade
Only execute at pre-identified levels
Use alerts, not emotion
Stick to your RR plan — minimum 1:2
🧠 You’re not paid for how many trades you take, you’re paid for how well you manage risk.
🧠 Weekly FRGNT Insight
"Trade what the market gives, not what your ego wants."
Stay mechanical. Stay focused. Let the probabilities work.
OANDA:USDJPY

EURJPY – DAILY FORECAST Q3 | W31 | D29 | Y25📊 EURJPY – DAILY FORECAST
Q3 | W31 | D29 | Y25
Daily Forecast 🔍📅
Here’s a short diagnosis of the current chart setup 🧠📈
Higher time frame order blocks have been identified — these are our patient points of interest 🎯🧭.
It’s crucial to wait for a confirmed break of structure 🧱✅ before forming a directional bias.
This keeps us disciplined and aligned with what price action is truly telling us.
📈 Risk Management Protocols
🔑 Core principles:
Max 1% risk per trade
Only execute at pre-identified levels
Use alerts, not emotion
Stick to your RR plan — minimum 1:2
🧠 You’re not paid for how many trades you take, you’re paid for how well you manage risk.
🧠 Weekly FRGNT Insight
"Trade what the market gives, not what your ego wants."
Stay mechanical. Stay focused. Let the probabilities work.
OANDA:EURJPY

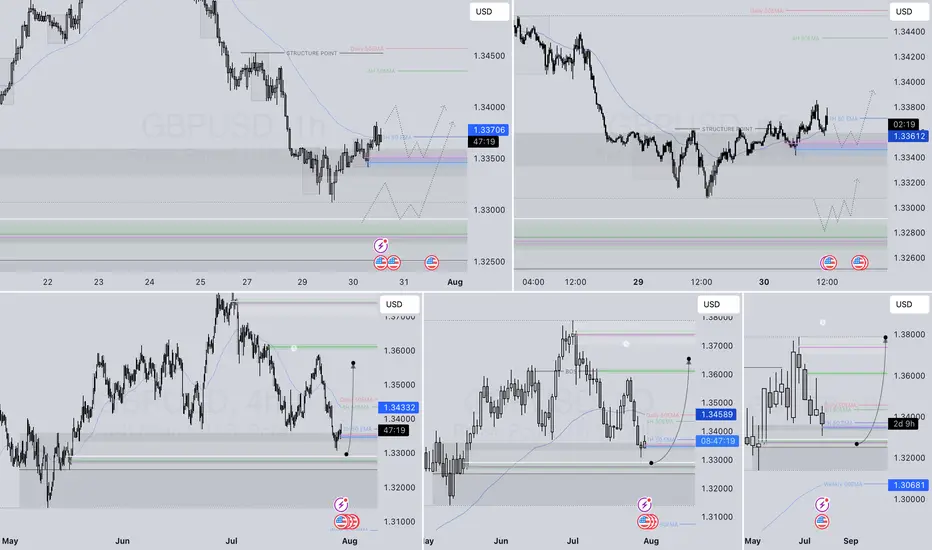
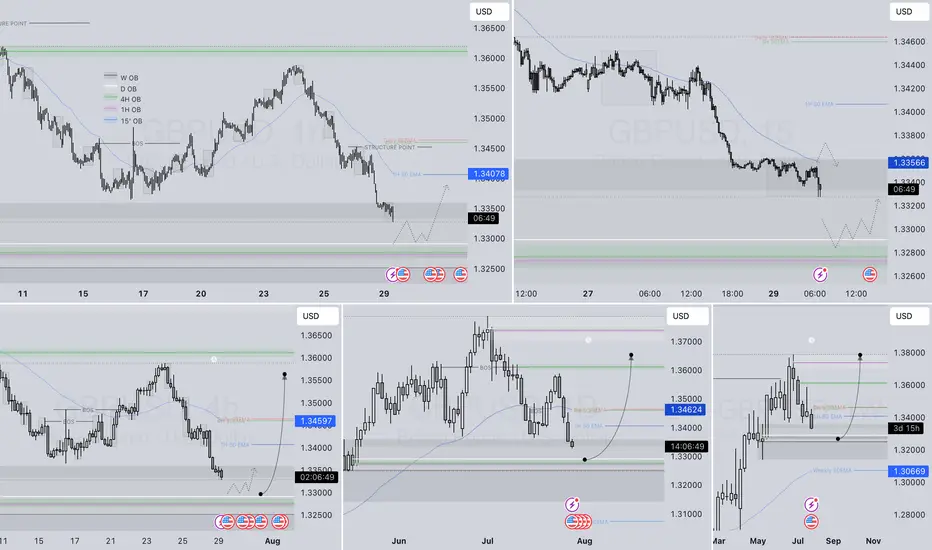
GBPUSD – DAILY FORECAST Q3 | W31 | D29 | Y25📊 GBPUSD – DAILY FORECAST
Q3 | W31 | D29 | Y25
Daily Forecast 🔍📅
Here’s a short diagnosis of the current chart setup 🧠📈
Higher time frame order blocks have been identified — these are our patient points of interest 🎯🧭.
It’s crucial to wait for a confirmed break of structure 🧱✅ before forming a directional bias.
This keeps us disciplined and aligned with what price action is truly telling us.
📈 Risk Management Protocols
🔑 Core principles:
Max 1% risk per trade
Only execute at pre-identified levels
Use alerts, not emotion
Stick to your RR plan — minimum 1:2
🧠 You’re not paid for how many trades you take, you’re paid for how well you manage risk.
🧠 Weekly FRGNT Insight
"Trade what the market gives, not what your ego wants."
Stay mechanical. Stay focused. Let the probabilities work.
FX:GBPUSD
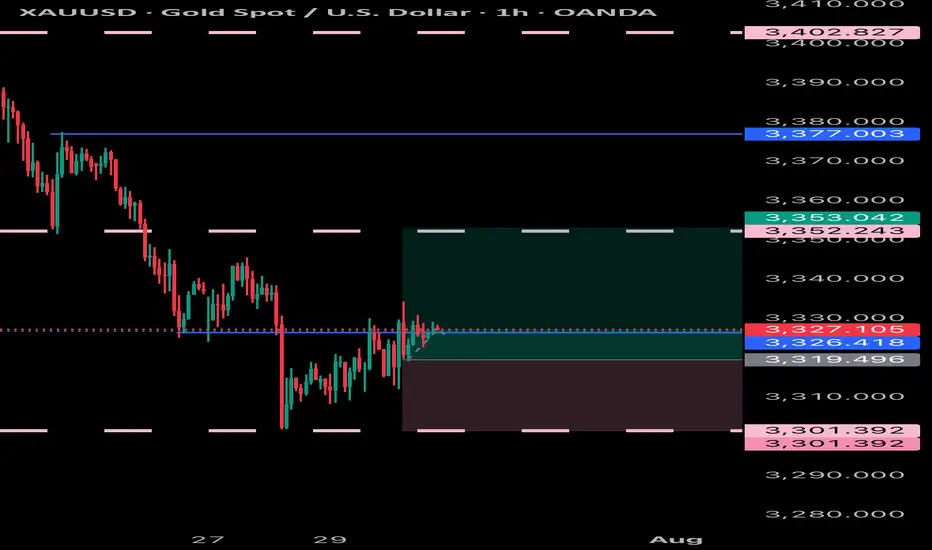
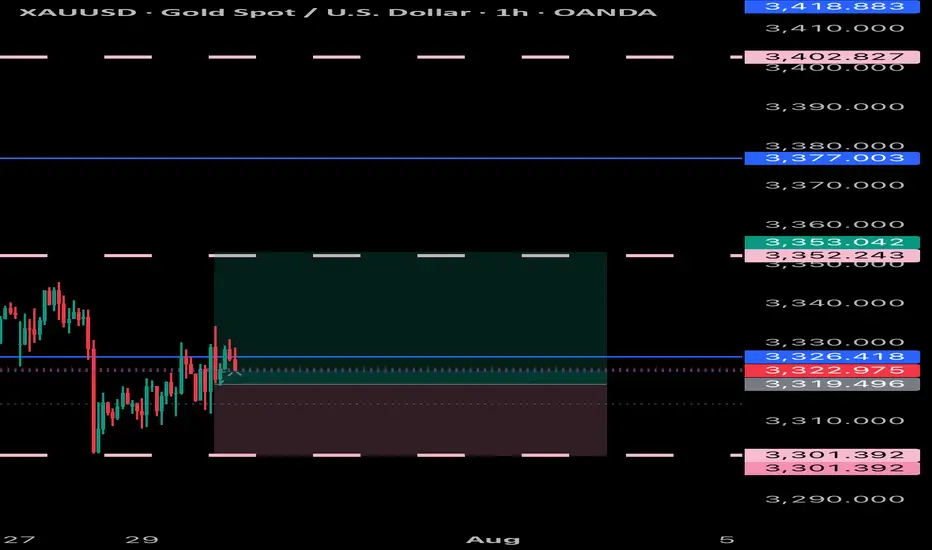
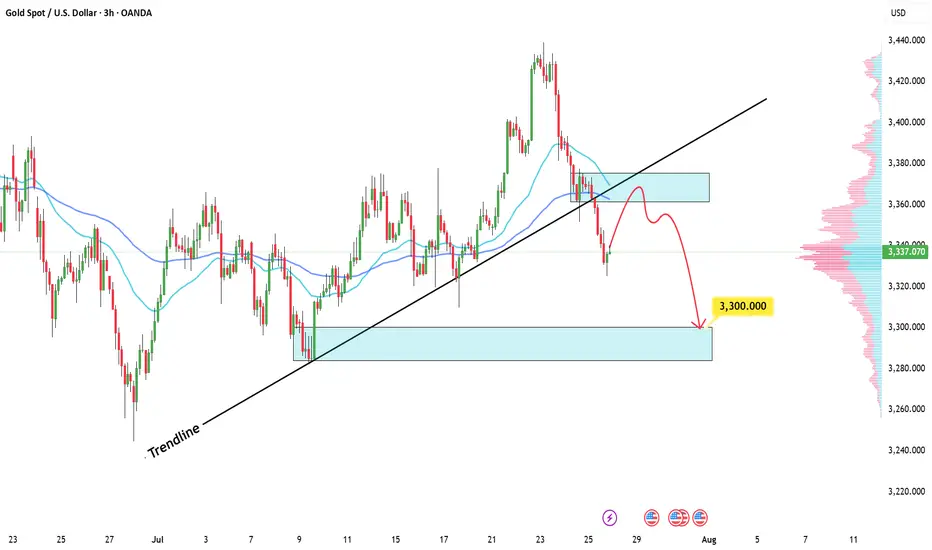
XAUUSD: Bearish Bias SetupI am watching for a possible reversal in XAUUSD, predicting a rejection with a downside target around 3.300.
This downside target is reasonable based on this setup, as it is based on a previous bullish move, from which price could find support and bounce, or break below, and the downside momentum could start to continue down.
I am just sharing my thoughts on the chart, this is not financial advice. Always confirm your setup and manage your risk accordingly.
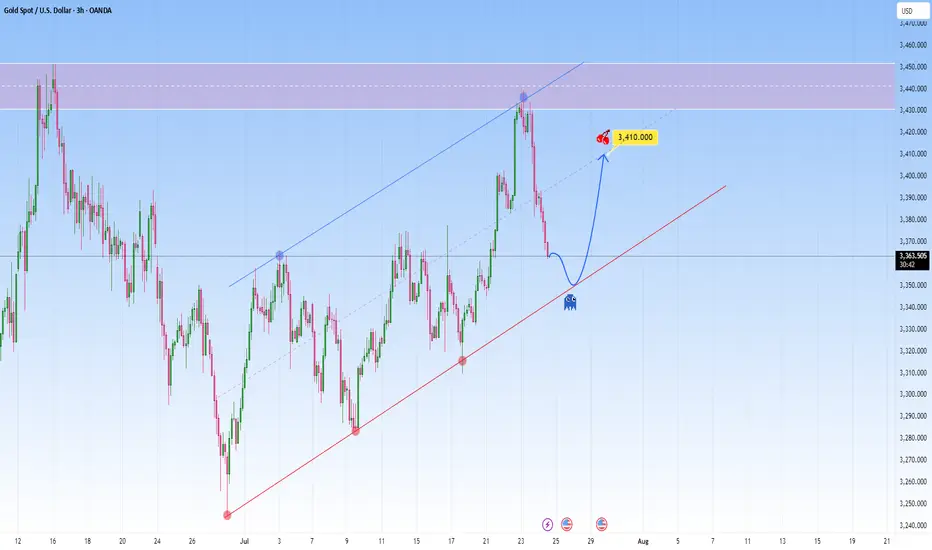
GOLD Reawakened: Corrects firmly but conditions remain bullishFrom a technical perspective Gold is climbing in a parallel channel, clearly bullish with a rhythm that’s hard to ignore. Price just bounced off the resistance with force, a classic overextension flush.
And the market is now approaching the lower boundary of this projected channel. This confluence of technical support is likely to attract renewed buying interest.
I expect it to bounce back toward 3,410, somewhere around the middle of the channel. The move up may not be determined right away. It could be consolitaing, fake dips first, or sudden acceleration.
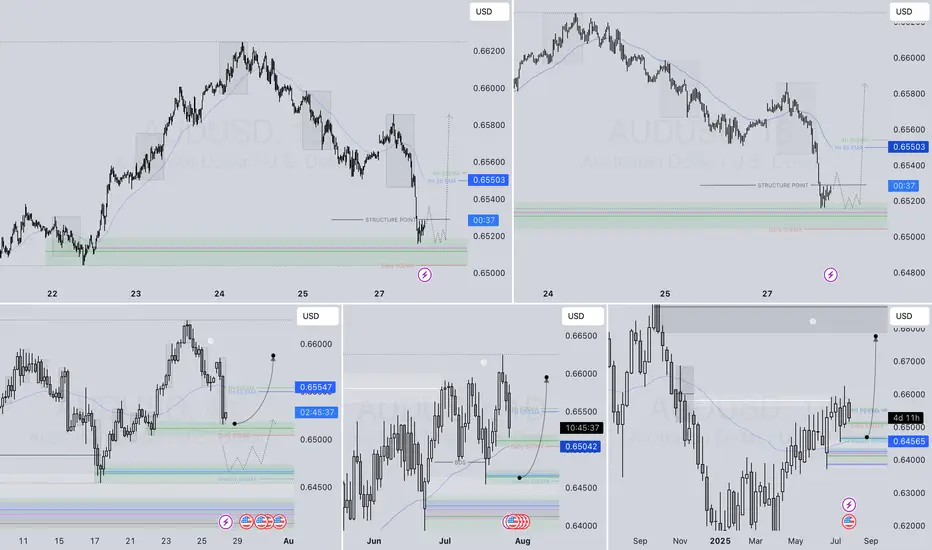
AUDUSD – DAILY FORECAST Q3 | W31 | D28 | Y25AUDUSD – DAILY FORECAST
Q3 | W31 | D28 | Y25
Daily Forecast 🔍📅
Here’s a short diagnosis of the current chart setup 🧠📈
Higher time frame order blocks have been identified — these are our patient points of interest 🎯🧭.
It’s crucial to wait for a confirmed break of structure 🧱✅ before forming a directional bias.
This keeps us disciplined and aligned with what price action is truly telling us.
📈 Risk Management Protocols
🔑 Core principles:
Max 1% risk per trade
Only execute at pre-identified levels
Use alerts, not emotion
Stick to your RR plan — minimum 1:2
🧠 You’re not paid for how many trades you take, you’re paid for how well you manage risk.
🧠 Weekly FRGNT Insight
"Trade what the market gives, not what your ego wants."
Stay mechanical. Stay focused. Let the probabilities work.
FX:AUDUSD
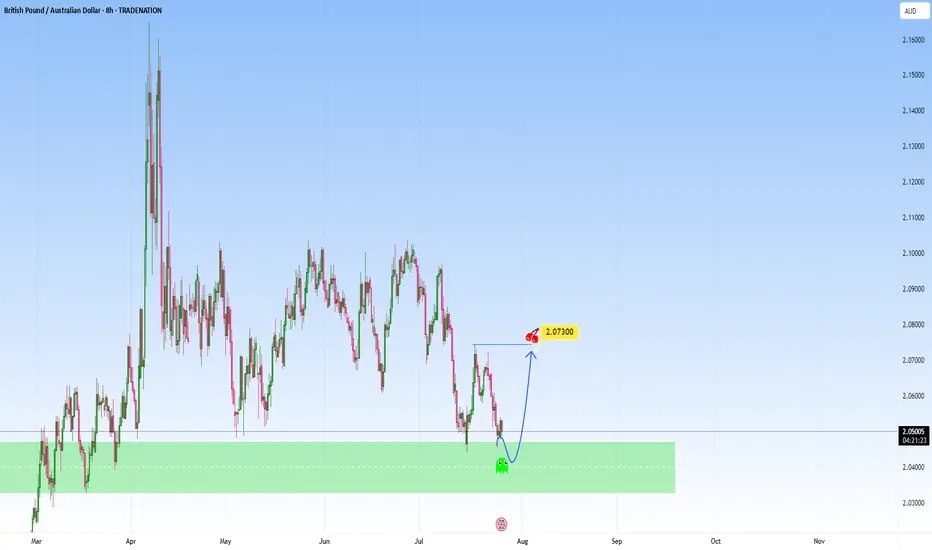
GBPAUD: Possible bounce at supportI am watching for a possible reversal GBPAUD, expecting a rejection with a upside target at around 2.073.
This area is where it can become a decision point, either price finds support and bounces, or it breaks below, and the move can start to extend lower.
Just sharing my thoughts for the charts, this isn’t financial advice. Always confirm your setups and manage your risk properly.
Disclosure: I am part of Trade Nation's Influencer program and receive a monthly fee for using their TradingView charts in my analysis.