Solana: Intra-week Setup Locked In I’m targeting an intra-week play on Solana, but staying cautious. That’s why I’m using a tighter stop-loss and placing my entry slightly lower. Still, this is a strong level for me because multiple key factors are lining up.
We have the midpoint of the 30-minute Fair Value Gap, an untouched VWAP (which I’ve hidden to avoid clutter), the VAL from VWAP (Volume Area Low), and a huge liquidity zone above the Previous Weekly High, including an order block – acting as a potential magnet.
On the 30-minute time frame, the RSI is trending further into oversold territory, adding more confluence to the setup. Lower time frames are still looking bullish, as long as we hold this level. If not, things could get messy. But until then, everything looks solid.
Freesignals

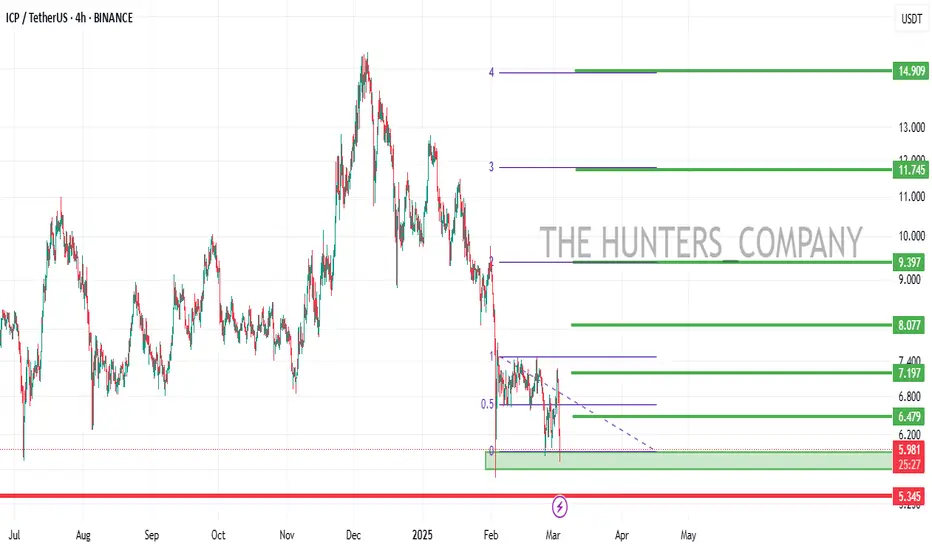
ICP/USDT(BUY)hello friends
Despite the fall of this currency, we are now at the price floor and good conditions have been provided for buying, of course, with capital management...
*Trade safely with us*
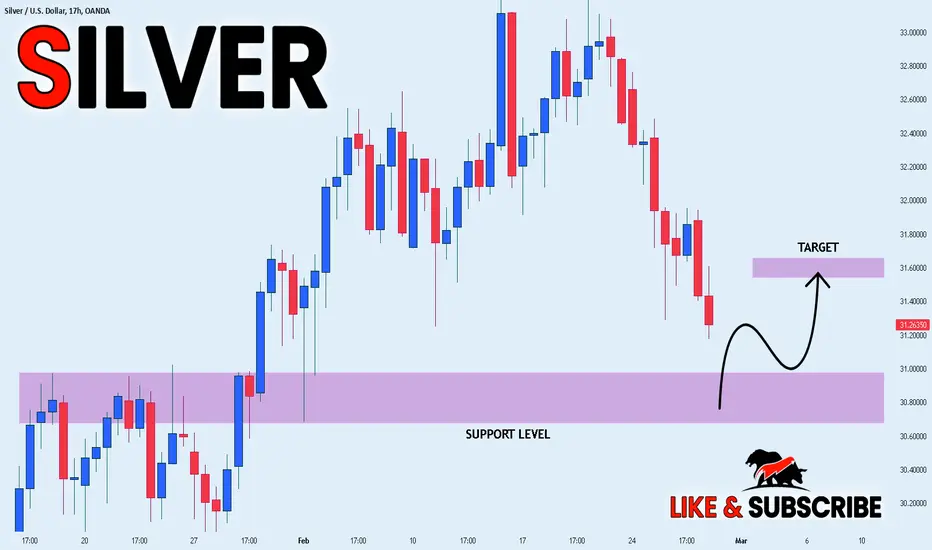
SILVER SUPPORT AHEAD|LONG|
✅SILVER is approaching a demand level of 30.80$
So according to our strategy
We will be looking for the signs of the reversal in the trend
To jump onto the bullish bandwagon just on time to get the best
Risk reward ratio for us
LONG🚀
✅Like and subscribe to never miss a new idea!✅
GBP/USD Bullish Recovery – Key Levels for a Breakout & ReversalHello, buddies.
Given the decline, the price has now established a solid floor, and we expect it to continue growing; nevertheless, we must enter a price correction, therefore we have selected the best possible support point for you...
We will wait for a new ceiling to be registered before proceeding with the purchase transaction, but with careful risk and capital management.
*Trade safely with us*
Overview:
The GBP/USD 4-hour chart shows a potential bullish reversal after a significant downtrend. Price has formed a double-bottom pattern and has broken out of a descending trendline, signaling a shift in momentum. The chart highlights key areas of support and resistance that traders should watch for confirmation of a sustained move higher.
Key Technical Analysis:
Fake Breakout: A false breakdown below the trendline in August led to a sharp recovery, confirming a liquidity grab before a bullish continuation.
Trendline Breakout: The price has successfully broken the descending trendline (orange line), indicating potential bullish strength.
Support Zones:
Blue Zone (~1.2450 - 1.2500): A strong demand area where buyers may re-enter.
Purple Zone (~1.2120 - 1.2200): A deeper support level, acting as the last line of defense for bulls.
Fibonacci Levels & Targets:
1.2785: First key resistance level.
1.3022: A major resistance and potential breakout zone.
1.3242: Final bullish target if momentum continues.
Trade Plan:
📌 Buy Limit Entry: Around 1.2450-1.2500 (if price retests the support zone).
🎯 Target 1: 1.2785
🎯 Target 2: 1.3022
🎯 Target 3: 1.3242
🛑 Stop Loss: Below 1.2400 to minimize risk.
Conclusion:
The GBP/USD pair is showing signs of a potential bullish reversal. A short-term pullback to the blue support zone could provide an optimal buying opportunity before a strong upward move. However, a break below 1.2400 could invalidate this bullish setup, leading to a deeper correction.
🚀 Bullish Bias if Key Support Holds! 🚀

GBPUSD Analysishello friends
Considering the drop we had, now the price has made a good floor and we expect it to continue its growth, but we have to enter into price correction, so we identified the best possible support point for you...
We will wait for a new ceiling to be registered and then enter into the purchase transaction, but with risk and capital management.
*Trade safely with us*

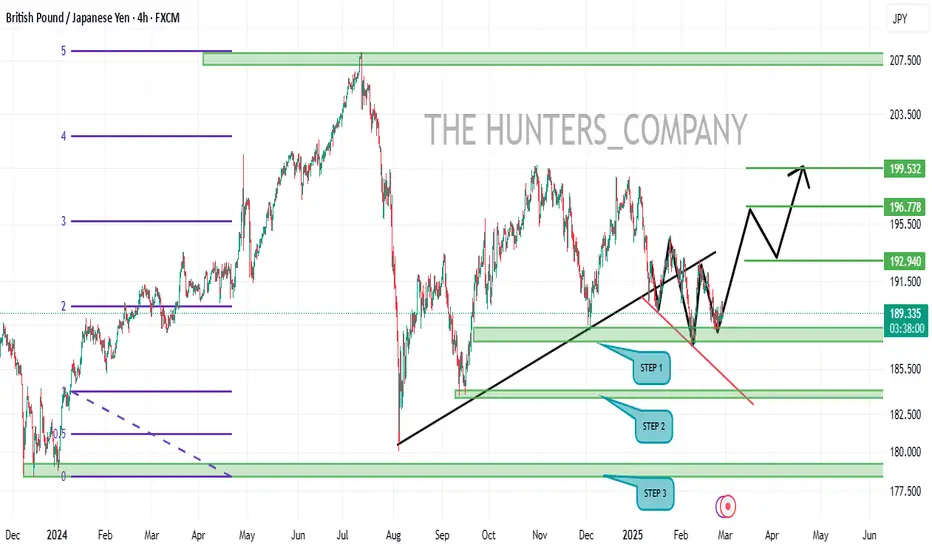
GBP/JPY BUY ...hello friends
Considering the good growth we had, now that we are correcting the price, we can buy as a bridge and move with it until the specified goals.
Or if you are more professional, you can react on every step of support...
*Trade safely with us*
USOIL BUY!!!hello friends
As you can see, this chart is very, very patternable.
Now, with the floor construction that we expect from it, the growth to the resistance areas has been determined.
*Trade safely with us*

NZDCAD: Pullback Trade Confirmed?! 🇳🇿🇨🇦
NZDCAD may bounce from the underlined key support.
As a confirmation signal, I see a nice bullish Change of Character CHoCH
on an hourly time frame after its text.
Target - 0.8185
❤️Please, support my work with like, thank you!❤️

GOLD UPCOMING TREND READ IN CAPTIONThis 4-hour chart of Gold (XAU/USD) shows a recent pullback from the resistance level at 2,920.364, with a key support zone around2,847.153, highlighted as a buy zone. Fibonacci retracement levels are also shown, with the price currently testing the 0.382 level at 2,871.969. The chart suggests a potential retest in the area between2,887.470 and $2,890.000 before a possible bounce toward higher resistance levels. The breakout above the recent high could lead to further gains, but a pullback toward support levels is expected first

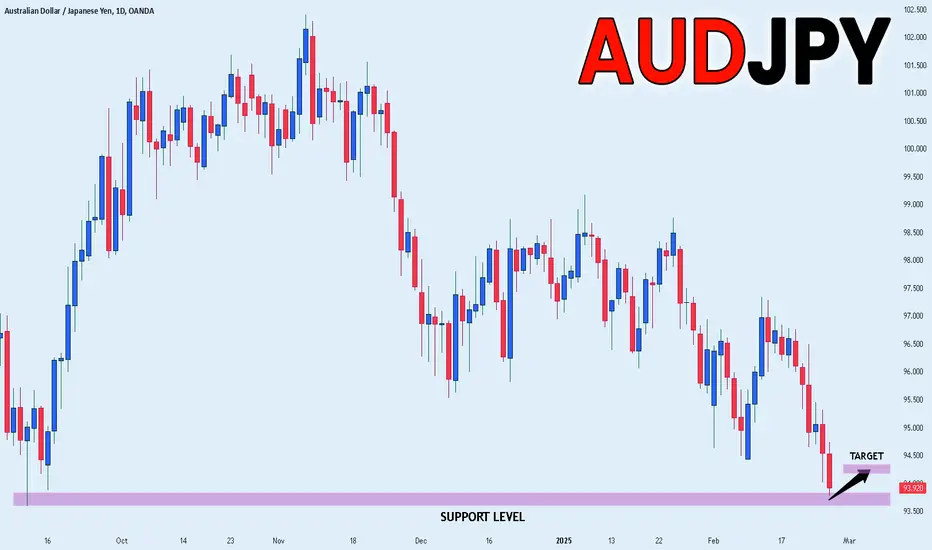
AUD_JPY SWING LONG|
✅AUD_JPY has been falling recently
And the pair seems locally oversold
So as the pair is approaching a horizontal support of 93.500
Price growth is to be expected
LONG🚀
✅Like and subscribe to never miss a new idea!✅
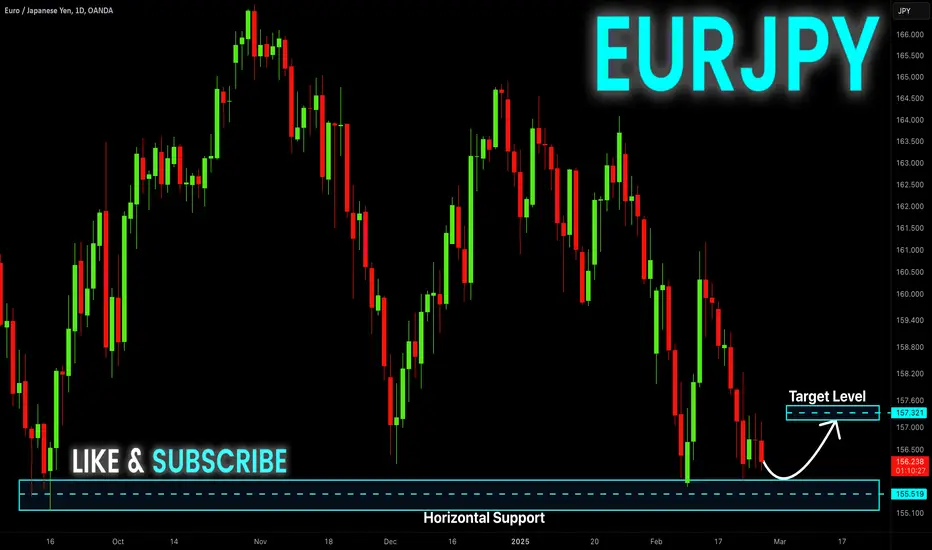
EUR-JPY Long From Support! Buy!
Hello,Traders!
EUR-JPY is trading in a
Strong downtrend but
A horizontal support
Level is ahead so after
A retest we will be expecting
A local bullish move up
Buy!
Comment and subscribe to help us grow!
Check out other forecasts below too!
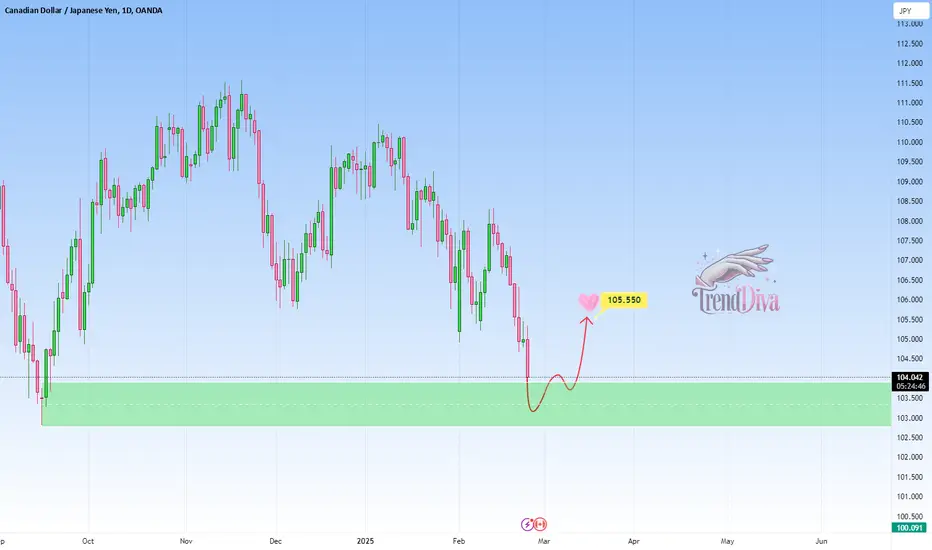
CADJPY - Potential buying opportunity in sightOANDA:CADJPY is trading near a clear support level that triggered bullish reversals in the past. The recent bearish move into this area creates a potential opportunity for buyers to regain control.
If bullish confirmation appears, such as increased buying volume or candlestick reversal patterns, I expect the price to move toward 105.550. On the other hand though, a break below this support would weaken the bullish scenario and suggest further downside.
Just my take on support and resistance zones—not financial advice.
Best of luck in the markets.
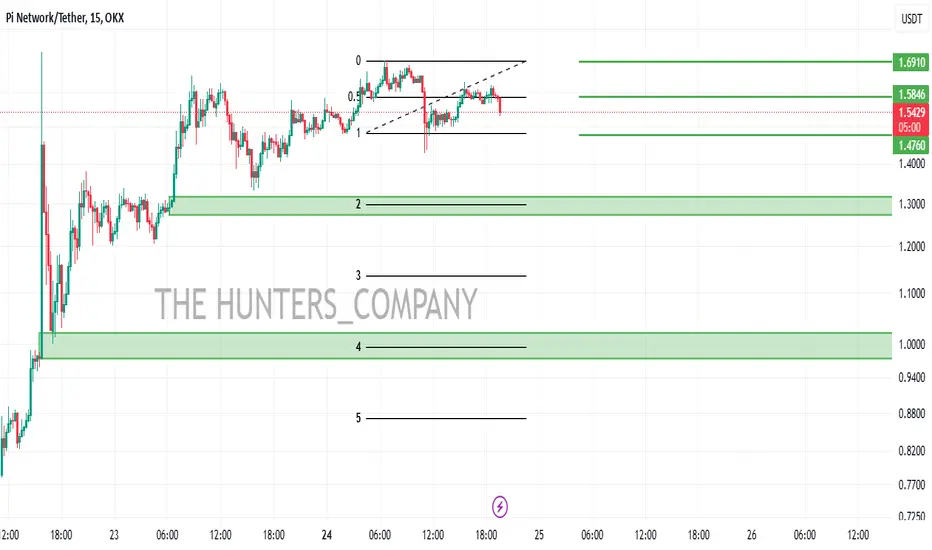
PI Network token purchase pointshello friends
Due to the good growth of this token, now in case of correction, we can buy step by step within the specified limits and move with it to the specified goals.
*Trade safely with us*
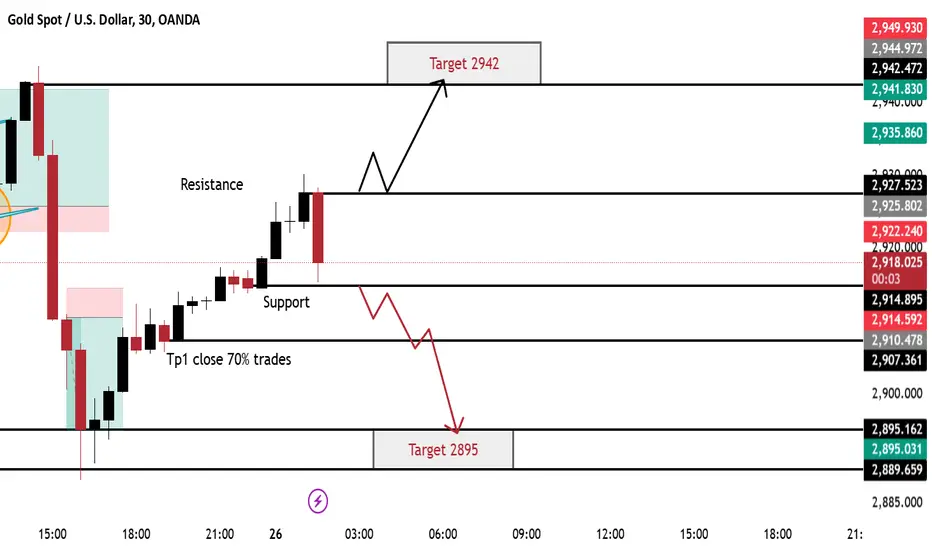
XAUUSD SIGNAL 26/02/2025🚨 Attention Traders! 🚨
🟡 Gold is in a no-trade zone! 🛑 Stay patient as we monitor key levels.
📊 Critical Zone: 2915 - 2927 (Support & Resistance)
🔻 Bearish Breakout? If the price drops below 2915, we’ll target:
🎯 TP1 = 2907, TP2= 2895
🔺 Bullish Breakout? A move above 2927 signals upward momentum:
🎯 TP1 = 2942
🔥 Stay sharp & trade wisely! 💰📈
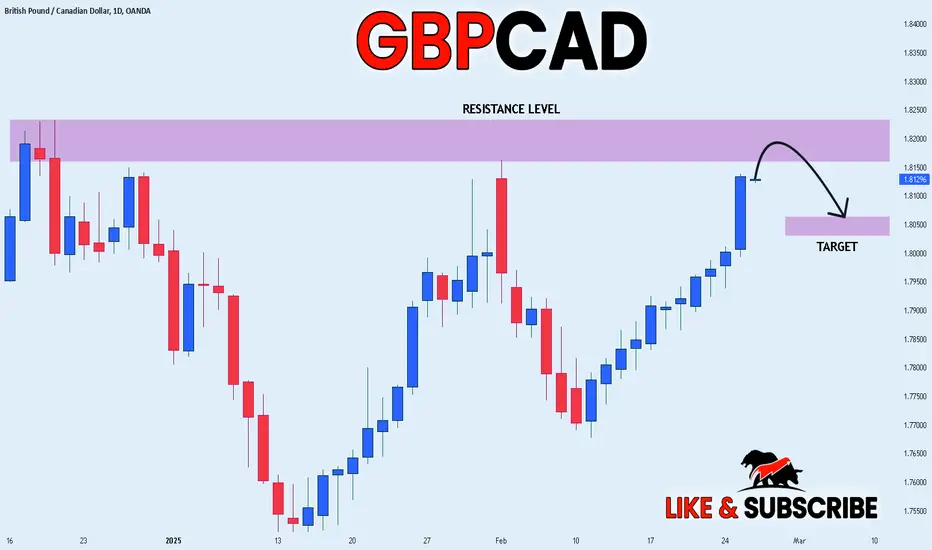
GBP_CAD RESISTANCE AHEAD|SHORT|
✅GBP_CAD has been growing recently
And the pair seems locally overbought
So as the pair is approaching a horizontal resistance of 1.8233
Price decline is to be expected
SHORT🔥
✅Like and subscribe to never miss a new idea!✅
EURAUD - Short Setup at Key ResistanceOANDA:EURAUD is approaching a significant resistance area that has before reversed bullish trends. The current upward move into this zone suggests potential selling opportunities if rejection signals appear, such as bearish engulfing candles or upper wicks.
I find that a move toward 1.65180 is likely.
A break above this resistance, however, could indicate a shift in market sentiment.
Just my take on support and resistance zones—not financial advice.
Always confirm your setups and trade with solid risk management.

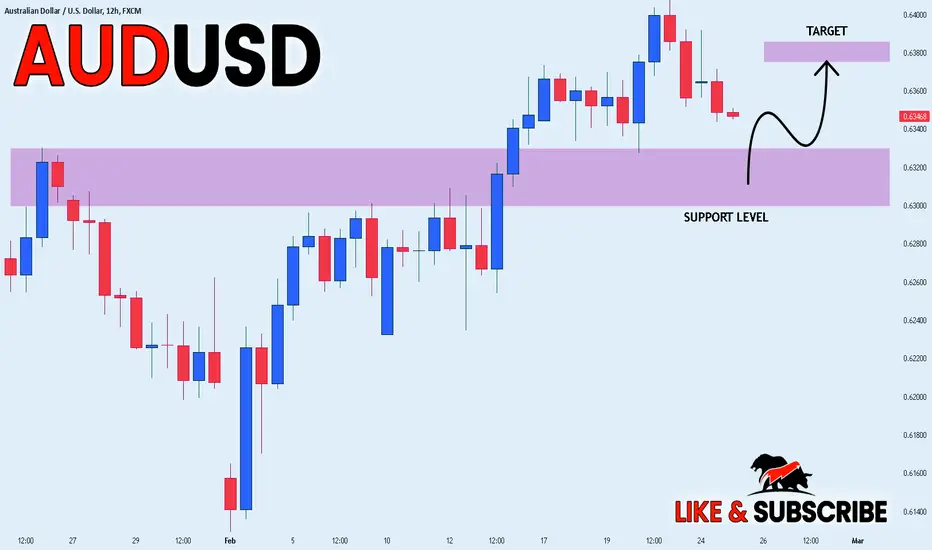
AUD_USD LONG FROM SUPPORT|
✅AUD_USD will soon retest a key support level of 0.6320
So I think that the pair will make a rebound
And go up to retest the supply level above at 0.6380
LONG🚀
✅Like and subscribe to never miss a new idea!✅
GOLD Bullish Bias! Buy!
Hello,Traders!
GOLD is making a bullish
Rebound from the support
Cluster of rising and horizontal
Support levels so as Gold is
Trading in an uptrend we are bullish
Biased and we will be expecting
A further bullish move up
Buy!
Comment and subscribe to help us grow!
Check out other forecasts below too!
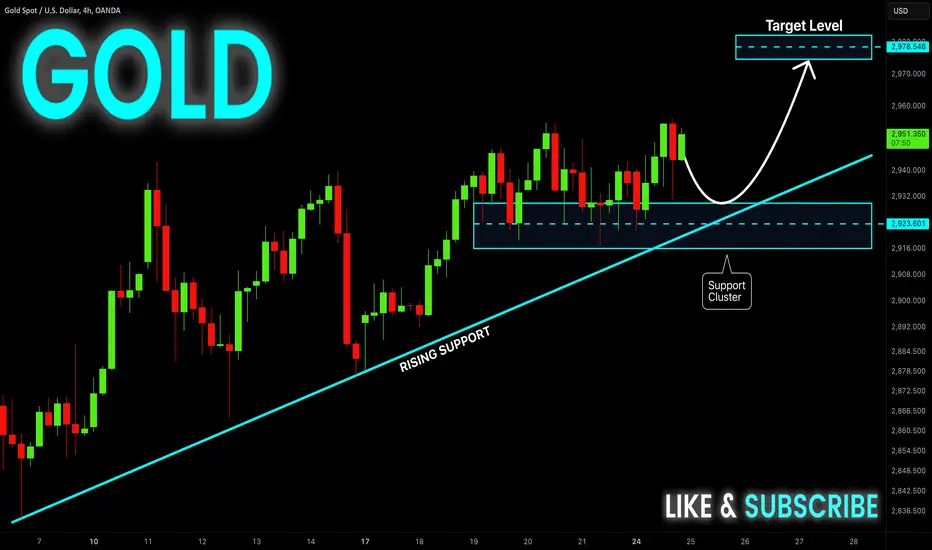
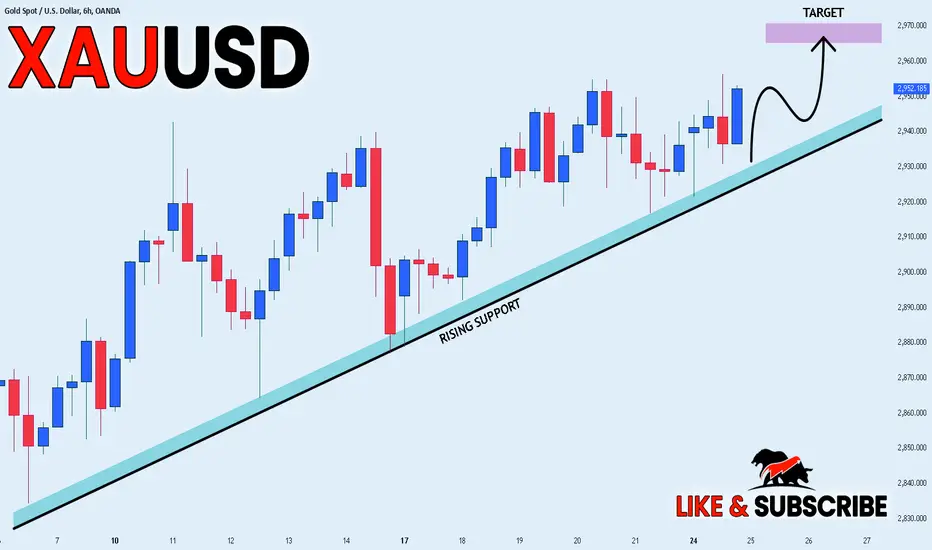
GOLD GROWTH AHEAD|LONG|
✅GOLD is trading in an
Uptrend along the rising
Support and we are already
Seeing a bullish rebound
So we will be expecting
A further bullish move up
LONG🚀
✅Like and subscribe to never miss a new idea!✅
BITCOIN : Important support for the price of the last hope!hello friends
With Bit analysis, we have two scenarios:
1_ The price will return to the important support of 92 thousand dollars or even 90 thousand dollars and from there I will see the growth of the new wave of bit.
2- The important support price should break and continue to fall, and within the specified range with confirmation, we can enter a new upward wave.
What do you think? Will important support be lost?
In our opinion, due to the continuation of the trend and because the volume of sales has not happened, the first scenario is more likely and its target is 115-120 thousand dollars.
*Trade safely with us*

GBPUSD: Short Setup at Key ResistanceOANDA:GBPUSD is nearing a key supply zone that has been a critical area for bearish reversals in the past. The current price action suggests sellers may regain control at this resistance level.
If bearish patterns appear, such as long upper wicks or bearish engulfing candles, I anticipate a move toward 1.25890.
However, if the price successfully breaks and holds above the zone, this would invalidate the bearish outlook and might indicate further upside.
Proper risk management is essential, given the possibility of price breaking higher.
Just my take on support and resistance zones—not financial advice. Always confirm your setups and trade with solid risk management!

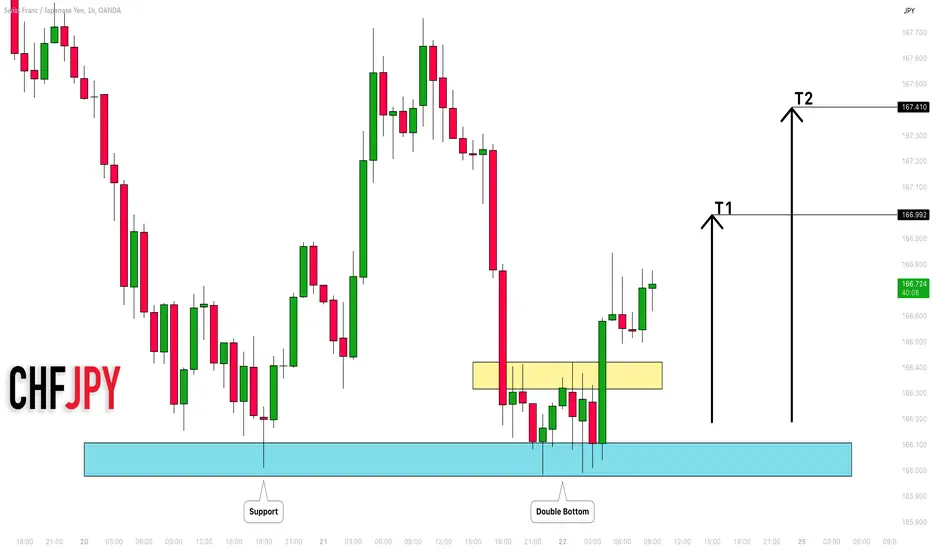
CHFJPY: Pullback From Support 🇨🇭🇯🇵
CHFJPY looks bullish after a test of a key horizontal support.
As a confirmation, I identified a double bottom pattern
on an hourly.
Its neckline was violated with the market opening today.
I believe that the pair will continue rising at least to 167.0 level.
❤️Please, support my work with like, thank you!❤️
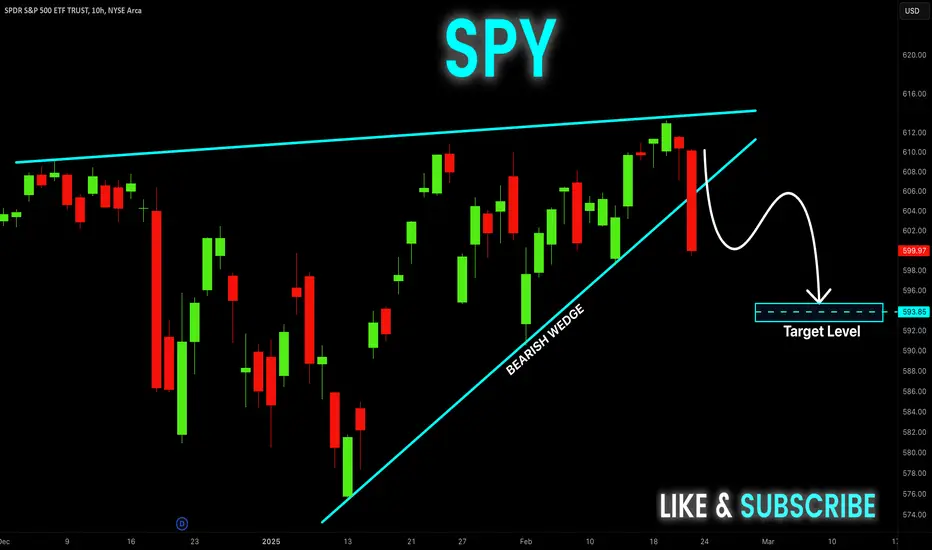
SPY Bearish Breakout! Sell!
Hello,Traders!
SPY was trading in an
Uptrend but then the index
Made a bearish breakout
From the bearish wedge
Pattern and we are locally
Bearish biased and we will
Be expecting a local
Bearish move down
Sell!
Comment and subscribe to help us grow!
Check out other forecasts below too!