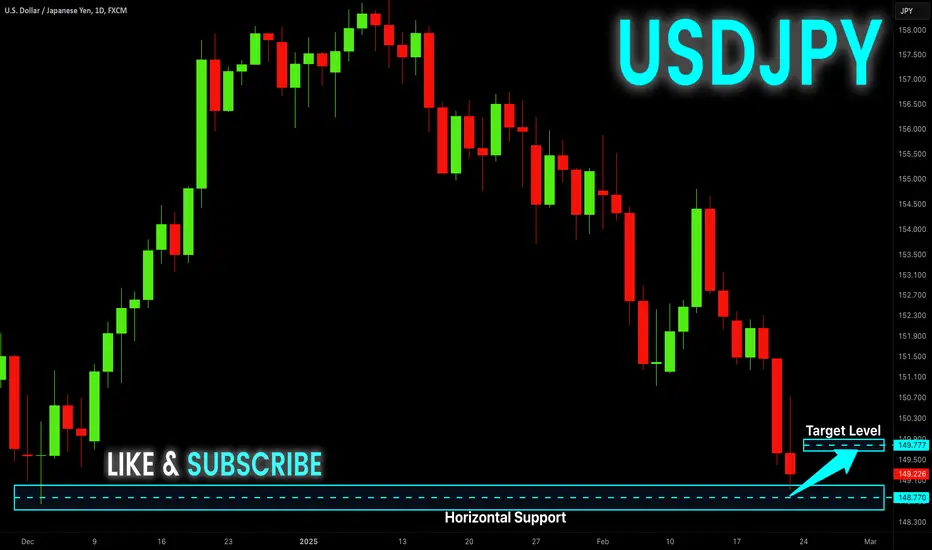
USD-JPY Will Grow! Buy!
Hello,Traders!
USD-JPY has almost
Reached a horizontal
Support level of 148.530
After trading in a strong
Downtrend for some time
So a local bullish correction
Is to be expected with the
Aim of retesting the
Target level above at 149.665
Buy!
Comment and subscribe to help us grow!
Check out other forecasts below too!
Freesignals
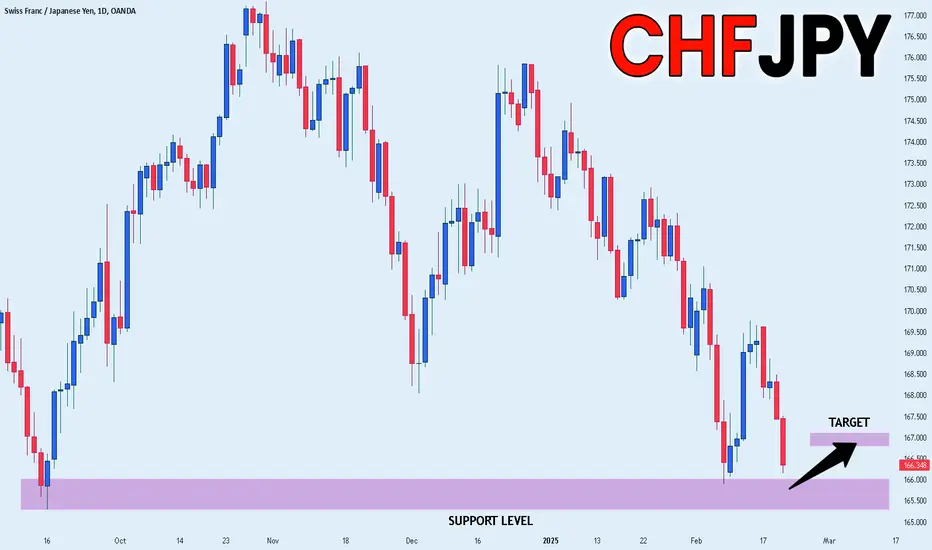
CHF/JPY Analysis | Potential Reversal or Continuation ? CHF/JPY Technical Analysis & Forecast
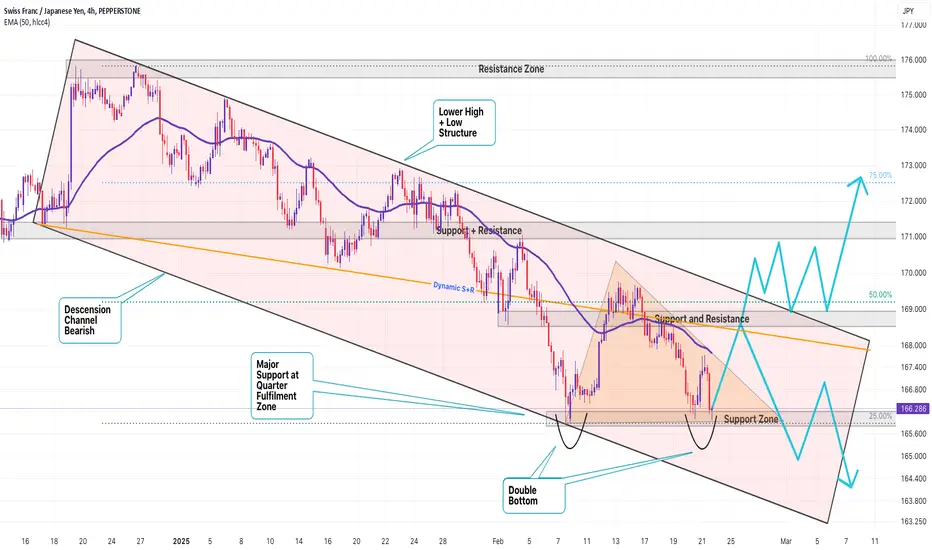
📉 Market Overview: Swiss Franc / Japanese Yen (CHF/JPY) – 4H Chart : The pair is currently trading within a well-defined descending channel, signaling a sustained bearish trend. The price action has consistently followed a lower high and lower low structure, confirming the prevailing downtrend.
However, recent price movements suggest potential signs of reversal as the pair approaches a key support zone. Let’s dive into the details.
🔍 Key Technical Highlights:
✅ Descending Channel: The market has been respecting a downward sloping trendline, indicating ongoing bearish pressure.
✅ Major Support Zone: The pair has tested a crucial quarter fulfillment level, a historically strong support area.
✅ Double Bottom Formation: A potential reversal pattern is forming, hinting at a possible upward move.
✅ 50 EMA Acting as Dynamic Resistance: The price remains below the 50-period Exponential Moving Average, a key level to watch for bullish confirmation.
✅ Resistance Levels: The 169.000 (50% Fib) and 172.000 (75% Fib) levels are the next upside targets if buyers gain control.
📊 Prediction & Outlook:
🔹 Bullish Scenario: A successful break above dynamic support/resistance and the 50 EMA could trigger a bullish move toward 169.000 and potentially 172.000.
🔹 Bearish Scenario: Failure to hold the current support could see the pair continue its downward trajectory within the channel, with potential targets around 163.250.
🔹 Key Confirmation Point: A breakout above the support & resistance zone (~168.000) would strengthen bullish momentum, while a rejection could lead to further downside.
📢 Trader’s Takeaway:
🔹 Short-term traders should watch for confirmation of the double bottom breakout.
🔹 Swing traders may look for opportunities within the current channel structure, capitalizing on both reversals and trend continuations.
🔹 Risk management is crucial; a break below 166.000 may invalidate bullish setups.
Stay tuned for more updates and trade wisely!
🚀 Follow me for real-time insights and forecasts.
OANDA:CHFJPY FX:CHFJPY VANTAGE:CHFJPY
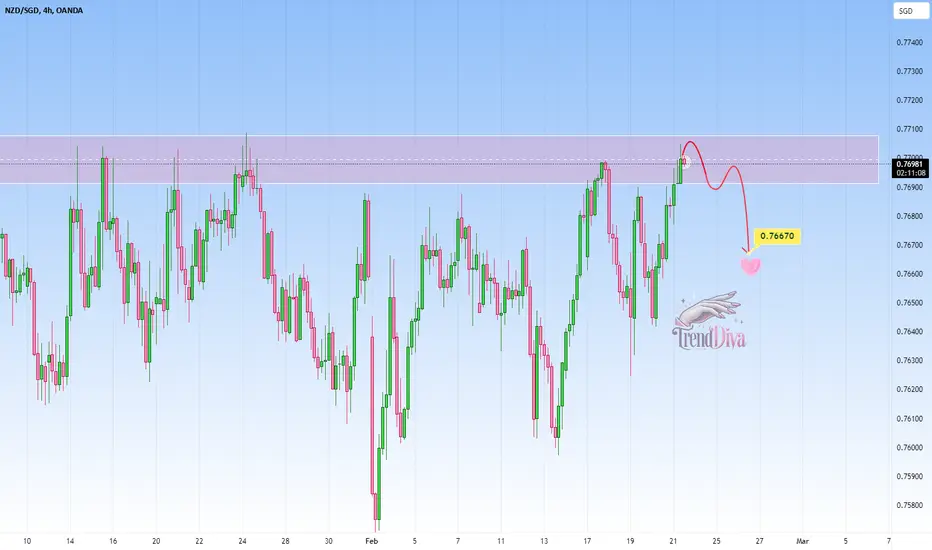
NZDSGD at Key Resistance – Will Sellers Step In? OANDA:NZDSGD has reached a significant resistance zone. This area has historically acted as a supply zone, increasing the likelihood of a pullback if sellers step in.
The current market structure suggests that if the price confirms a rejection from this resistance, we might see a move lower toward the 0.76670 level , a clear target based on past price behavior and current market structure.
Just my take on support and resistance zones—not financial advice. Always confirm your setups and trade with solid risk management.
Best of luck!
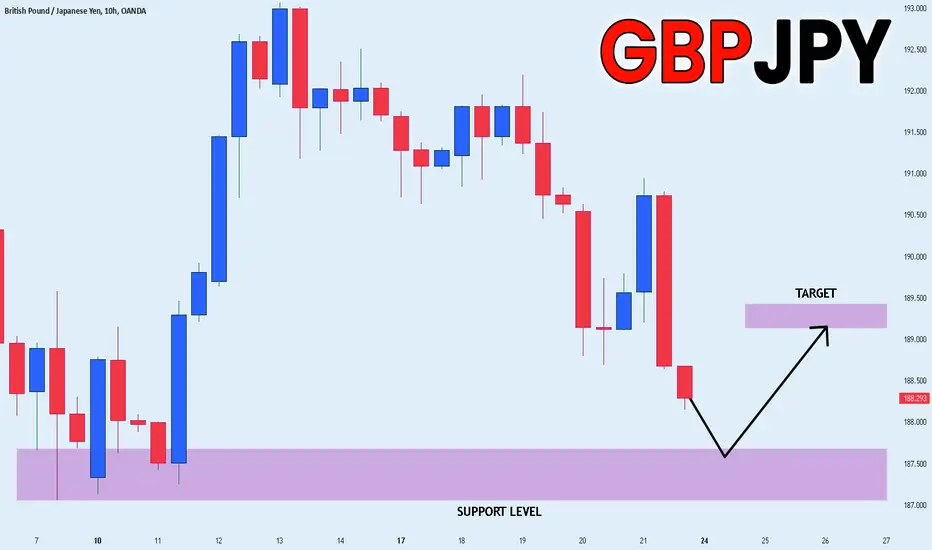
GBP_JPY SUPPORT AHEAD|LONG|
✅GBP_JPY is set to retest a
Strong support level below at 187.066
After trading in a local downtrend from some time
Which makes a bullish rebound a likely scenario
With the target being a local resistance above at 189.186
LONG🚀
✅Like and subscribe to never miss a new idea!✅
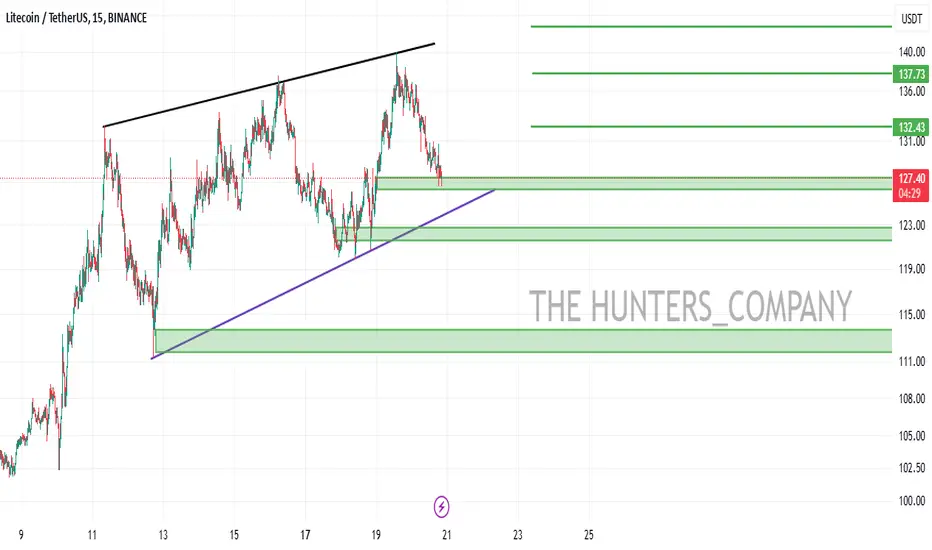
LTC BUYhello guys
Considering the good growth of the price and after its correction, now is a good opportunity to enter into a transaction with capital management.
We have specified a target for you.
*Trade safely with us*

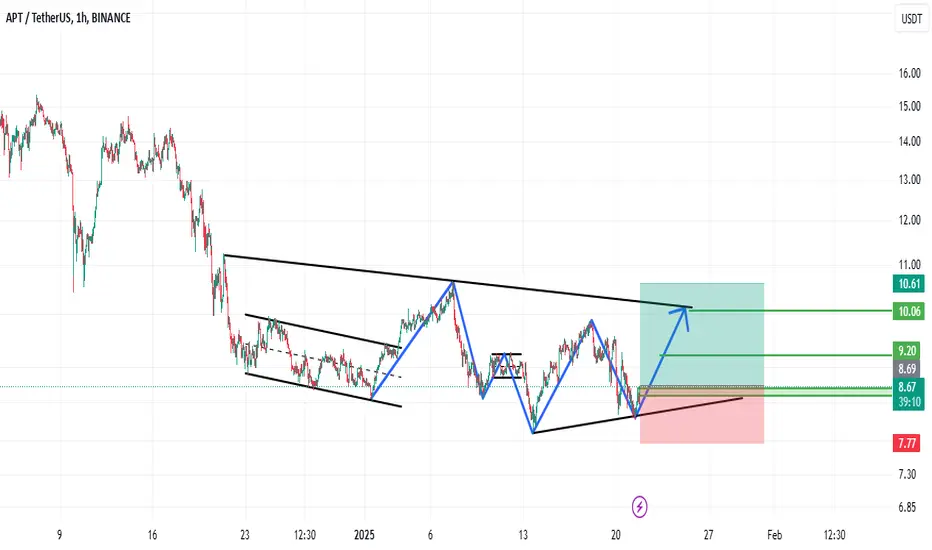
APT BUYHello guys
Considering the price structure and making the floor, we expect the price to move according to its cycle until the specified targets.
So we can enter into a transaction with capital management
*Trade safely with us*
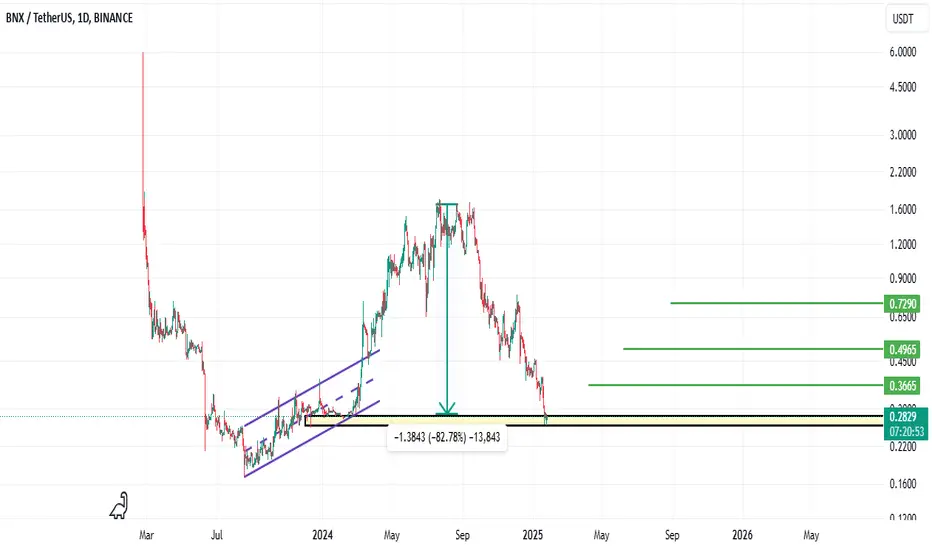
bnx analysis: important support.hello friends
Due to the heavy fall of this token, it has now reached a good and important support, and by maintaining and stabilizing this support, we can move up to the specified goals or even higher with capital management.
*Trade safely with us*
LTC BUYhello friends
According to the good trend we have, now we can buy in steps with risk and capital management in the price correction in the lower time frame.
*Trade safely with us*
CHF_JPY GROWTH AHEAD|LONG|
✅CHF_JPY has been falling recently
And the pair seems locally oversold
So as the pair is approaching a horizontal support of 165.310
Price growth is to be expected
LONG🚀
✅Like and subscribe to never miss a new idea!✅
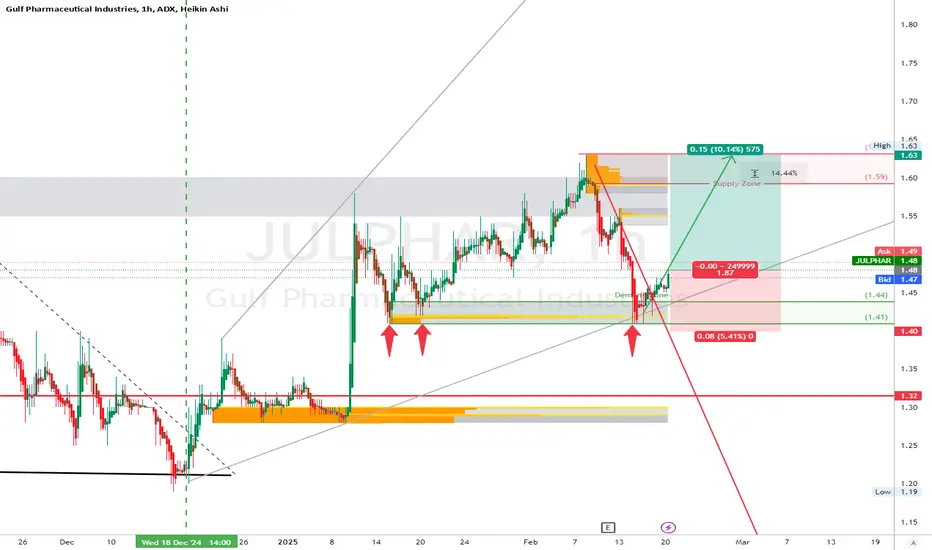
Julphar (ADX) Long SetupJulphar has been in up trend since 18th Dec with a lovely 33% profit so far. The stock is making a correction now touched the upward trend line which coincides with a a 1H demand zone. this DZ has been holding for the third time, the price expected to shoot higher whenever we have 3 touch points.
Good time to enter or add to your position.
Entry ~ 1.48
Target ~ 1.63
SL ~ 1.40
Remember,
“The trend is your friend until it bends at the end.”
________________________________________
Disclaimer:
This analysis is for educational purposes only and does not constitute financial advice. Trading involves significant risk of loss. Always perform your own analysis and consult a financial advisor before making trading decisions.
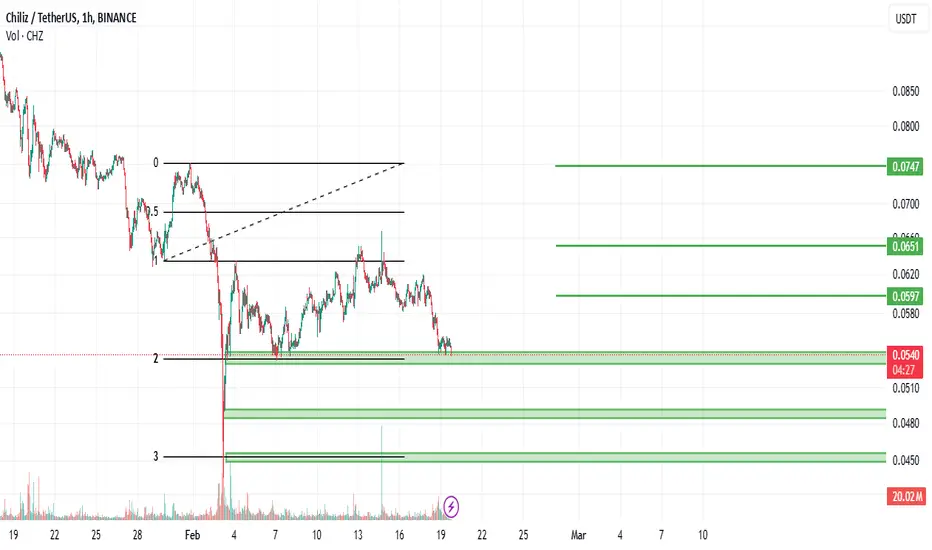
CHZ BUY LIMIThello friends
According to the drop we had, a good opportunity has been provided for buyers.
Now we can buy in steps, of course, with capital management.
We have specified the goals for you...
Trade safely with us
WHAT DO YOU THINK!!!hello friends
As you can see, we had a heavy fall and it is expected that the price will move to the support area after the pattern breaks.
Otherwise, we will experience an upward movement until the specified resistance.
*Trade safely with us*

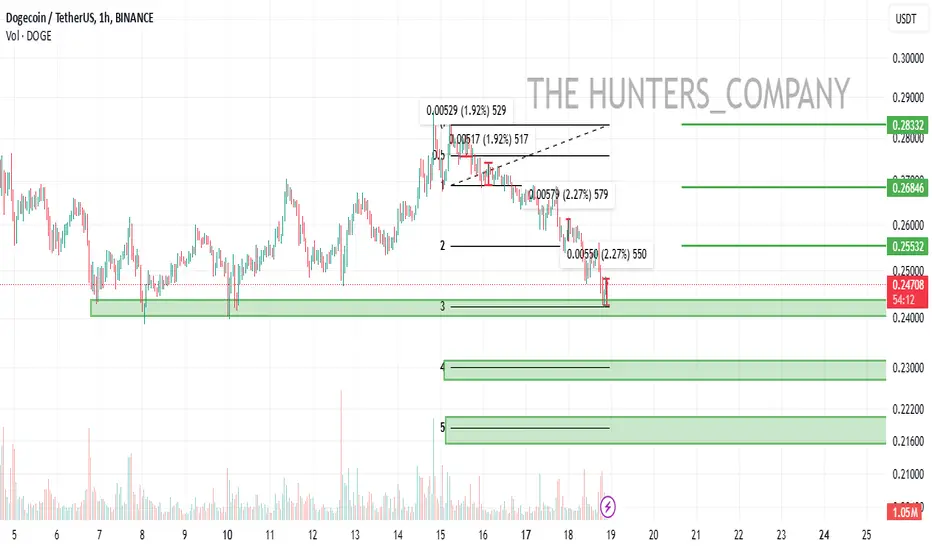
DOGECOINhello friends
Considering the drop we are having, we have obtained resistance ranges for you, and you can see that after hitting each range, there are more buyers, so it can be imagined that buyers will raise the price in this area or specified support areas...
So we can buy step by step and move with it until the specified goals.
*Trade safely with us*
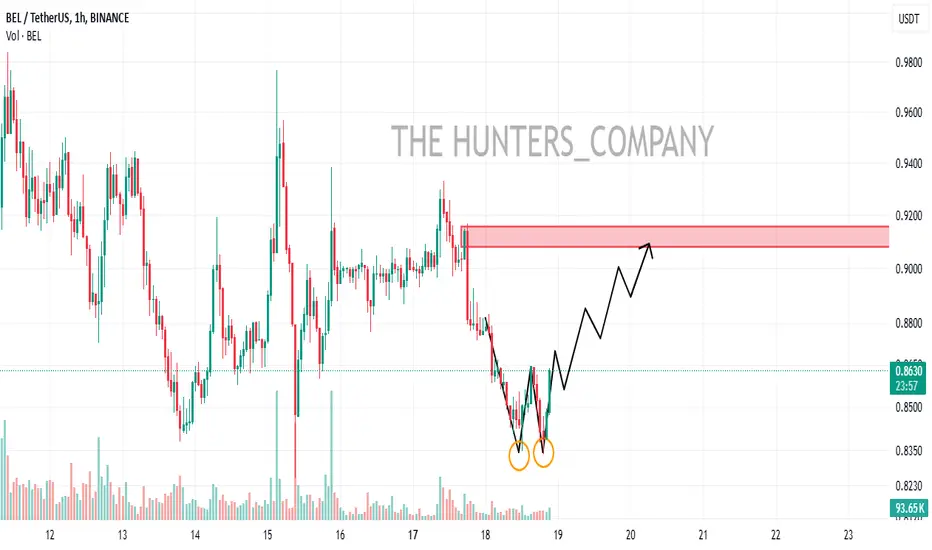
BEL/USDThello friends
Considering the drop we had, now we see the formation of a double bottom, which we can expect to move the specified resistance range.
*Trade safely with us*
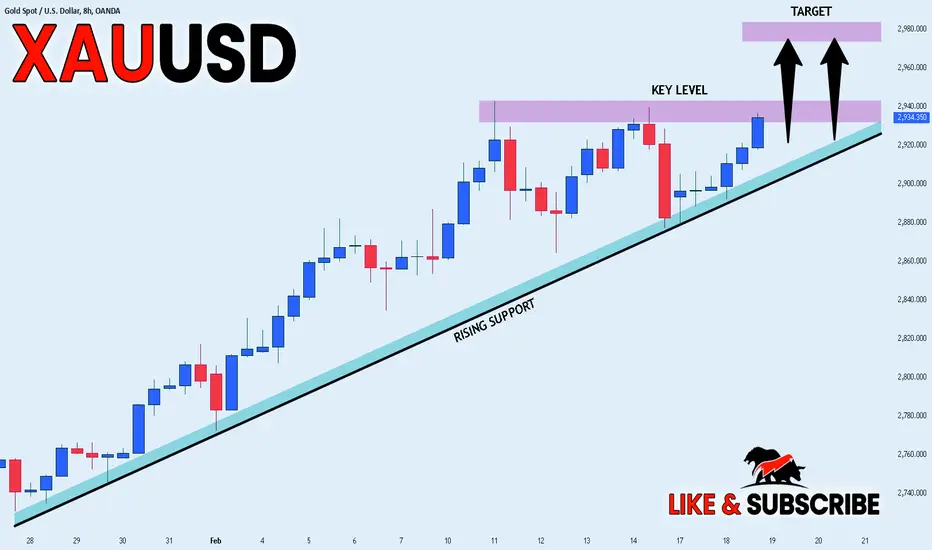
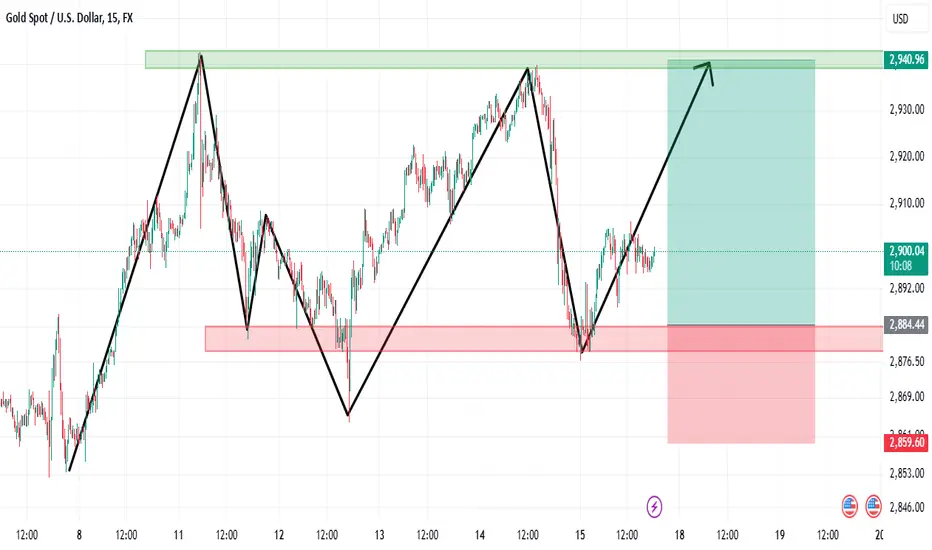
GOLD STRONG BULLISH BIAS|LONG|
✅GOL D made a strong bullish
Rebound from the horizontal
Support below of 2868$ just as
We predicted in our previous
Analysis and and is going up now
Which combined with the fact
That gold is trading in a strong
Long-term uptrend along the
Rising support line makes us
Bullish biased and IF we see a
Bullish breakout of the
Horizontal resistance level above
Around 2940$ this will serve as
A confirmation of our bullish
Bias and we will be expecting
A further bullish continuation on Gold
SWING LONG🚀
✅Like and subscribe to never miss a new idea!✅
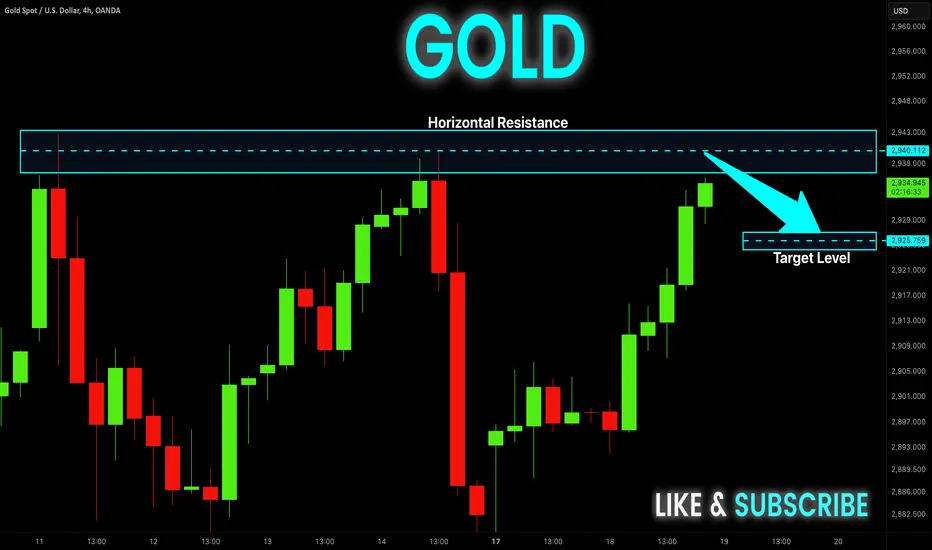
GOLD Very Risky Short! Sell!
Hello,Traders!
GOLD is trading in an
Strong uptrend but the
Price will soon hit a strong
Horizontal resistance level
Of 2943$ which is an
All-time-high so after the
Retest we will be expecting
A local bearish correction
Sell!
Comment and subscribe to help us grow!
Check out other forecasts below too!
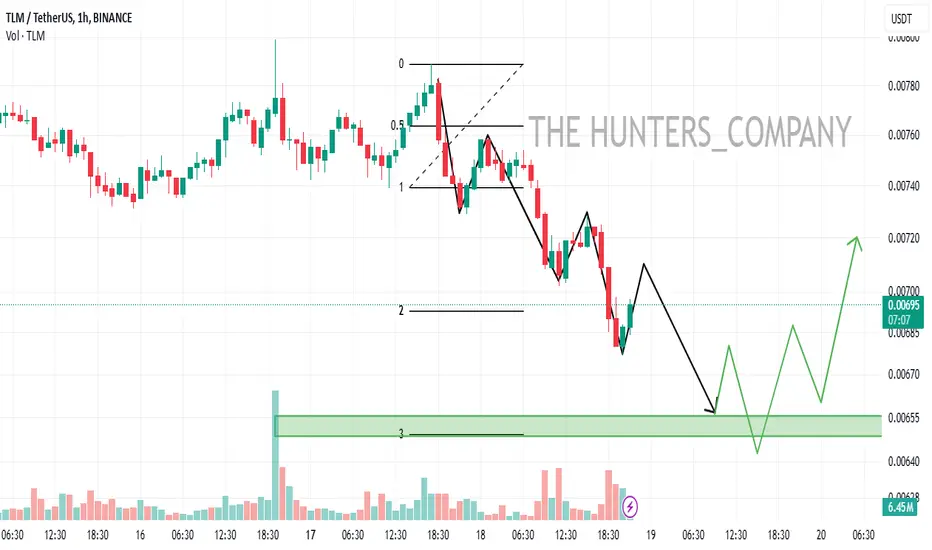
TLM/USDThello friends
This currency is expected to move to the support range according to the structure that is formed.
If the range is maintained, we can see the structure change and price growth.
*Trade safely with us*
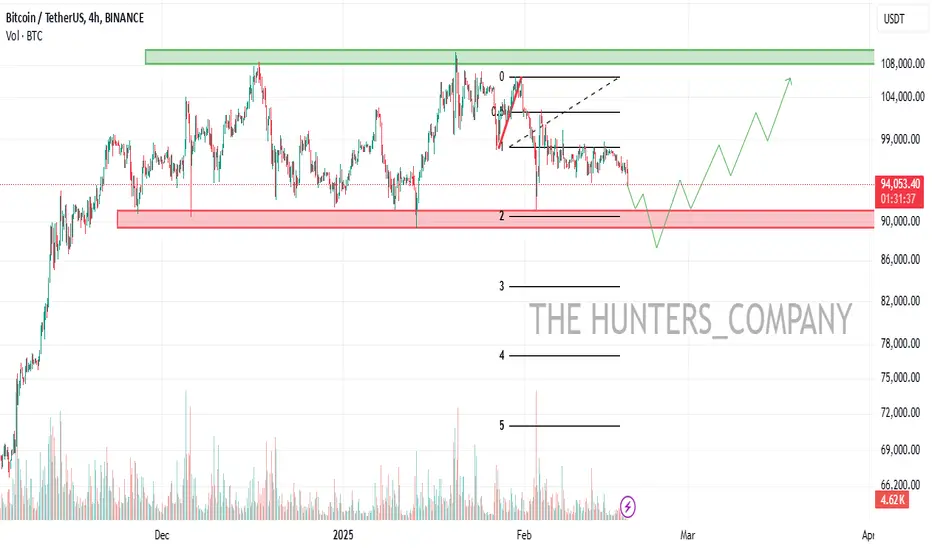
BTC/USDThello friends
With the fall that we suffered from the ceiling, now it is expected that we will experience an upward movement up to the ceiling by maintaining the support range.
*Trade safely with us*
goldhello friends
According to the formed pattern, we can enter the position with risk and capital management.
Trade safely with us.
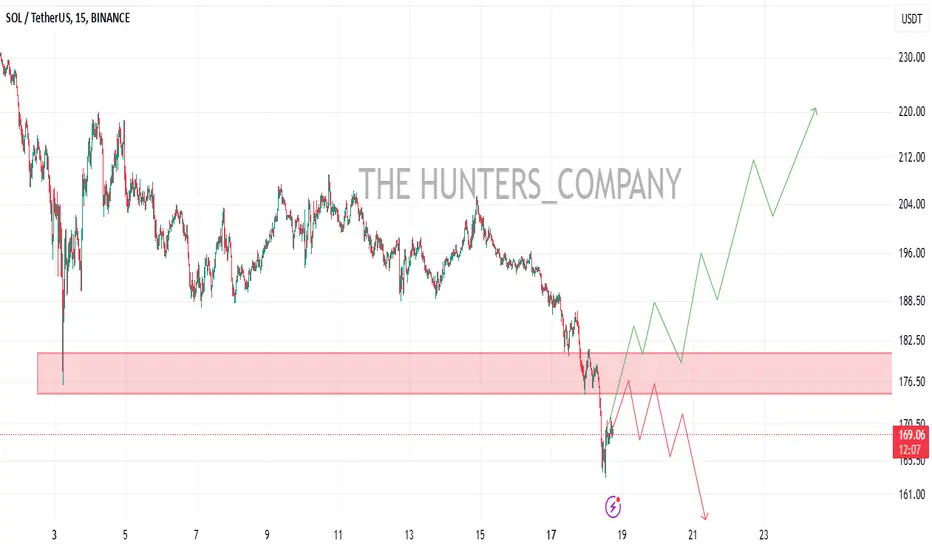
SOL/USDThello friends
Due to the price drop and the new bottom, now we have two scenarios:
1_ According to its downward trend, the price hits the resistance range and hits a new bottom.
2- The price succeeds in breaking the resistance range and our trend becomes upward.
In our opinion, scenario 1 is more tolerant.
*Trade safely with us*
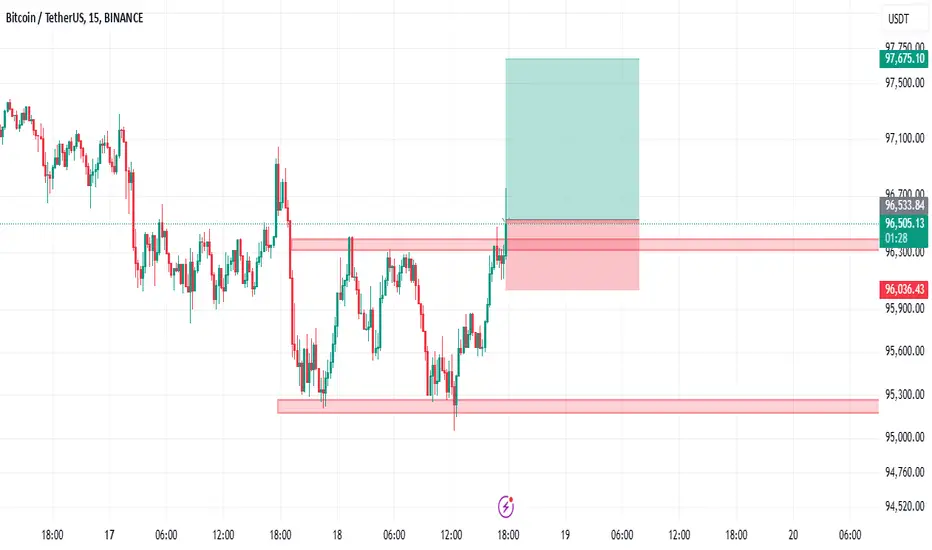
BTC/USDThello friends
According to the arrival of buyers, we can enter into the transaction with capital and risk management.
*Trade safely with us*
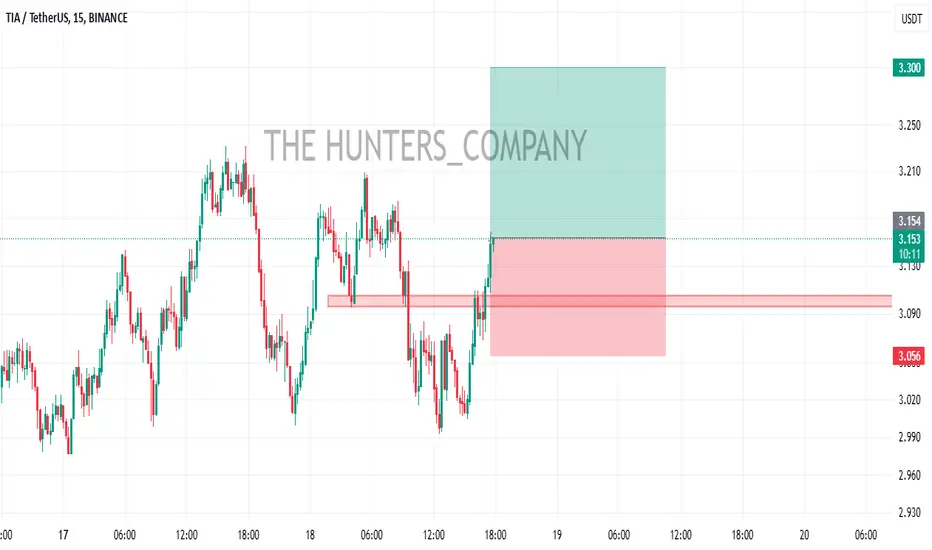
TIA/USDThello friends
According to the arrival of buyers, we can enter into the transaction with capital and risk management.
*Trade safely with us*
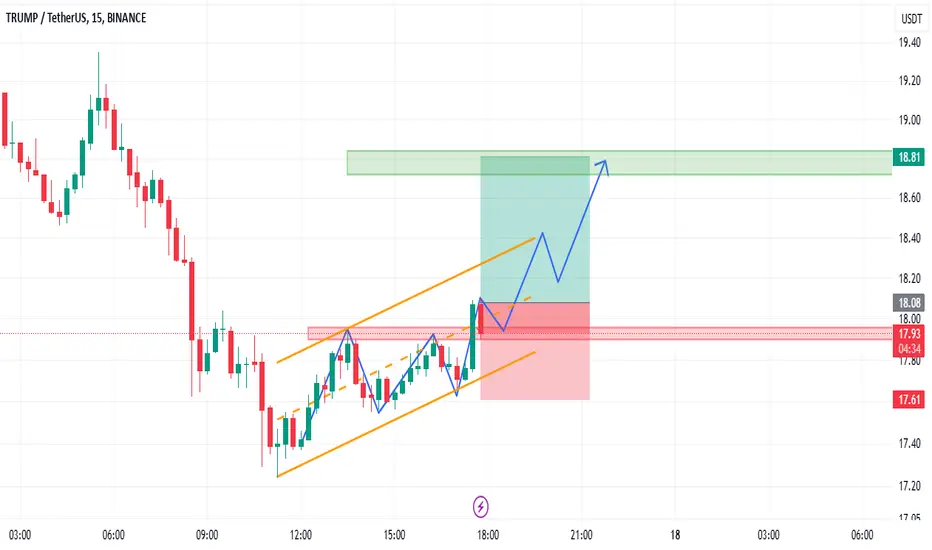
trump/usdthello friends
According to the channel in which we are placed, we can enter the position with risk and capital management.
Trade safely with us.