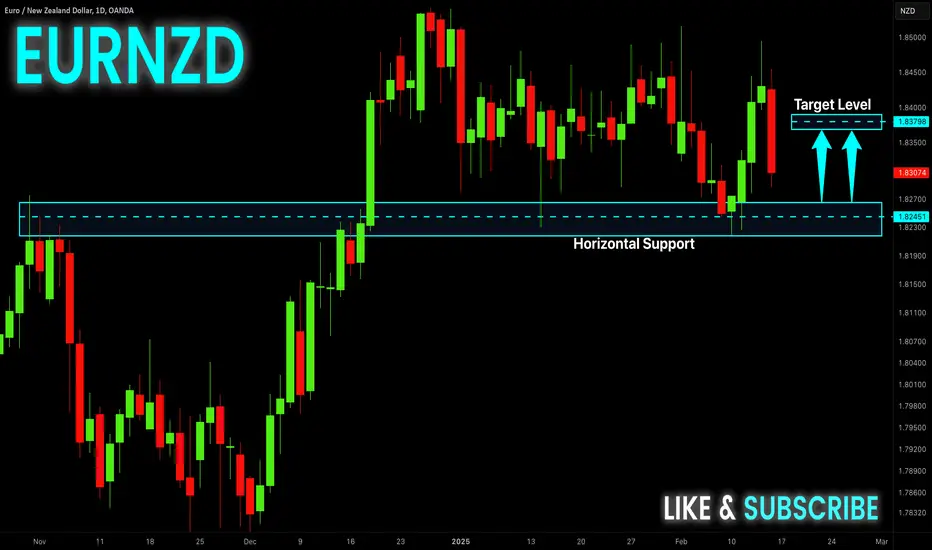
EUR-NZD Swing Long! Buy!
Hello,Traders!
EUR-NZD made a strong
Pullback from the supply
Area around 1.8500 and
Is going down but the pair
Will soon hit a wide horizontal
Support area around 1.8230
From where a local bullish
Rebound is to be expected
Buy!
Comment and subscribe to help us grow!
Check out other forecasts below too!
Freesignals
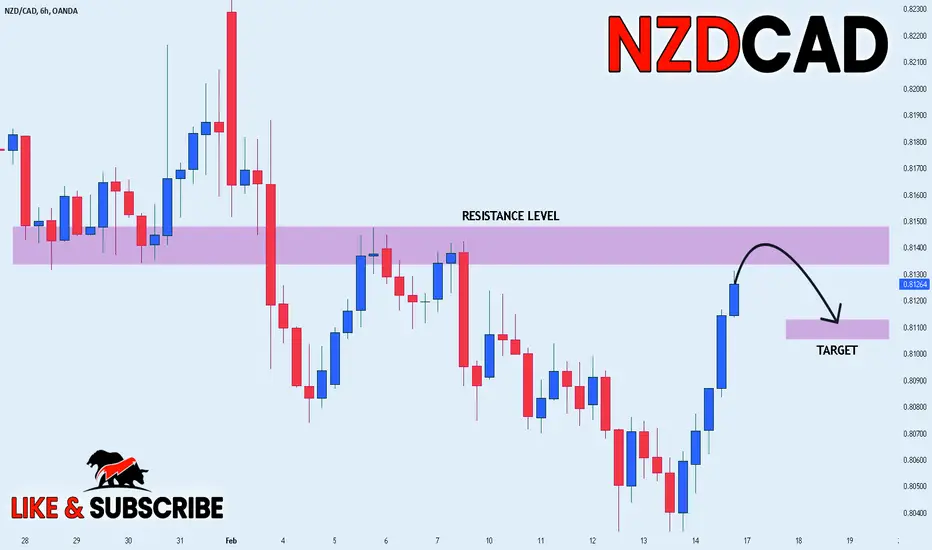
NZD_CAD SHORT FROM RESISTANCE|
✅NZD_CAD is going up now
But a strong resistance level is ahead at 0.8148
Thus I am expecting a pullback
And a move down towards the target at 0.8110
SHORT🔥
✅Like and subscribe to never miss a new idea!✅
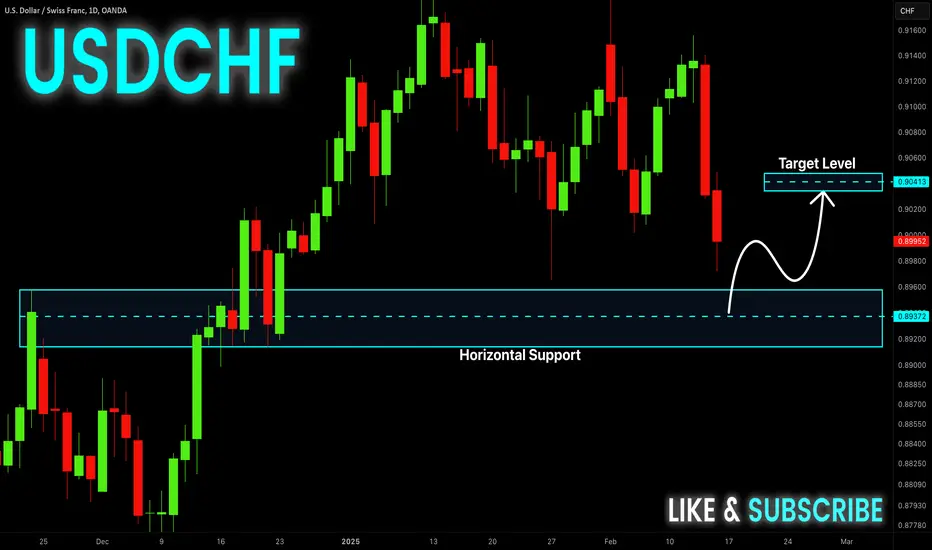
USD-CHF Long From Support! Buy!
Hello,Traders!
USD-CHF fell down again
But a strong horizontal
Support level is close by
At 0.8937 so after the
Pair retests the support
On Monday, we will be
Expecting a local
Bullish correction
Buy!
Comment and subscribe to help us grow!
Check out other forecasts below too!
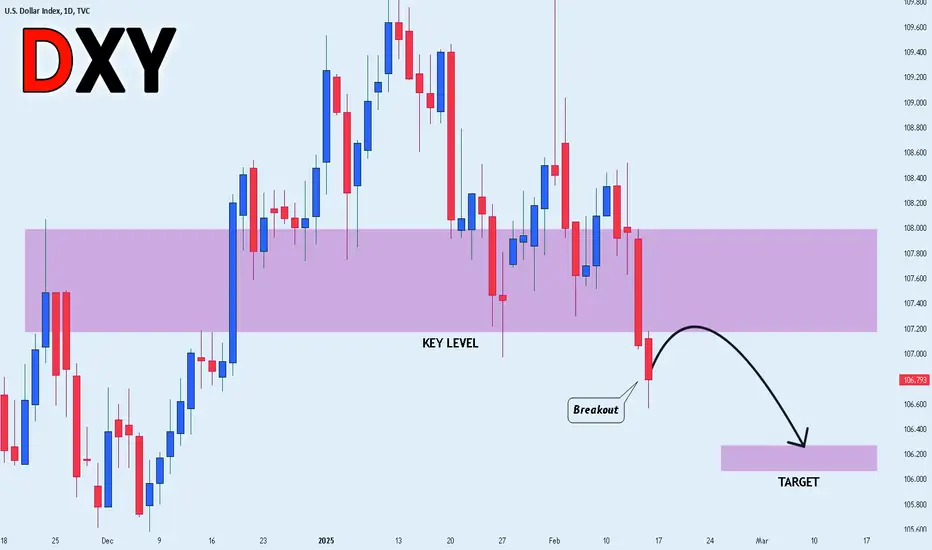
DXY BEARISH BREAKOUT|SHORT|
✅DXY(Dollar Index) broke the
Key horizontal level around 107.800
And the breakout is confirmed so
We will be expecting a further
Bearish continuation
SHORT🔥
✅Like and subscribe to never miss a new idea!✅
Avax analysis: How far will the fall continue...hello friends
Considering the drop we have, now we have to find the best support and check the reaction to the support when the price reaches that level.
We have obtained an important support for you, which can be moved up to the specified targets according to the price reaching there and maintaining the support.
*Trade safely with us*

sui buy limithello friends
Considering the fall that we are suffering from the trading ceiling, the 4th step of Fibo is a good point to carry the price and with the support of the price in this area, we can move to the specified targets.
*Trade safely with us*

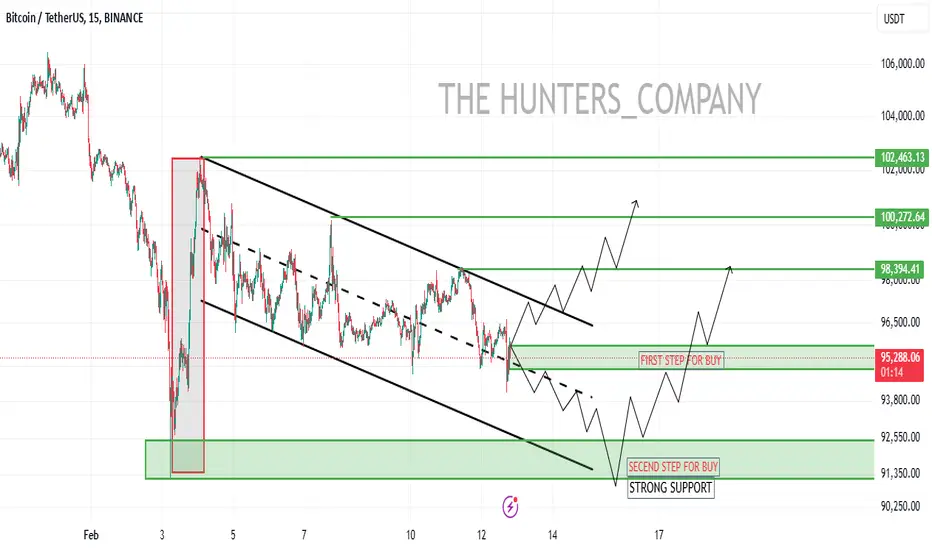
Bitcoin analysis: should we buy?hello friends
As you can see, after forming the channel, Bitcoin was able to get out of the downward channel by hitting a classic double bottom pattern, and with the channel breaking, it is now expected to move to the specified targets.
*Trade safely with us*

Dogecoin analysis: the important range...hello friends
Due to the good growth we had, now the price has been corrected and the range has been determined, which was a gap. Now it should be seen that it can maintain its support range.
In this case, we can move with it to the specified goals.
*Trade safely with us*

Pepe's analysis: buy again!!!hello friends
Considering the 70% drop, now the price has returned from a good support area, and by maintaining this rand, we will go for the specified goals, of course, with capital management...
Trade safely with us

Should we buy bitcoin or not?hello friends
Due to the growth we had, we entered a downward channel. Now all we can do is wait...
We have obtained important supports for you to buy and we have identified the targets as well...
*Trade safely with us*
Time to buy Solanahello friends
Well, I must say that it is very difficult to predict the route, but we can buy step by step.
Here, the price has fallen, and now it is on an important support. If the support is broken, we can buy lower support with capital management and move forward with it.
*Trade safely with us*

ENA/USDTHey guys
Considering the fall of this currency, in the event of a further fall, which is not expected, it is possible to buy step by step with risk and capital management in the three specified support areas and move to the specified goals...
*Trade safely with us*

ada/usdthello friends
As we specified for you, we have two good support ranges for price growth, which we specified for you...
If the support range is maintained, the price will move up to the ceiling of the channel.
*Trade safely with us*

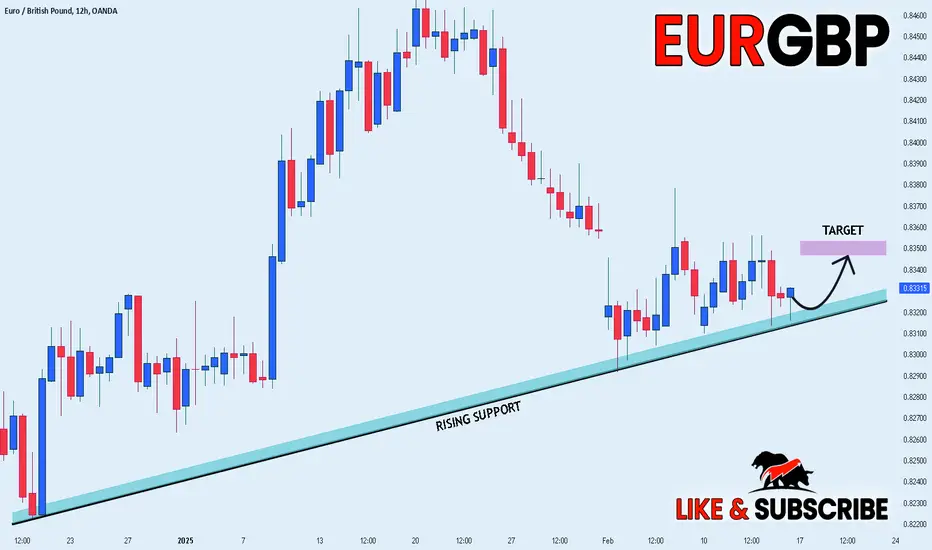
EUR_GBP LONG FROM RISING SUPPORT|
✅EUR_USD is trading along the rising support
And as the pair will soon retest it
I am expecting the price to go up
To retest the supply levels above at 0.8350
LONG🚀
✅Like and subscribe to never miss a new idea!✅
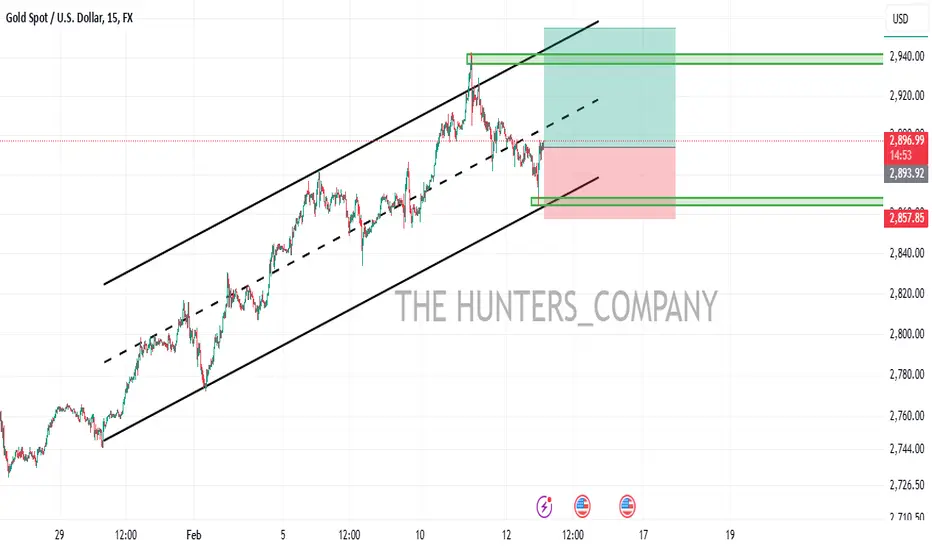
GOLD BUYhello friends
Considering the price being in the ascending channel and its reaction to the bottom of the channel, we can open a buy deal up to the top of the channel with capital management...
*Trade safely with us*
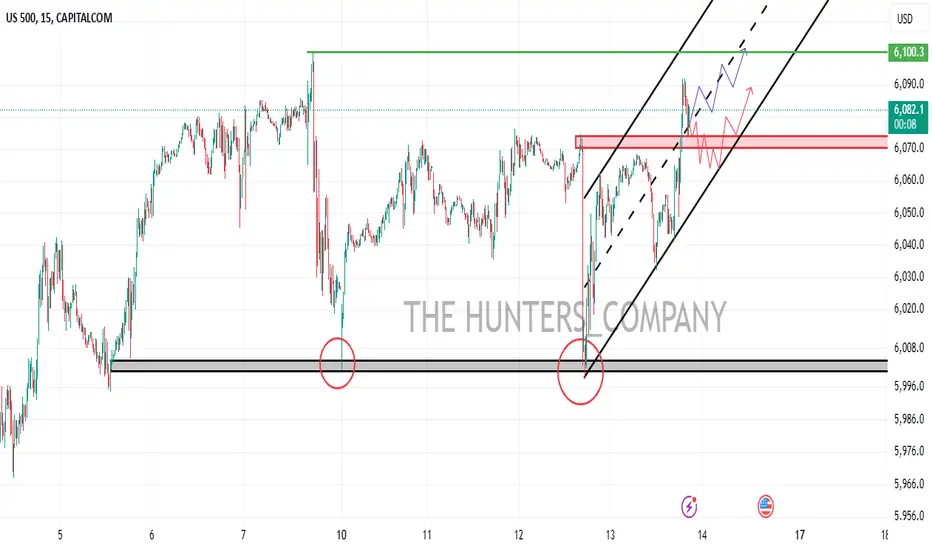
US500 BUYhello friends
Considering that the price is in the ascending channel, we expect the price to move up to our target, which is the green line.
Or break the specified support and start moving from the bottom of the channel.
*Trade safely with us*
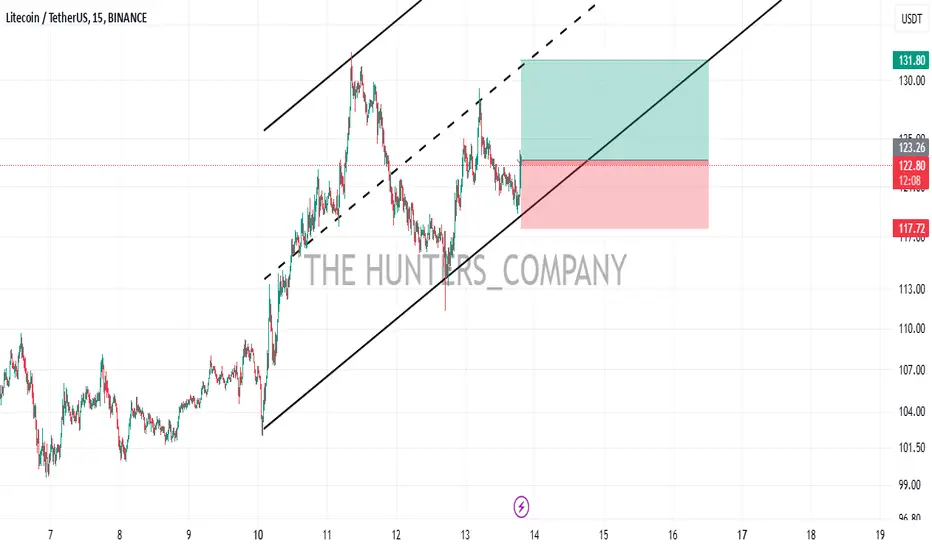
LTC BUYhello friends
According to the formed channel and price support from the bottom of the channel, we can enter the position with capital management.
*Trade safely with us*
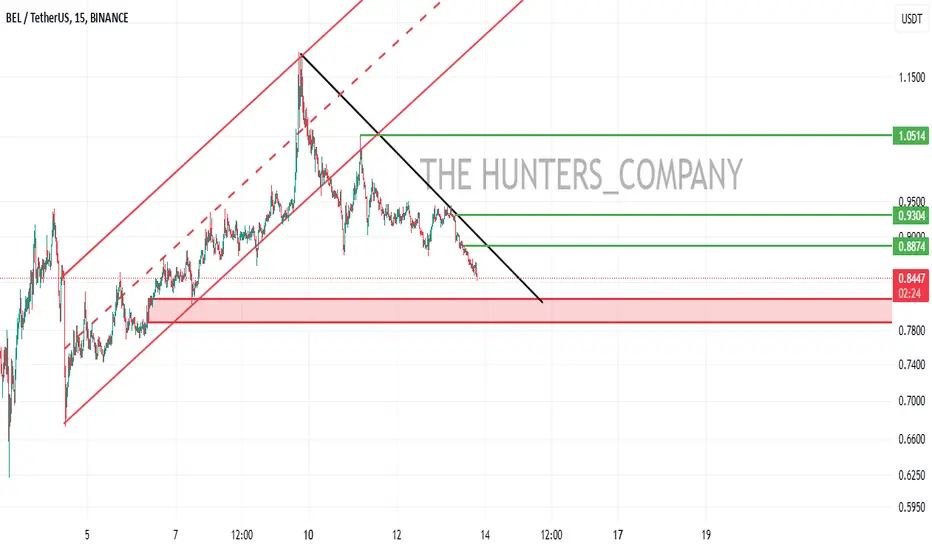
BEL/USDThello friends
According to the drop we had, we got the best support for buying for you, so that if you reach it, you can buy with risk management.
*Trade safely with us*
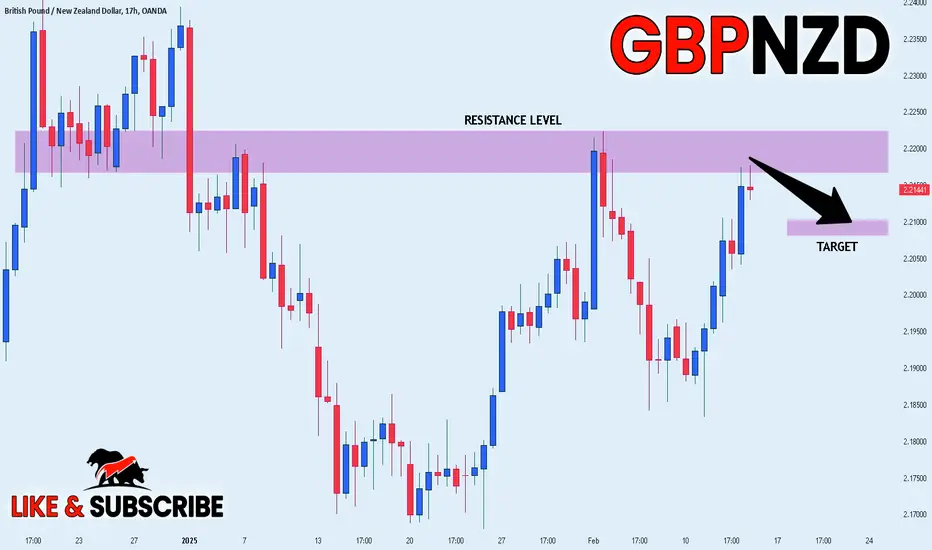
GBP_NZD WILL FALL|SHORT|
✅GBP_NZD is going up to retest a horizontal resistance of 2.2220
Which makes me locally bearish biased
And I think that we will see a pullback
And a move down from the level
Towards the target below at 2.2095
SHORT🔥
✅Like and subscribe to never miss a new idea!✅
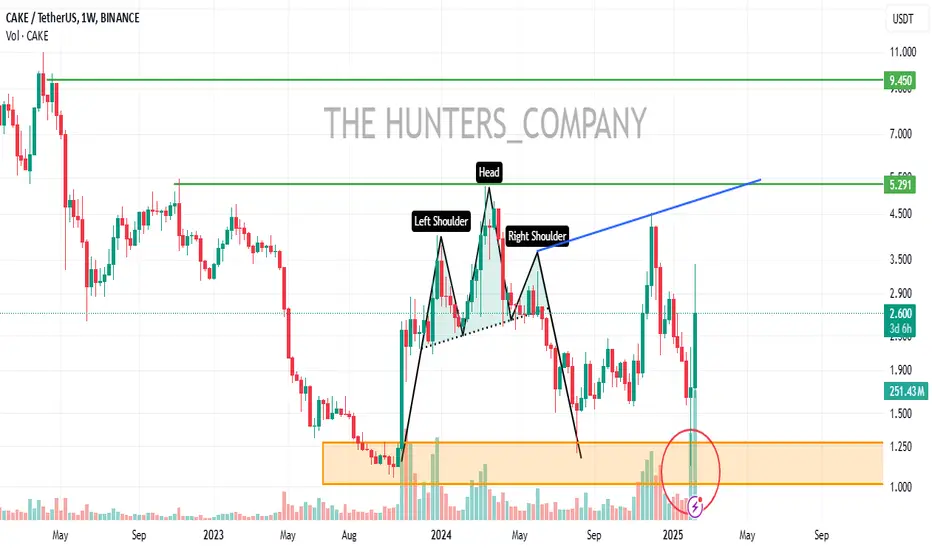
CAKE/USDThello friends
According to the pattern made in the trading range and pullback, this currency has eaten a good amount and it can be said that it can move to the specified goals in the long term.
*Trade safely with us*
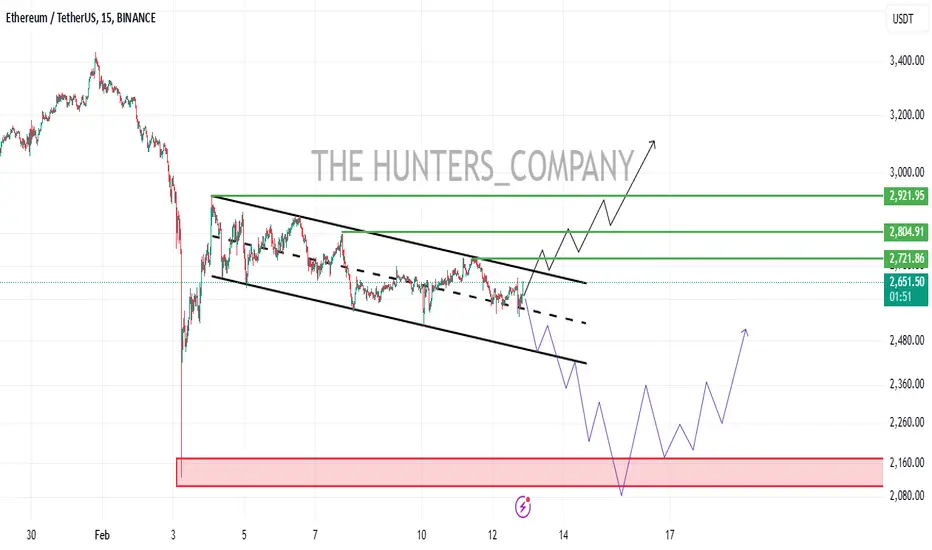
steps to buy ETH/USDT...hello friends
Here we have a channel that we are waiting for to fail and we have two scenarios for it.
1_ From here, the channel will be broken and our goals will be reached
2- The fall continues and starts growing in the specified support.
*Trade safely with us*
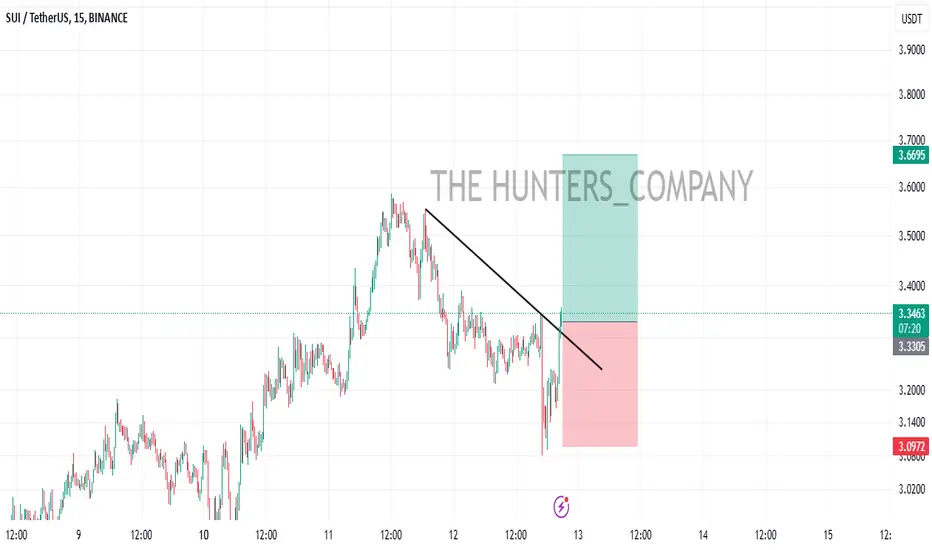
SUI BUYhello friends
Due to the failure of the downward structure, we can enter into the transaction with capital management.
*Trade safely with us*
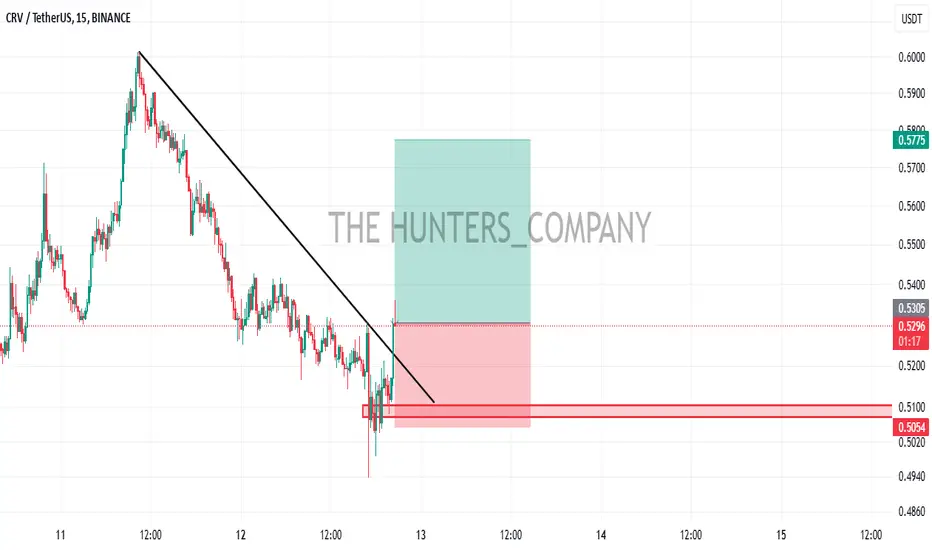
CRV BUYhello friends
Due to the failure of the downward structure, we can enter into the transaction with capital management.
*Trade safely with us*