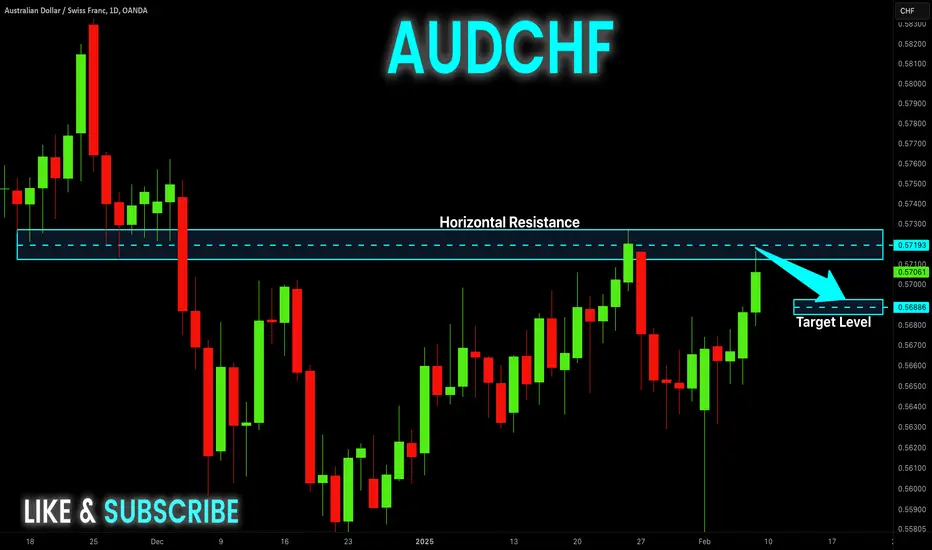
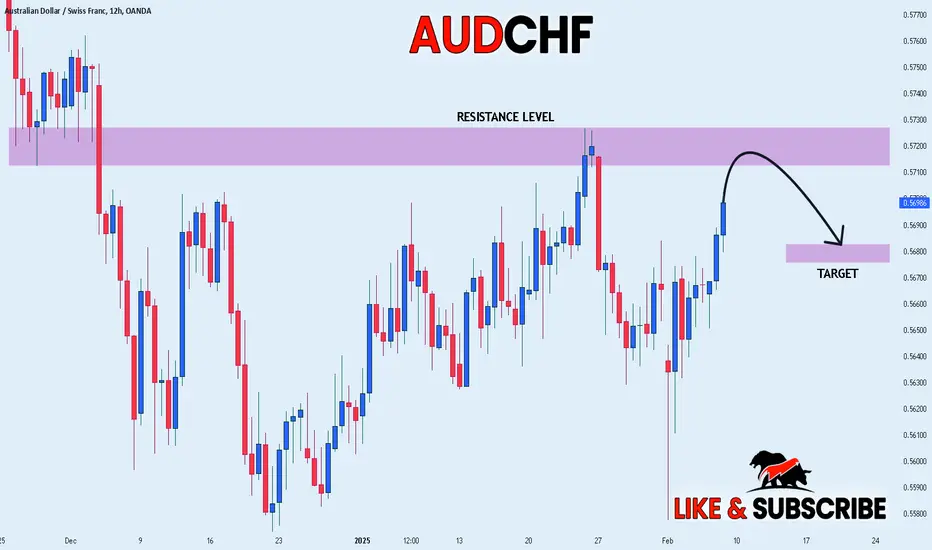
AUD-CHF Swing Short! Sell!
Hello,Traders!
AUD-CHF keeps growing
In a local uptrend but a
Strong horizontal resistance
Level is ahead at 0.5726
And after the pair hits
It on Monday we will
Be expecting a local
Bearish correction
Sell!
Comment and subscribe to help us grow!
Check out other forecasts below too!
Freesignals
CHF_JPY REBOUND AHEAD|LONG|
✅CHF_JPY will soon retest a key support level of 165.500
So I think that the pair will make a rebound
And go up to retest the supply level above at 167.164
LONG🚀
✅Like and subscribe to never miss a new idea!✅

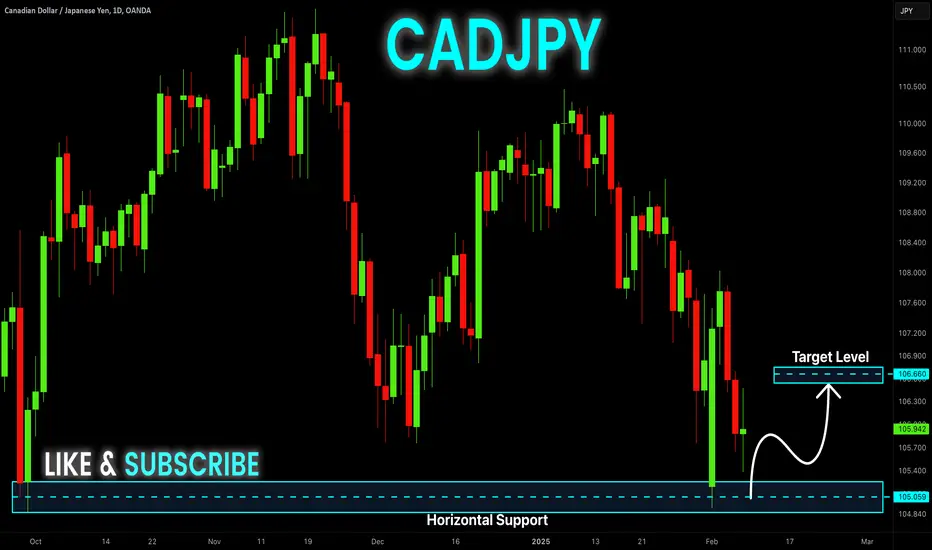
CAD-JPY Potential Long! Buy!
Hello,Traders!
CAD-JPY is falling down
Again after some crazy moves
But the pair will soon hit
A horizontal demand level
Of 104.850 from where
We will be expecting a
Local bullish rebound
Buy!
Comment and subscribe to help us grow!
Check out other forecasts below too!
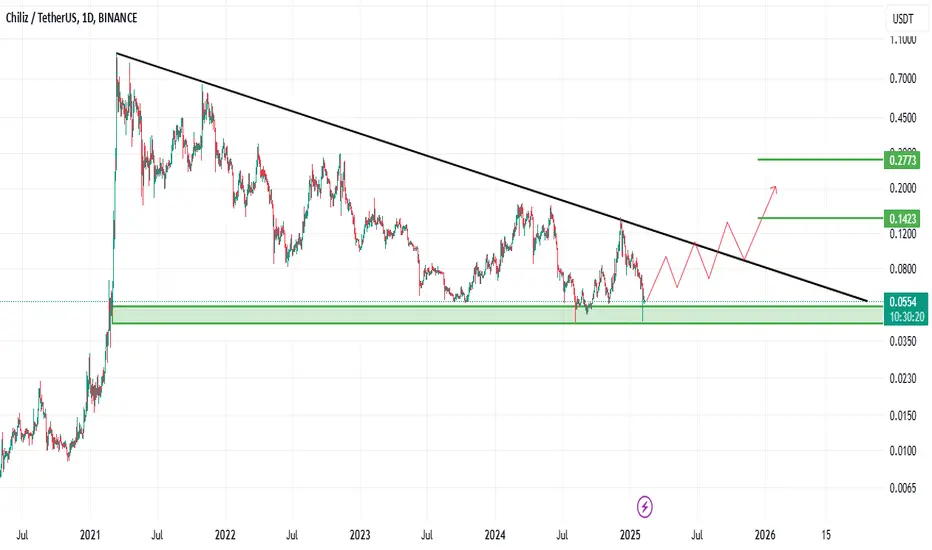
Good area to shop...hello friends
Considering that the price is in a triangle, now by reaching an important support range, it is expected that the price will break the resistance in front of it to move to the specified targets.
*Trade safely with us*
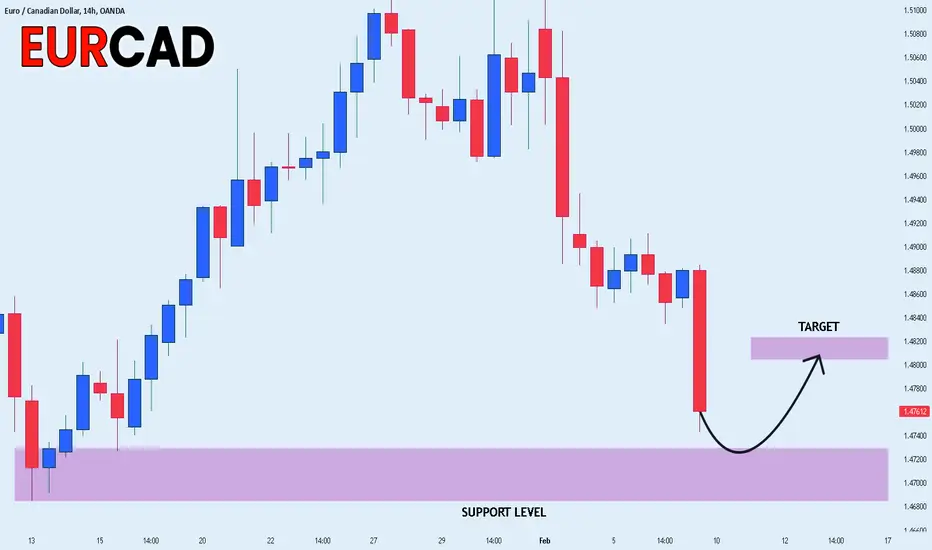
EUR_CAD MOVE UP AHEAD|LONG|
✅EUR_CAD will soon retest a key support level of 1.4685
So I think that the pair will make a rebound
And go up to retest the supply level above at 1.4810
LONG🚀
✅Like and subscribe to never miss a new idea!✅
EUR-JPY Strong Support Ahead! Buy!
Hello,Traders!
EUR-JPY is collapsing
In a strong local downtrend
And the pair is locally oversold
So after the price hits the
Horizontal support of 155.170
A local bullish rebound
Is to be expected
Buy!
Comment and subscribe to help us grow!
Check out other forecasts below too!
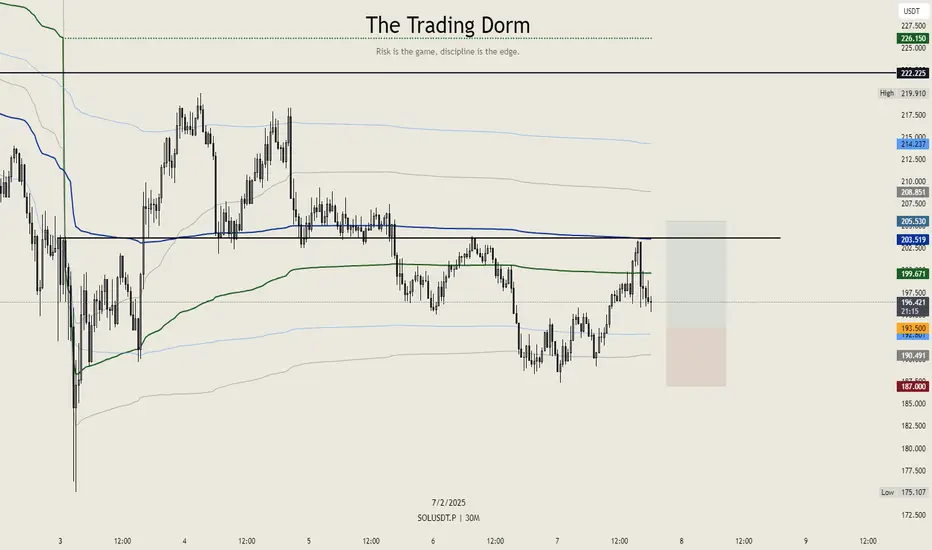
Solana $SOL Setup – Keeping it CleanSolana looks strong, so it’s time for a trade. The entry is placed at $193.50, with a stop-loss at $187 to keep risk in check. The target is set at $205.53, aligning perfectly with the monthly and weekly VWAP VALs.
This setup offers a 1:1.85 risk-to-reward ratio—nothing crazy, just a clean, structured trade. No moonboy fantasy for now, just following the price action and executing accordingly.
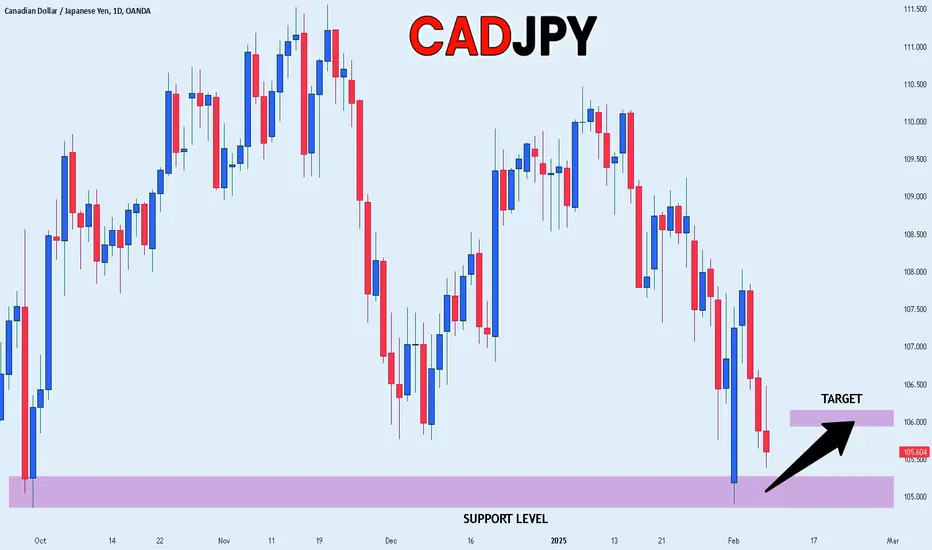
CAD_JPY BULLISH REBOUND AHEAD|LONG|
✅CAD_JPY is going down now
But a strong support level is ahead at 105.000
Thus I am expecting a rebound
And a move up towards the target at 106.029
LONG🚀
✅Like and subscribe to never miss a new idea!✅
AUD_CHF RESISTANCE AHEAD|SHORT|
✅AUD_CHF is approaching a supply level of 0.5727
So according to our strategy
We will be looking for the signs of the reversal in the trend
To jump onto the bearish bandwagon just on time to get the best
Risk reward ratio for us
SHORT🔥
✅Like and subscribe to never miss a new idea!✅
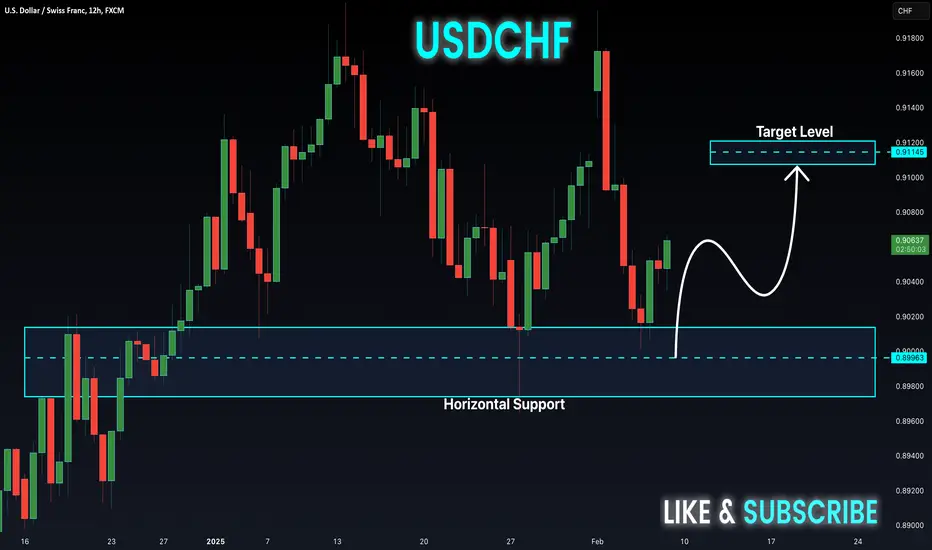
USD-CHF Bullish Bias! Buy!
Hello,Traders!
USD-CHF is trading in an
Uptrend and the pair just
Made a rebound from the
Round horizontal support
Level of 0.9000 so we are
Bullish biased and we will
Be expecting some
Further growth
Buy!
Comment and subscribe to help us grow!
Check out other forecasts below too!
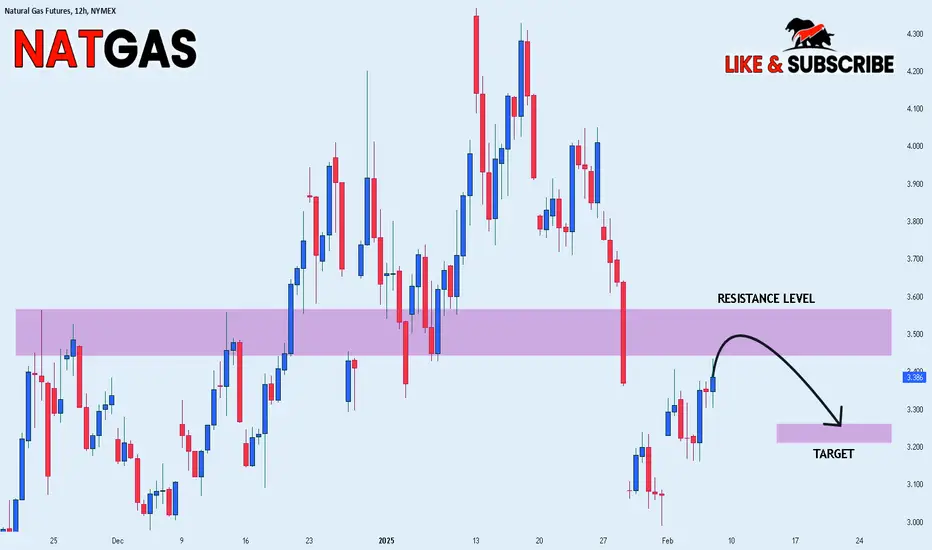
NATGAS CORRECTION AHEAD|SHORT|
✅NATGAS surged again to retest the resistance of 3.569$
But it is a strong key level
So I think that there is a high chance
That we will see a bearish pullback and a move down
SHORT🔥
✅Like and subscribe to never miss a new idea!✅
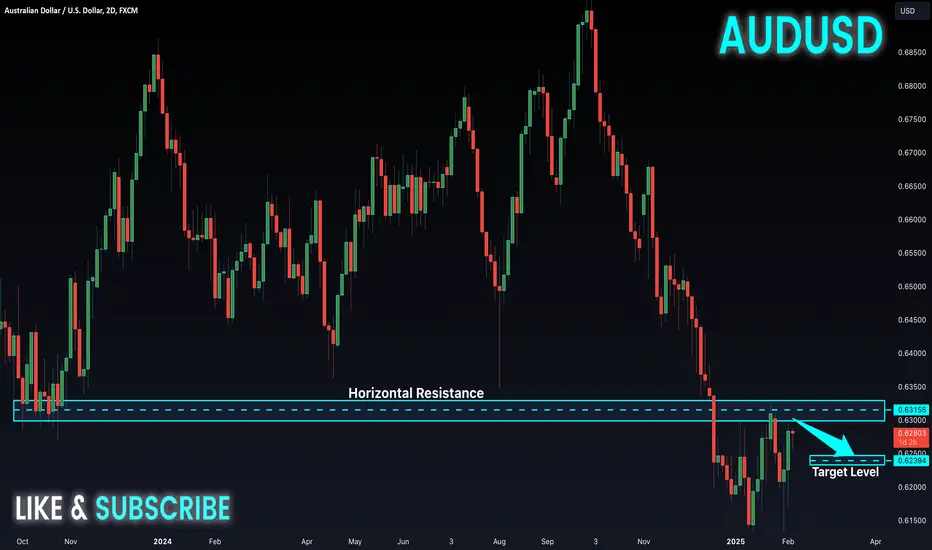
AUD-USD Strong Resistance! Sell!
Hello,Traders!
AUD-USD went up sharply
From the lows but will soon
Hit a horizontal resistance
Level of 0.6324 from where
We will be expecting a local
Bearish correction
Sell!
Comment and subscribe to help us grow!
Check out other forecasts below too!
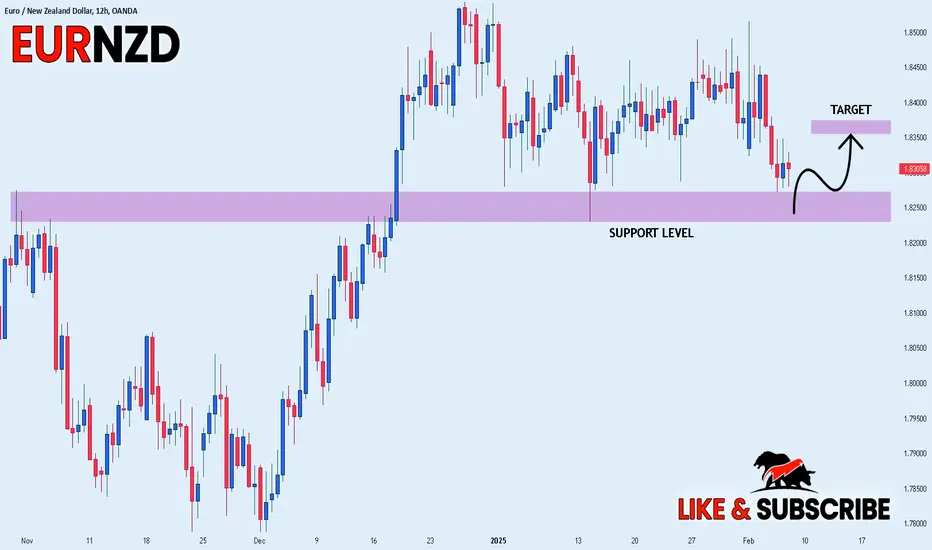
EUR_NZD POTENTIAL LONG|
✅EUR_NZD is about to retest a key structure level of 1.8250
Which implies a high likelihood of a move up
As some market participants will be taking profit from short positions
While others will find this price level to be good for buying
So as usual we will have a chance to ride the wave of a bullish correction
LONG🚀
✅Like and subscribe to never miss a new idea!✅
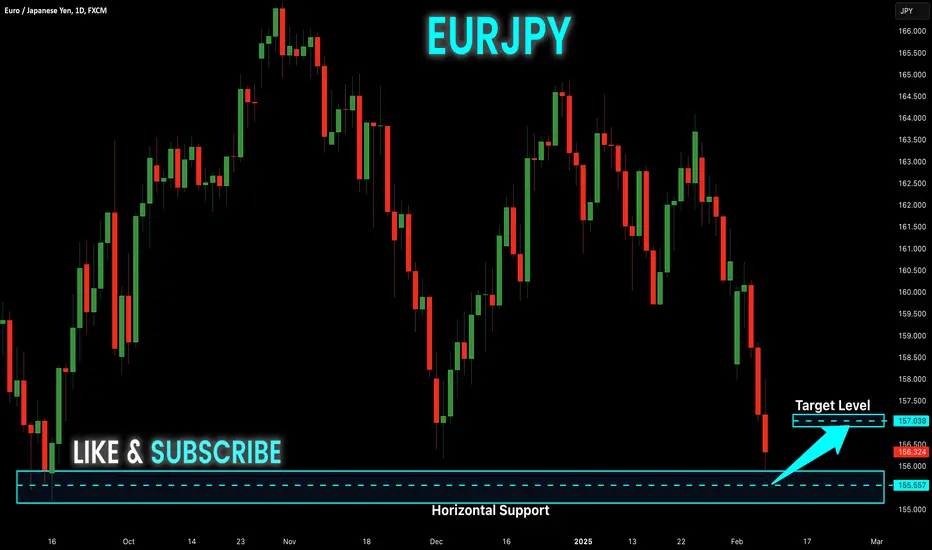
EUR-JPY Support Ahead! Buy!
Hello,Traders!
EUR-JPY keeps falling
Down and the pair is
Locally oversold so
After the retest of the
Horizontal support of 156.162
A local bullish rebound
Is to be expected
Buy!
Comment and subscribe to help us grow!
Check out other forecasts below too!

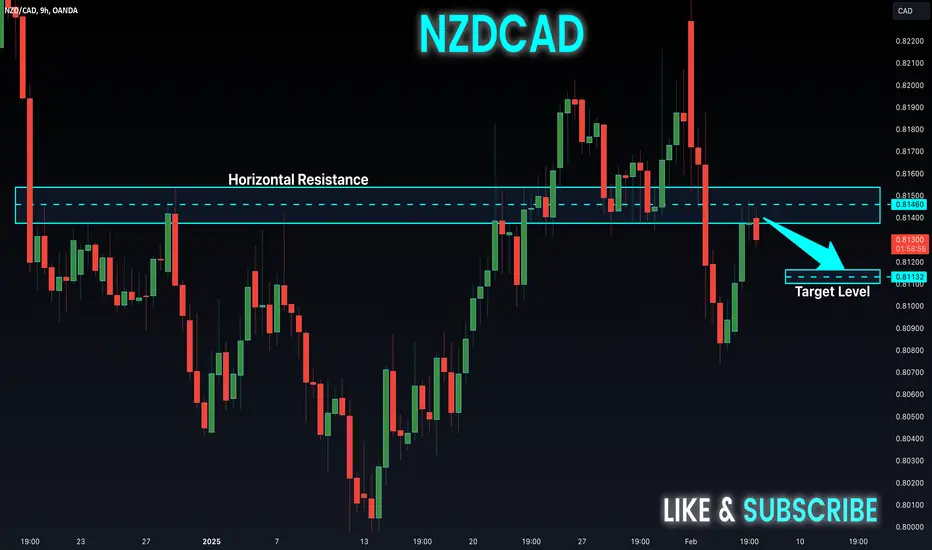
NZD-CAD Local Short! Sell!
Hello,Traders!
NZD-CAD made a nice
Recovery after a sharp
Fall then retested a
Horizontal resistance
Level of 0.8150 and we
Are already seeing a
Local bearish reaction
So we will be expecting
A further bearish move down
Sell!
Comment and subscribe to help us grow!
Check out other forecasts below too!
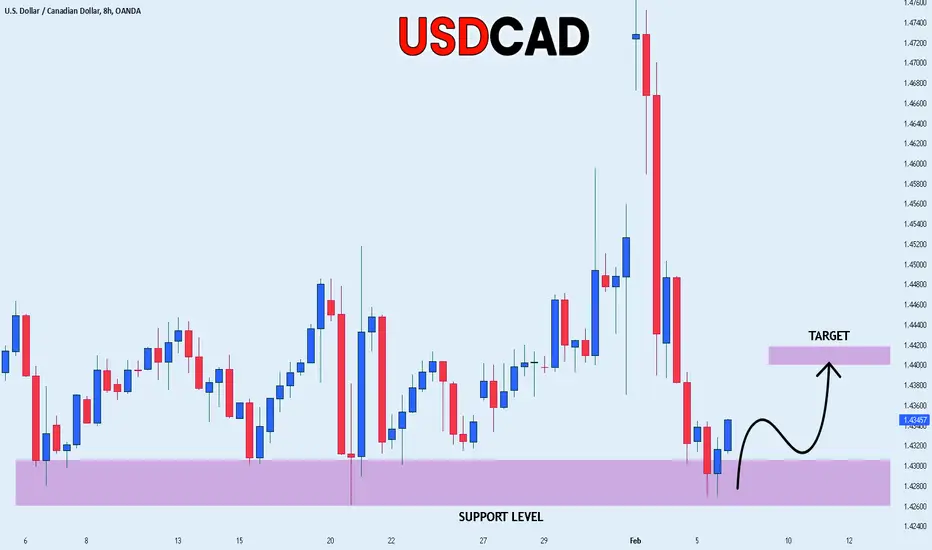
USD_CAD WILL GO UP|LONG|
✅USD_CAD fell again to retest the support of 1.4260
But it is a strong key level
So I think that there is a high chance
That we will see a bullish rebound and a move up
LONG🚀
✅Like and subscribe to never miss a new idea!✅
AUD_USD SWING SHORT|
✅AUD_USD is set to retest a
Strong resistance level above at 0.6350
After trading in a local uptrend for some time
Which makes a bearish pullback a likely scenario
With the target being a local support below at 0.6250
SHORT🔥
✅Like and subscribe to never miss a new idea!✅

DXY Risky Long! Buy!
Hello,Traders!
DXY has been making some
Pretty wild moves on the
Recent geopolitical news
Lately so we need to be
Trading this index with
Caution, however, the
Dollar index is approaching
A horizontal support of 107.000
From where we will be
Expecting a local
Bullish correction
Buy!
Comment and subscribe to help us grow!
Check out other forecasts below too!

EUR-NZD Potential Long! Buy!
Hello,Traders!
EUR-NZD keeps falling
But a strong horizontal
Support level is ahead
At 1.8249 from where
We will be expecting a
Local bullish correction
Buy!
Comment and subscribe to help us grow!
Check out other forecasts below too!

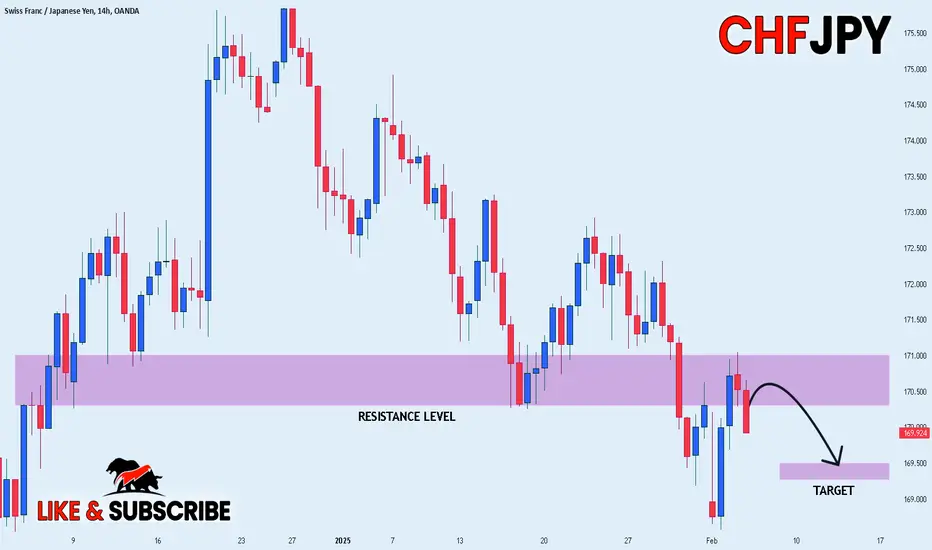
CHF_JPY RISKY SHORT|
✅CHF_JPY has retested a resistance level of 171.00
And we are seeing a bearish reaction
With the price going down but we need
To wait for a confirmation
Before entering the trade, so that we
Get a higher success probability of the trade
SHORT🔥
✅Like and subscribe to never miss a new idea!✅
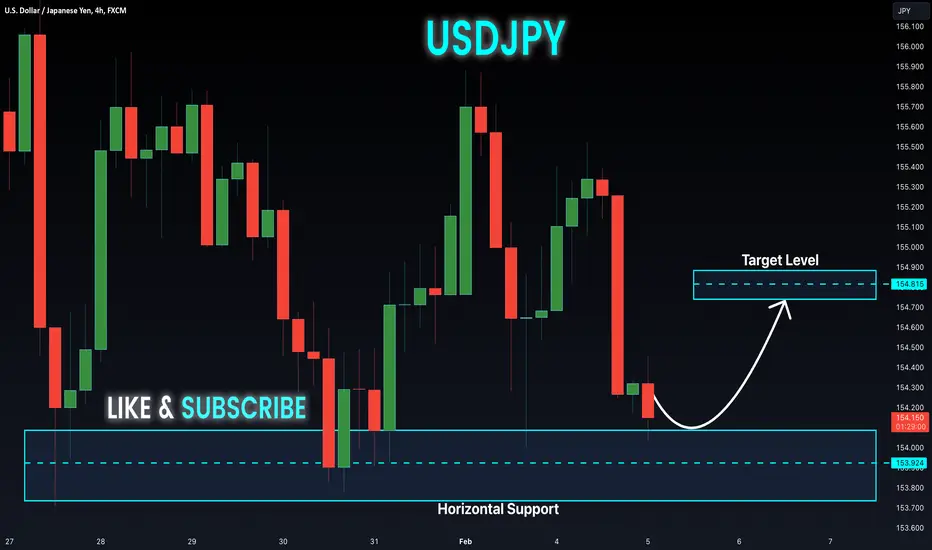
USD-JPY Correction Ahead! Buy!
Hello,Traders!
USD-JPY is going down
But the pair will soon hit
A horizontal support level
Of 153.780 and as the pair
Is locally oversold we will
Be expecting a local
Bullish correction
Buy!
Comment and subscribe to help us grow!
Check out other forecasts below too!
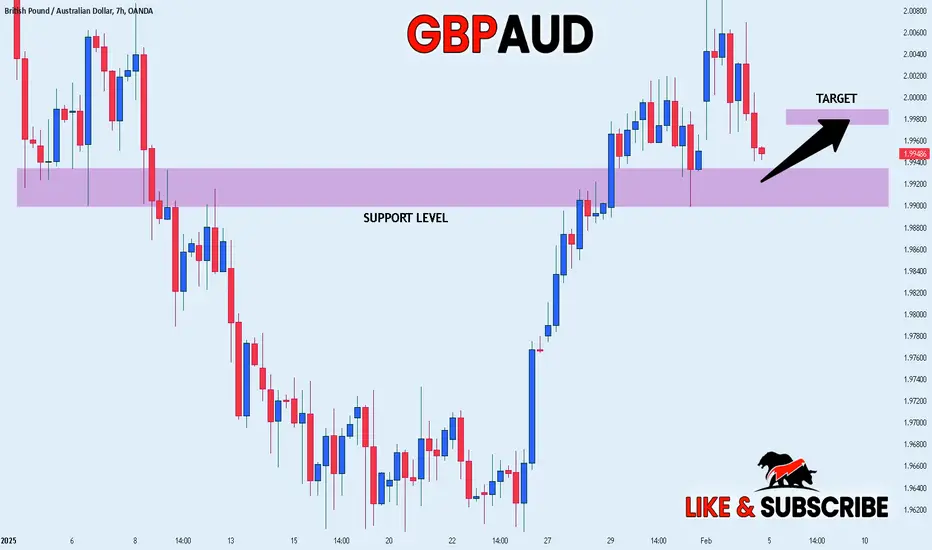
GBP_AUD SUPPORT AHEAD|LONG|
✅GBP_AUD is set to retest a
Strong support level below at 1.9906
After trading in a local downtrend from some time
Which makes a bullish rebound a likely scenario
With the target being a local resistance above at 1.9980
LONG🚀
✅Like and subscribe to never miss a new idea!✅
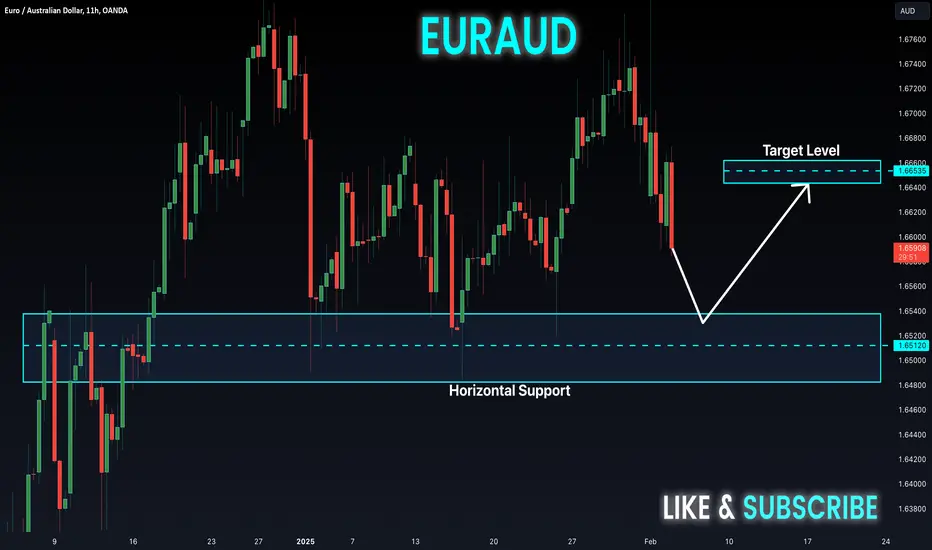
EUR-AUD Long From Support! Buy!
Hello,Traders!
EUR-AUD is falling down
Now and will soon hit a
Horizontal support of 1.6500
And after the retest we
Will be expecting a
Local bullish rebound
Buy!
Comment and subscribe to help us grow!
Check out other forecasts below too!