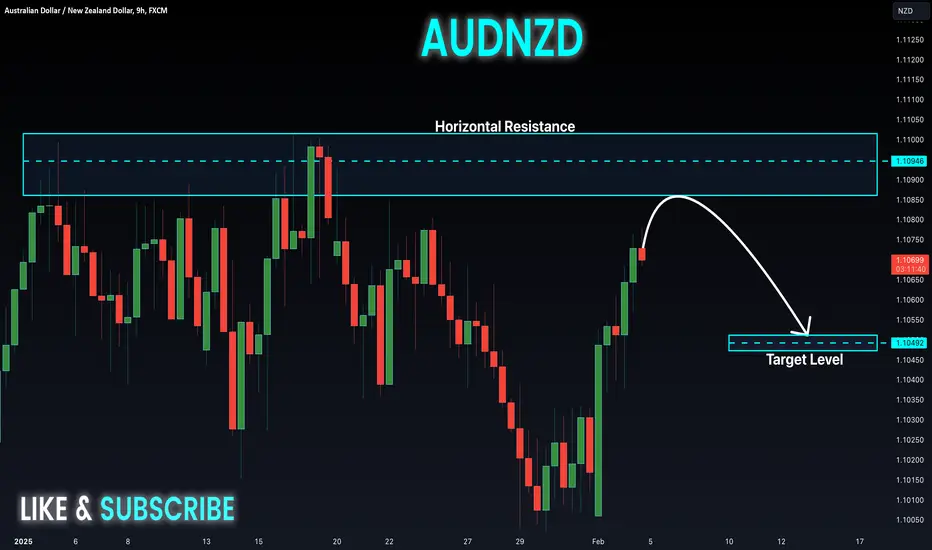
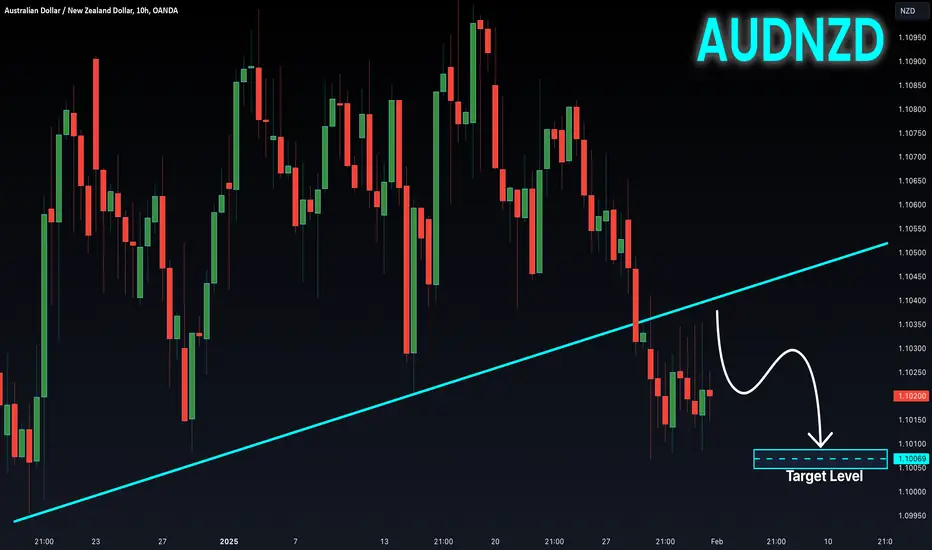
AUD-NZD Resistance Ahead! Sell!
Hello,Traders!
AUD-NZD is going up now
And will soon hit a horizontal
Resistance of 1.1100 from
Where we will be expecting
A local bearish pullback
Sell!
Comment and subscribe to help us grow!
Check out other forecasts below too!
Freesignals
CADCHF: Intraday Bearish Movement 🇨🇦🇨🇭
CADCHF formed a liquidity grab after a test of a key intraday/daily
horizontal resistance.
A consequent bearish imbalance indicates a highly probable
bearish continuation lower.
Next support - 0.62855
❤️Please, support my work with like, thank you!❤️

GBP_NZD POTENTIAL LONG|
✅GBP_NZD is going down to retest a horizontal support of 2.2062
Which makes me locally bullish biased
And I think that we will see a rebound
And a move up from the level
Towards the target above at 2.2183
LONG🚀
✅Like and subscribe to never miss a new idea!✅

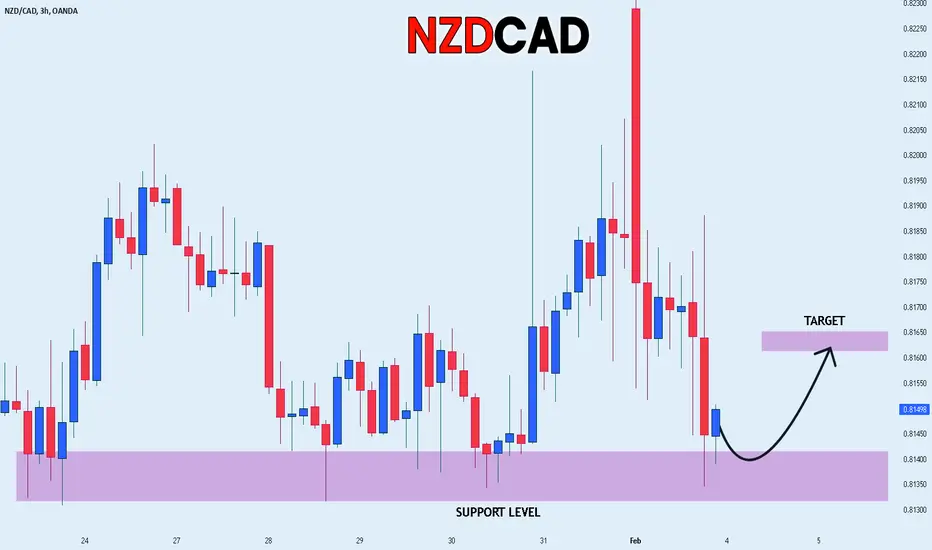
NZD_JPY LOCAL BULLISH BIAS|LONG|
✅NZD_JPY has retested a key support level of 0.8135
And as the pair is already making a bullish rebound
A move up to retest the supply level above at 0.8162 is likely
LONG🚀
✅Like and subscribe to never miss a new idea!✅
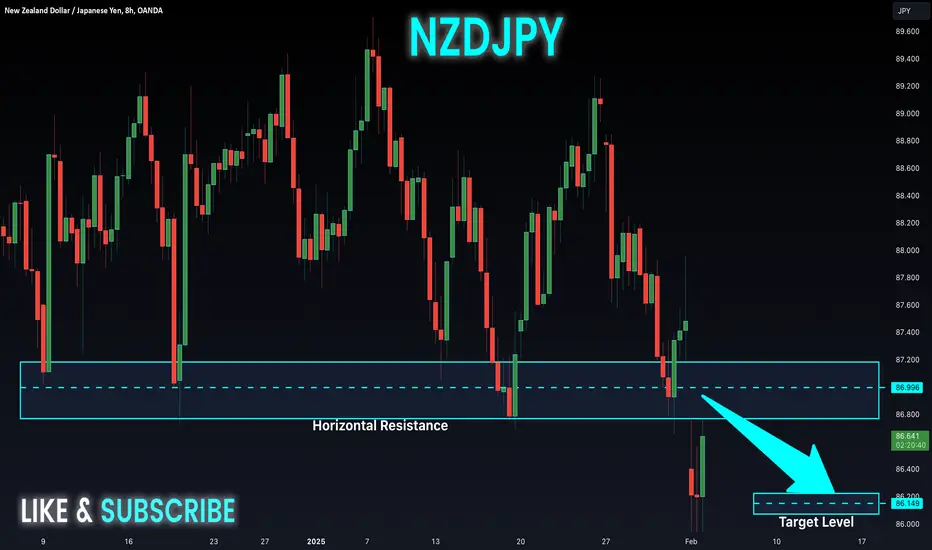
NZD-JPY Local Short! Sell!
Hello,Traders!
NZD-JPY is about to retest
A horizontal resistance level
Of 87.000 after a gap down
And a bearish breakout so
After the retest happens a
Local bearish pullback
Is to be expected
Sell!
Comment and subscribe to help us grow!
Check out other forecasts below too!
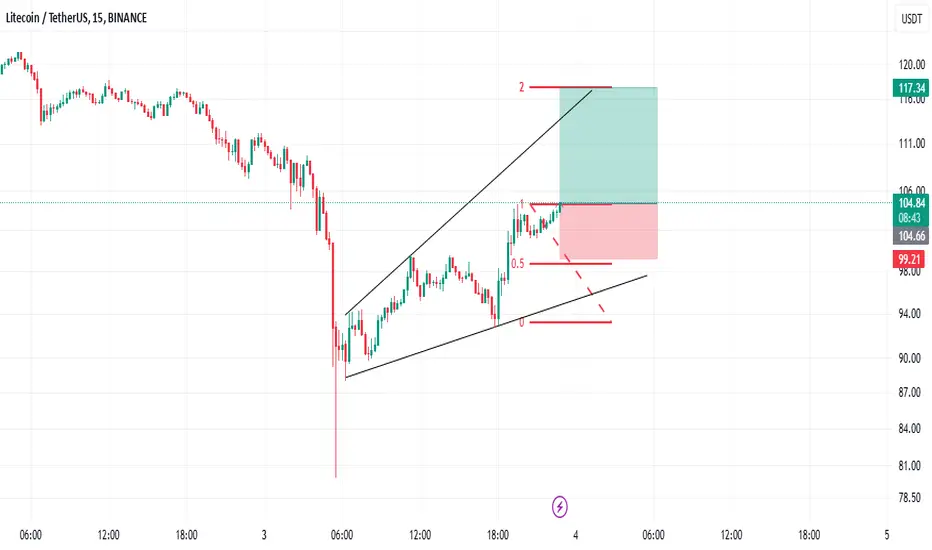
LTC BUYhello friends
According to the position of the price in the upward channel, we can enter into a transaction with capital management...
*Trade safely with us*
sui buyhello friends
Considering the rise we had, now with the failure of trading range, we can enter into a transaction with capital management...
*Trade safely with us*
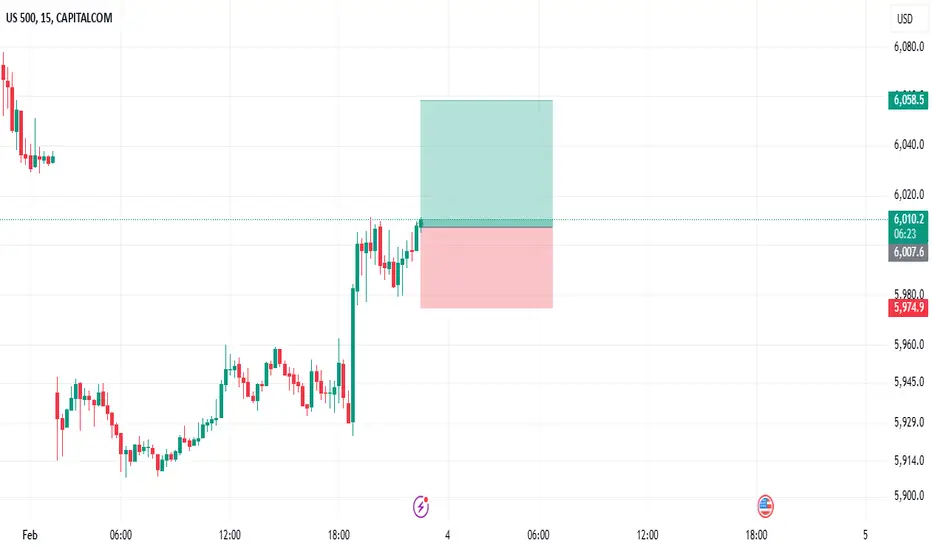
us500 buyhello friends
Considering the rise we had, now with the failure of trading range, we can enter into a transaction with capital management...
*Trade safely with us*
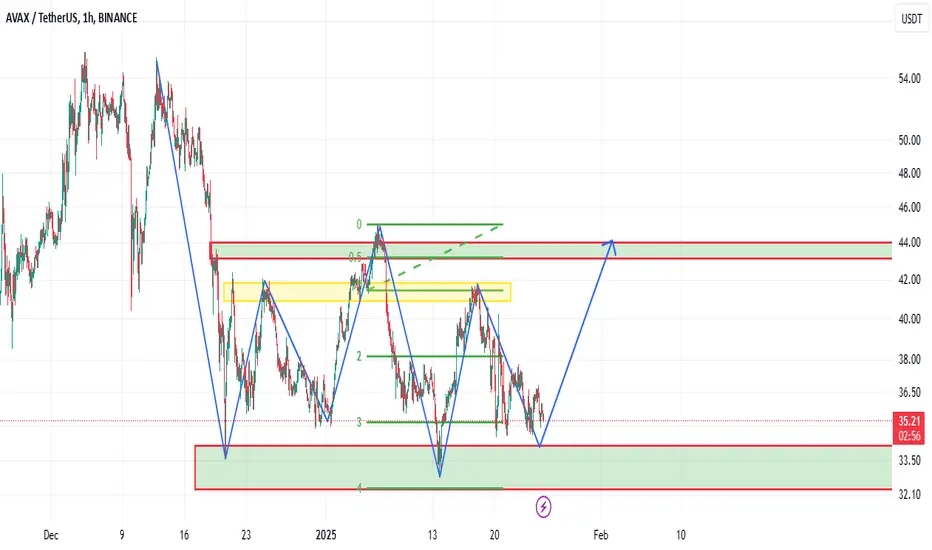
Avax analysis and review: another rise or fall?hello guys
We came with Avax analysis.
This coin has been suffering for almost 35 days after its price drop, and now that the price is at the bottom of the trading range, it is expected that we will have an upward movement by maintaining the support range up to the ceiling of the trading range.
In case of failure, we will give you a new update.
*Trade safely with us*
apt analysis: price correction and buying opportunity...hello friends
Considering the good growth we had, now that we have entered the correction, it is a good opportunity to buy a ladder with capital management...
We have specified goals for you.
*Trade safely with us*

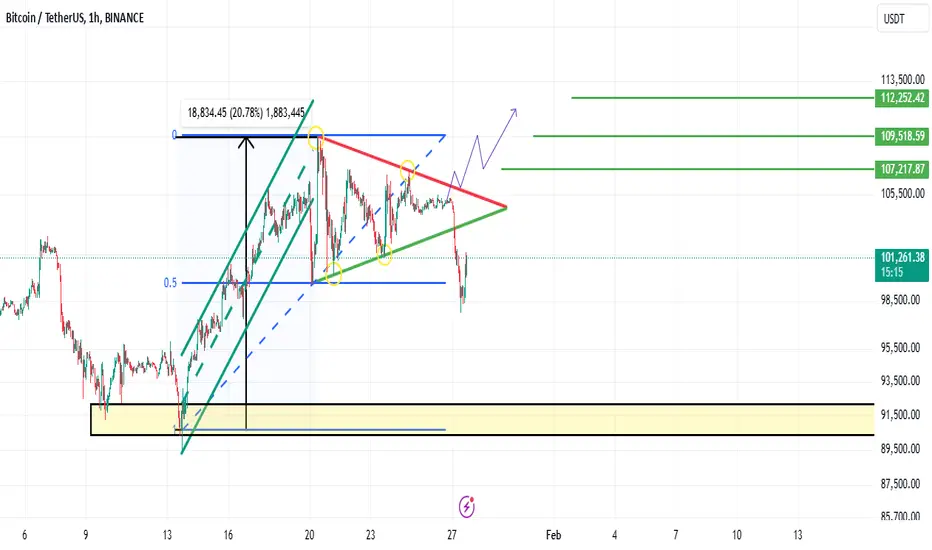
Bitcoin analysis: new update...hello friends
As we told you, we have to wait for the failure of the pattern, now with the failure of the pattern, we expect to have a pullback and after that the price can move up to the specified support.
And the indicated support range is an important support for Bitcoin that we expect to react well.
*Trade safely with us*
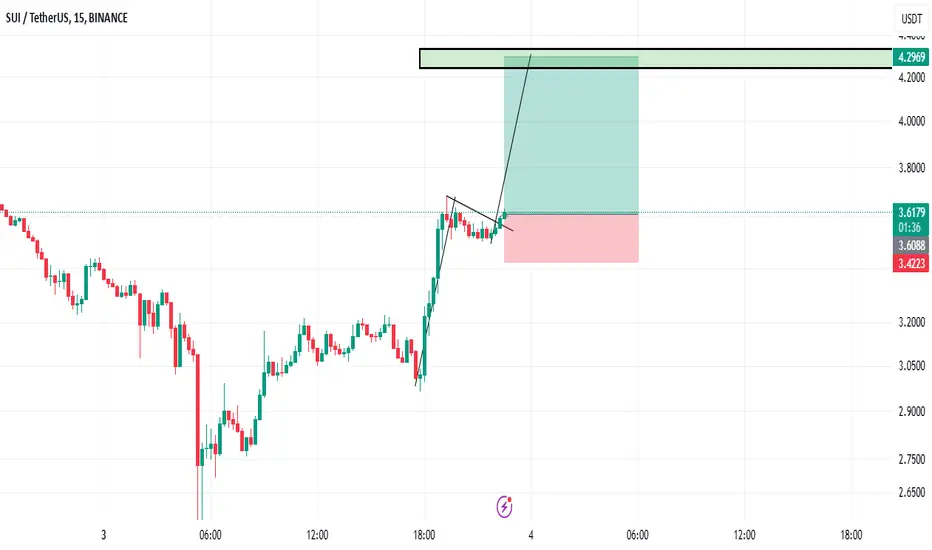
sui analysis: Safe shopping...hello friends
Considering the good upward trend we had, now that the entry price has been corrected, it is a good time to buy in steps and with capital management.
We have specified for you the steps of buying which are the support areas.
We have specified for you the goals, which are the resistance.
*Trade safely with us*

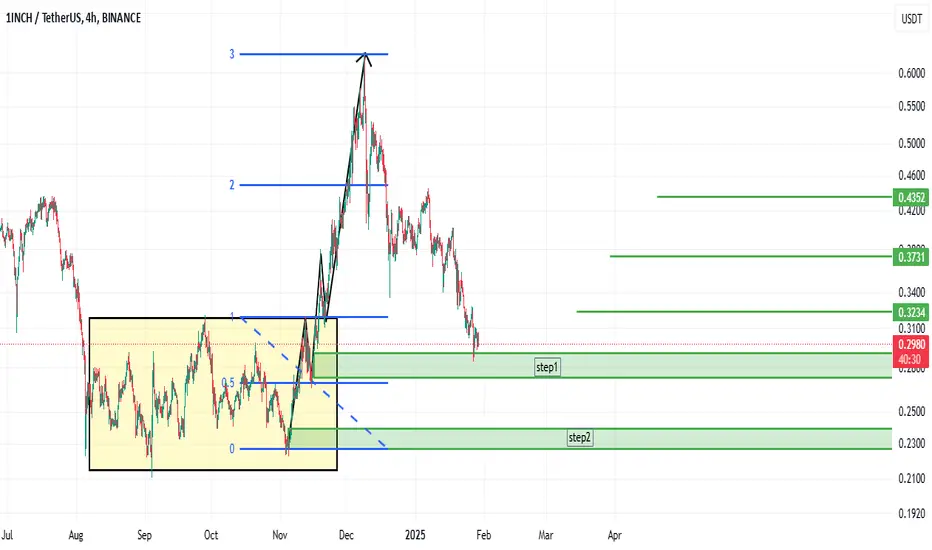
1inch review analysis: where to buy?hello friends
As you can see, this currency has grown well with the defeat of its suffering, now that it has entered a price correction, it is a good opportunity for us to buy in steps with capital and risk management.
We have specified goals for you.
*Trade safely with us*
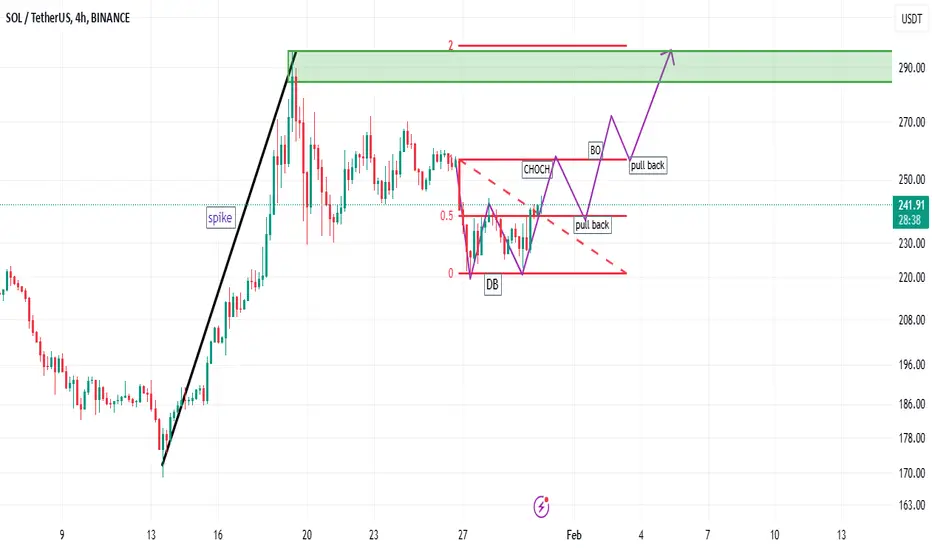
Analysis and analysis of Solana: the last chance to buy?hello friends
Considering the price growth we had and after that we entered the price correction, now we see a classic double bottom pattern in the price correction in the support area.
that by setting a higher ceiling, we can enter into a transaction with capital and risk management...
*Trade safely with us*
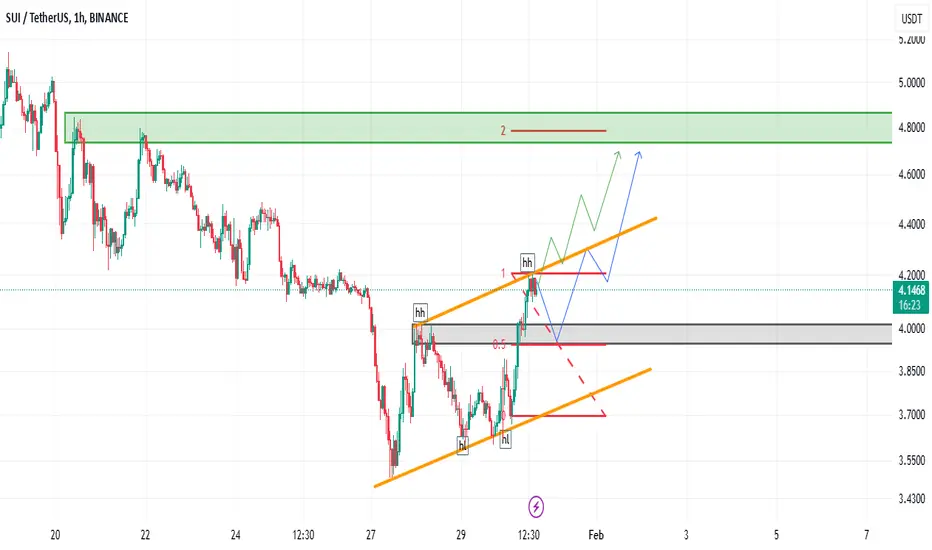
sui analysis and review: what should we do?hello friends
You can see that we have two scenarios here:
1_ From here, the price should break the channel it has formed and move up to the specified resistance range.
2- The price should be corrected and then he can prevent his failure.
Note that according to technical analysis, the channel is susceptible to failure, but nothing is 10%, so capital management should be observed.
*Trade safely with us*
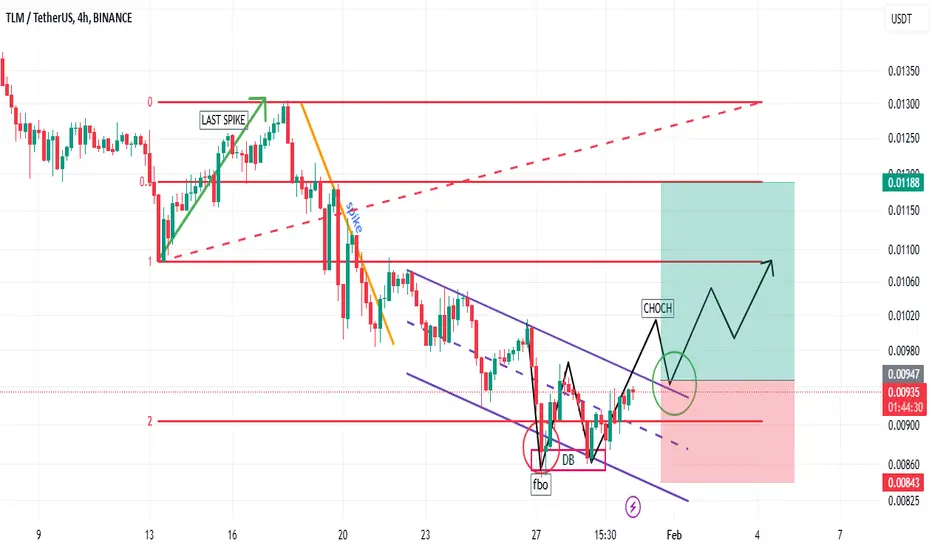
Analysis and review of TLM: Is it time to buy? Read the caption.hello friends
You can see that the price has started to fall after a strong movement to resistance and after falling, it is placed in a descending channel, which made the bottom of the channel a classic pattern for us.
Now we can enter the transaction with the successful channel failure.
And at least put ourselves under the last floor.
*Trade safely with us*
Bitcoin analysis: where is the important support?hello friends
Considering the growth we had, it is natural for the price to take a break.
Now that a formed range has seen the bottom of its range and returned according to the specified support area, it is very, very important that this area is not broken, and if it is, it will give us attractive buying points on altcoins, so there is no need to worry. ..
And by maintaining the support, we will witness the beginning of the next upward movement.
*Trade safely with us*

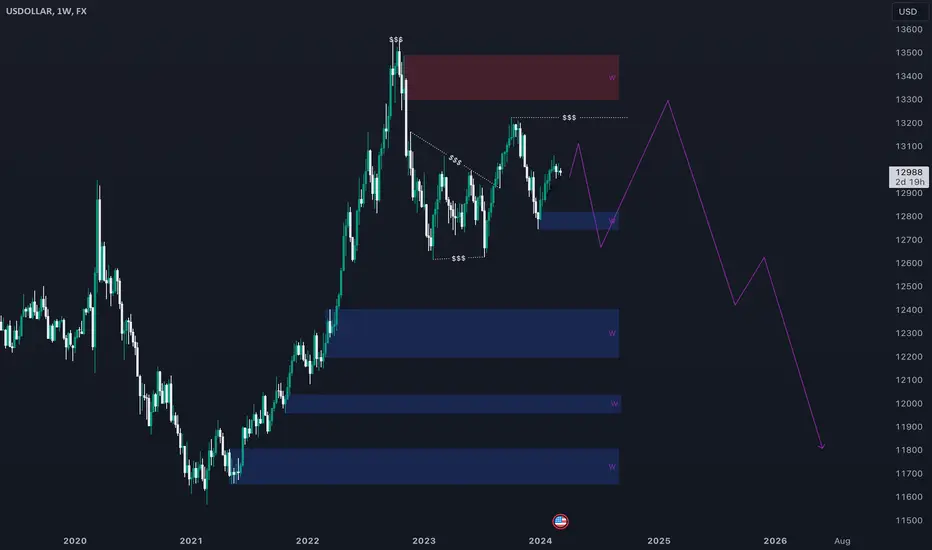
USDOLLAR, Weekly viewWeekly overview of USDOLLAR. Two liquidity zones are the next targets. I think the top one will be first filled and then the bottom one.
GOLD BREAKOUT CONFIRMED|LONG|
✅GOLD went up just as
We predicted in our previous
Analysis and the confirmed
The breakout of the key
Horizontal level of 2788$
While trading in an uptrend
Which reinforces our bullish
Bias and we will be expecting
A further bullish move up
LONG🚀
✅Like and subscribe to never miss a new idea!✅

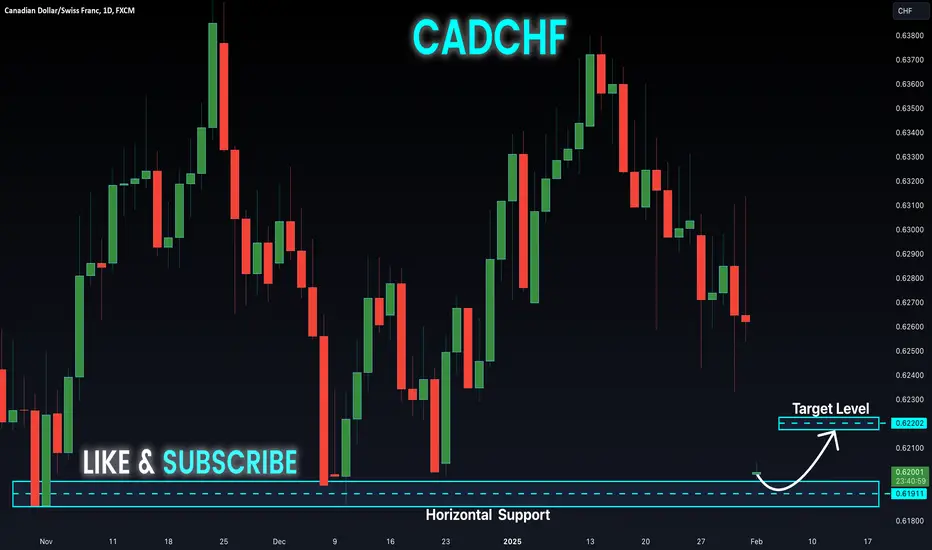
CAD-CHF Unexpected Gap! Buy!
Hello,Traders!
CAD-CHF made a sudden
Unexpected gap down at
The market open and the
Price has also reached a
Horizontal support level
Of 0.6185 from where
We will be expecting a
Bullish move up
Buy!
Comment and subscribe to help us grow!
Check out other forecasts below too!
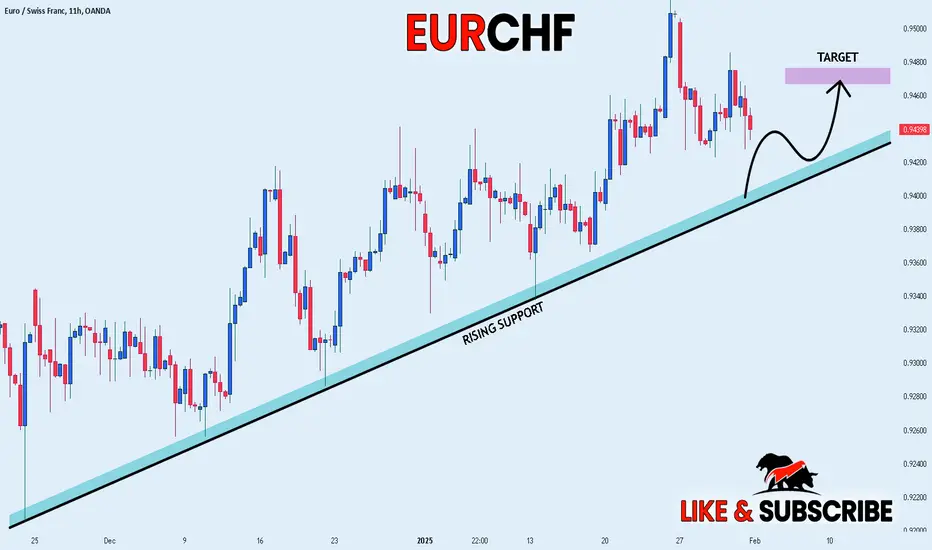
EUR_CHF IS TRADING IN AN UPTREND|LONG|
✅EUR_USD is trading along the rising support
And as the pair iis going down to retest it
I am expecting the price to go up
To retest the supply levels above at 0.9470
LONG🚀
✅Like and subscribe to never miss a new idea!✅
AUD-NZD Will Go Down! Sell!
Hello,Traders!
AUD-NZD made a bearish
Breakout of the rising support
And is now consolidating
Below the line so we are
Bearish biased and we will
Be expecting a further
Bearish continuation
Sell!
Comment and subscribe to help us grow!
Check out other forecasts below too!
SPY POTENTIAL SHORT|
✅SPY price went up sharply
But a strong resistance level was hit at 610.73$
Thus, as a pullback is already happening
And a move down towards the target shall follow at 596.00$
SHORT🔥
✅Like and subscribe to never miss a new idea!✅
