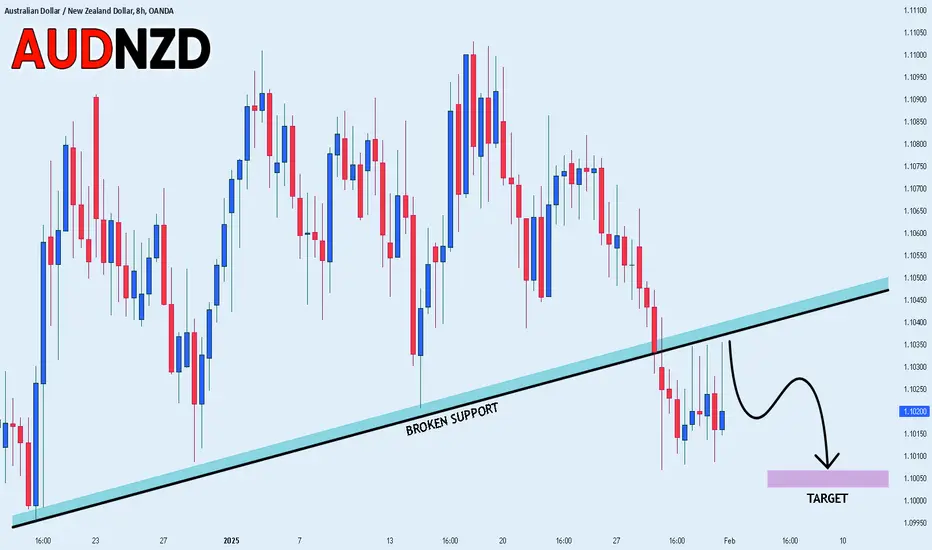
AUD_NZD BEARISH BIAS|SHORT|
✅AUD_NZD is trading in a
Local downtrend and the pair
Made a breakout of the rising
Support line and is consolidating
Beneath it, so as we area bearish
Biased we will be expecting
A further bearish move down
SHORT🔥
✅Like and subscribe to never miss a new idea!✅
Freesignals
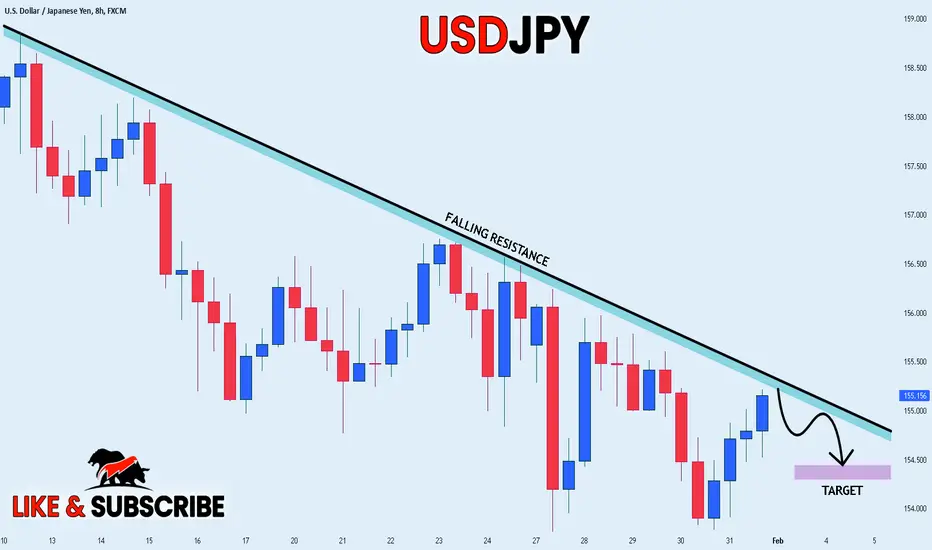
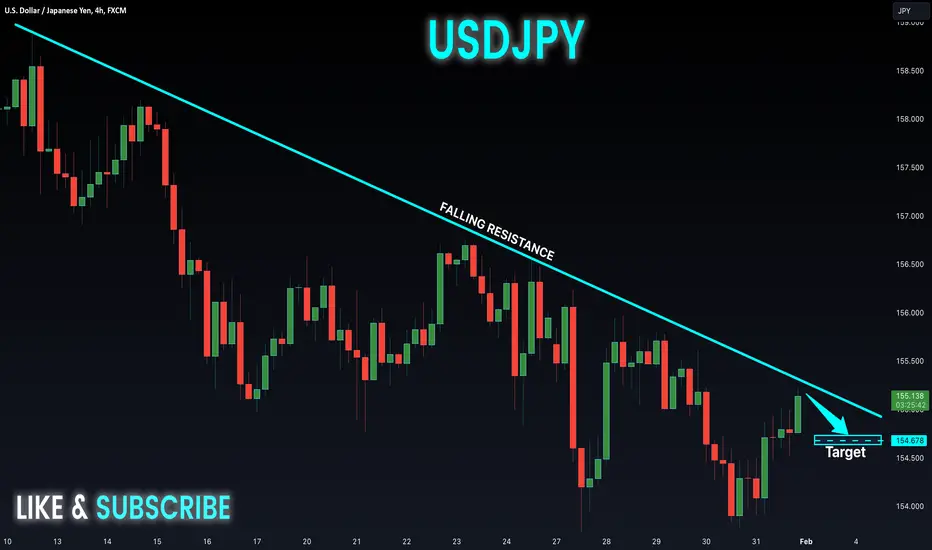
USD_JPY LOCAL SHORT|
✅USD_JPY is about to
Hit a falling resistance line
After a substantial bullish
Correction so we will be
Expecting a pullback and
A local move down
From the resistance on Monday
SHORT🔥
✅Like and subscribe to never miss a new idea!✅
GBP-USD Potential Long! Buy!
Hello,Traders!
GBP-USD is about to retest
A horizontal support level
Of 1.2365 and it is a strong
Level from where we will
Be expecting a bullish
Rebound and local move up
Buy!
Comment and subscribe to help us grow!
Check out other forecasts below too!

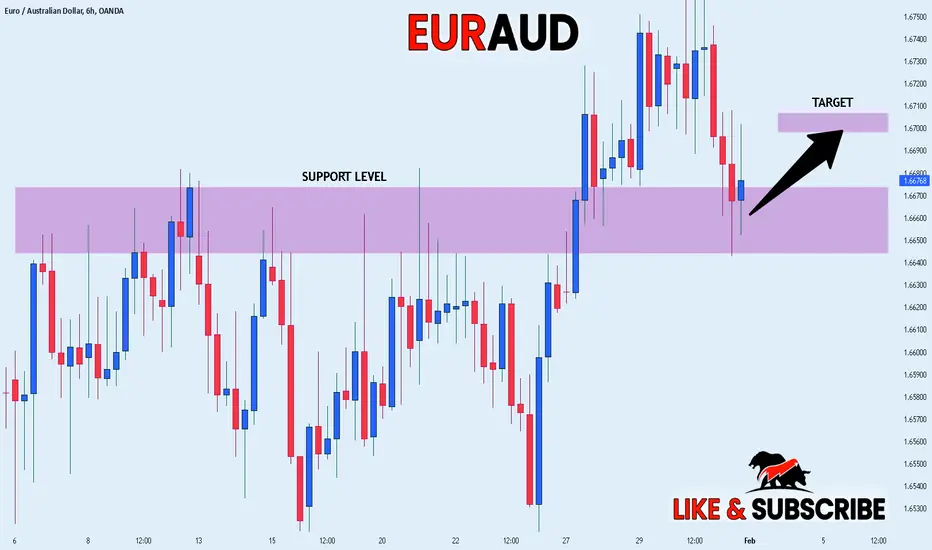
EUR_AUD REBOUND AHEAD|LONG|
✅EUR_AUD is going down now
But a strong support level is ahead at 1.6660
Thus I am expecting a rebound
And a move up towards the target at 1.6700
LONG🚀
✅Like and subscribe to never miss a new idea!✅
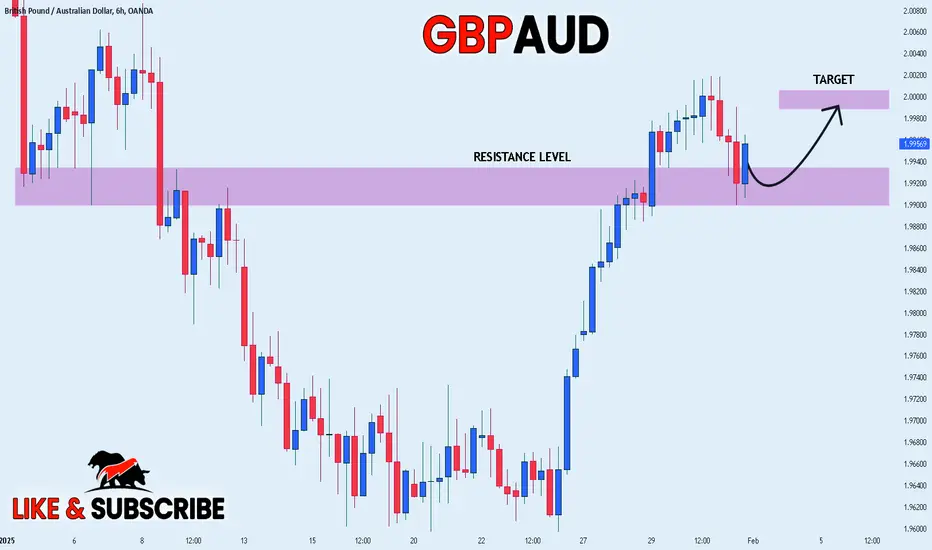
GBP_AUD GROWTH AHEAD|LONG|
✅GBP_AUD is already making
A bullish rebound from the
Horizontal support of 1.9920
So we are locally bullish biased
And we will be expecting a
Further move up
LONG🚀
✅Like and subscribe to never miss a new idea!✅
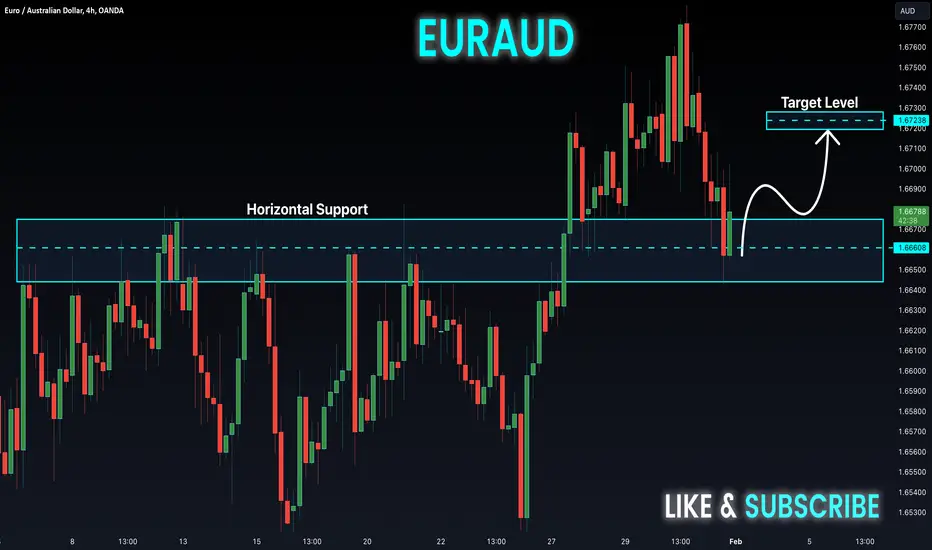
EUR-AUD Potential Long! Buy!
Hello,Traders!
EUR-AUD made a retest
Of the horizontal support
Level of 1.6650 and we
Are already seeing a
Bullish rebound so we
Will be expecting a
Further move up
Buy!
Comment and subscribe to help us grow!
Check out other forecasts below too!
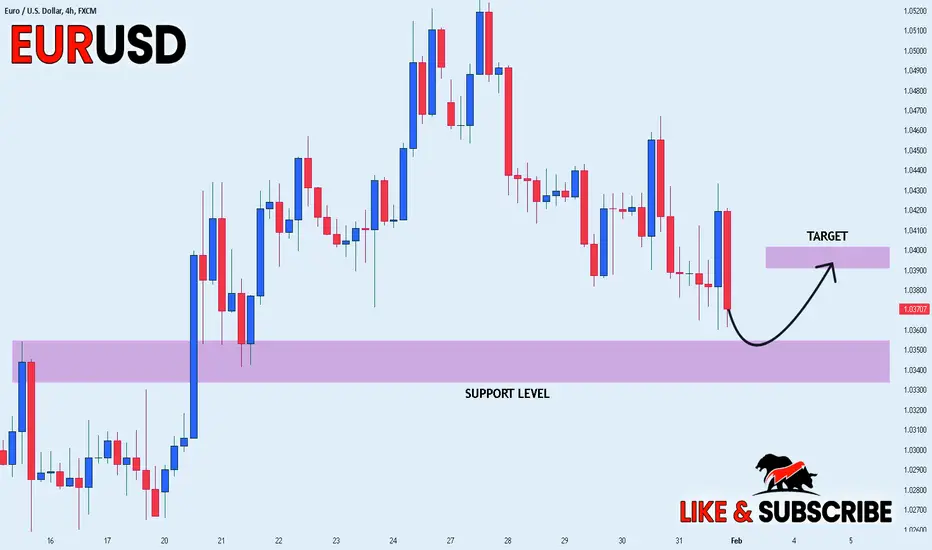
EUR_USD SUPPORT AHEAD|LONG|
✅EUR_USD is approaching a demand level of 1.0340
So according to our strategy
We will be looking for the signs of the reversal in the trend
To jump onto the bullish bandwagon just on time to get the best
Risk reward ratio for us
LONG🚀
✅Like and subscribe to never miss a new idea!✅
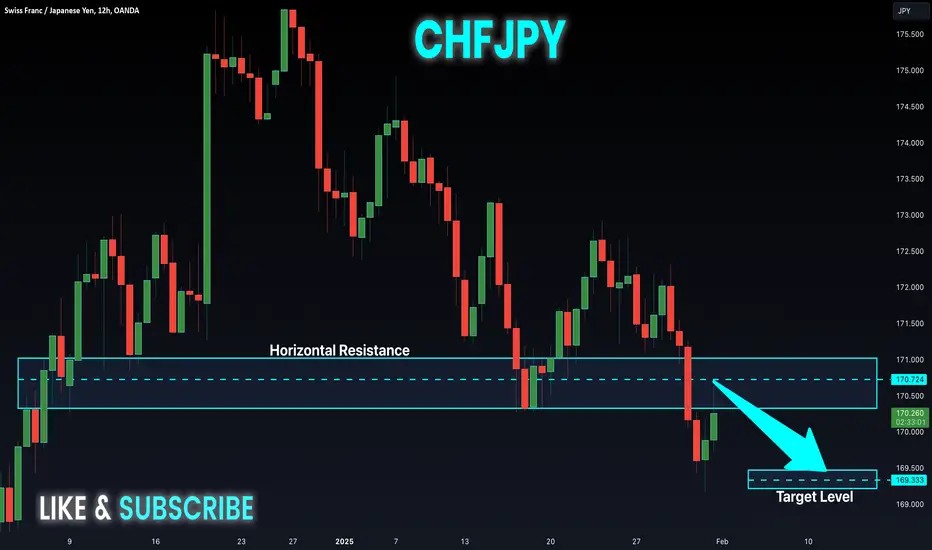
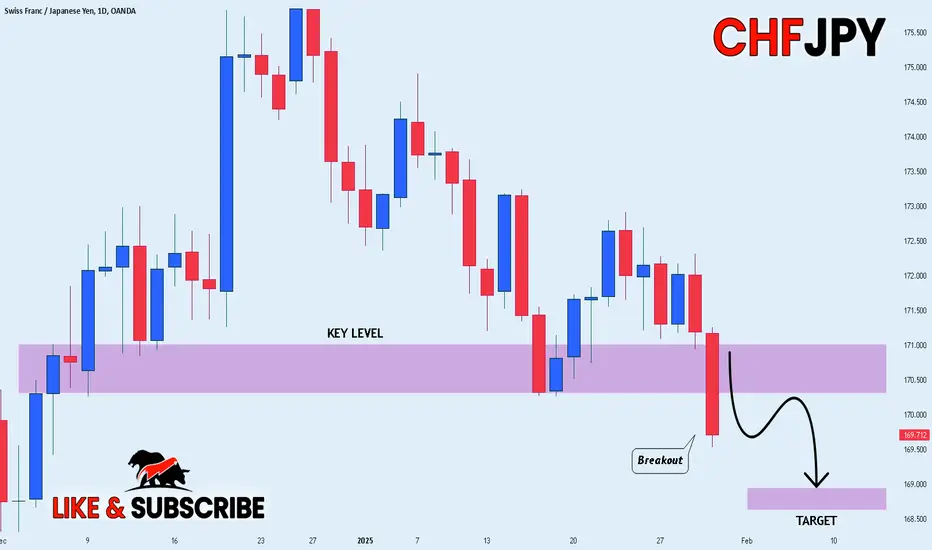
CHF-JPY Bearish Bias! Sell!
Hello,Traders!
CHF-JPY is going up now
But the pair will soon
Hit a horizontal resistance
Of 171.000 from where we
Will be expecting a local
Bearish move down
Sell!
Comment and subscribe to help us grow!
Check out other forecasts below too!
USD-JPY Risky Short! Sell!
Hello,Traders!
USD-JPY went up but will
Now retest a falling resistance
Line from where we will be
Expecting a local bearish
Correction and a move down
Sell!
Comment and subscribe to help us grow!
Check out other forecasts below too!
CHF_JPY BEARISH BREAKOUT|SHORT|
✅CHF_JPY made a bearish
Breakout while trading in a
Local downtrend and the breakout
Is confirmed so we are bearish
Biased and we will be
Expecting the pair to
Fall further down
SHORT🔥
✅Like and subscribe to never miss a new idea!✅
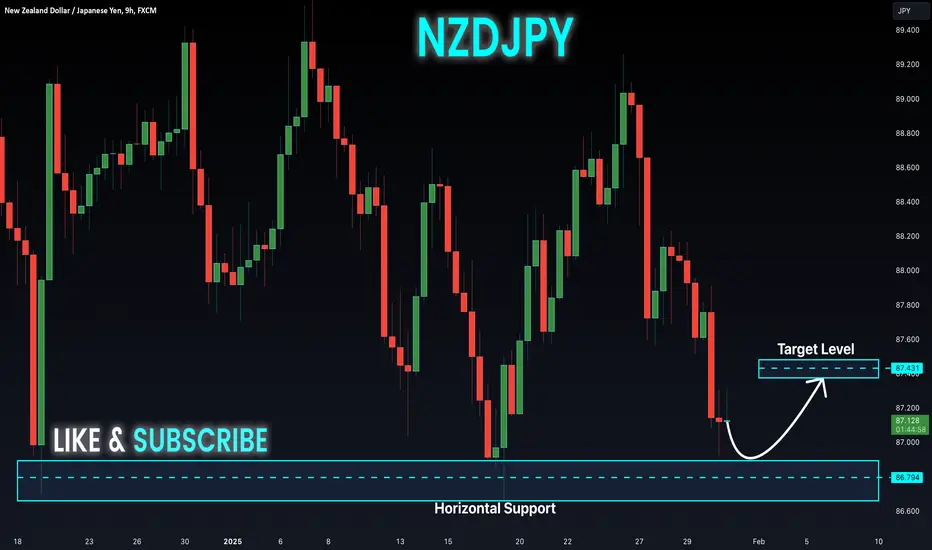
NZD-JPY Will Go UP! Buy!
Hello,Traders!
NZD-JPY is about to retest
The horizontal support
Of 86.659 after a strong
Move down so the pair is
Locally oversold and we
Will be expecting a bullish
Rebound from and move up
Buy!
Comment and subscribe to help us grow!
Check out other forecasts below too!
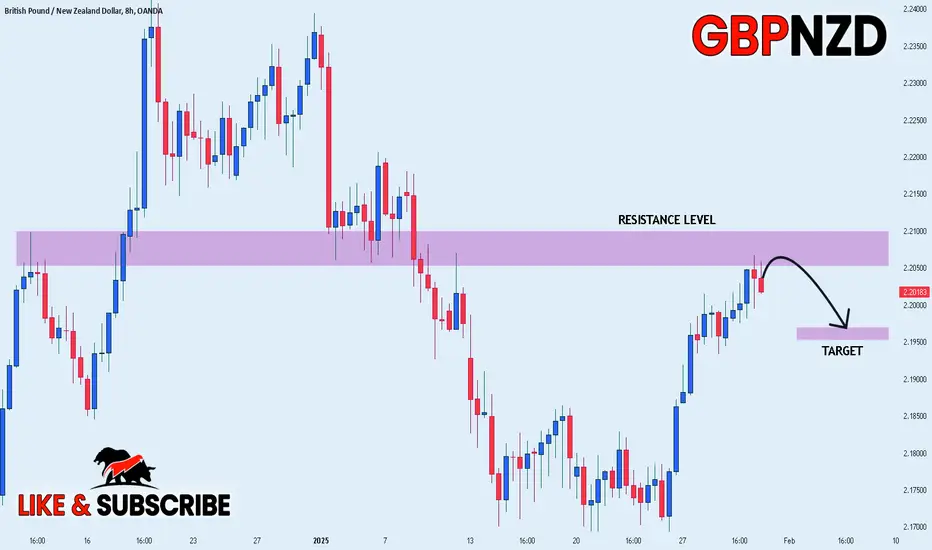
GBP_NZD WILL FALL|SHORT|
✅GBP_NZD has retested a key resistance level of 2.2100
And as the pair is already making a bearish pullback
A move down to retest the demand level below at 2.1967 is likely
SHORT🔥
✅Like and subscribe to never miss a new idea!✅
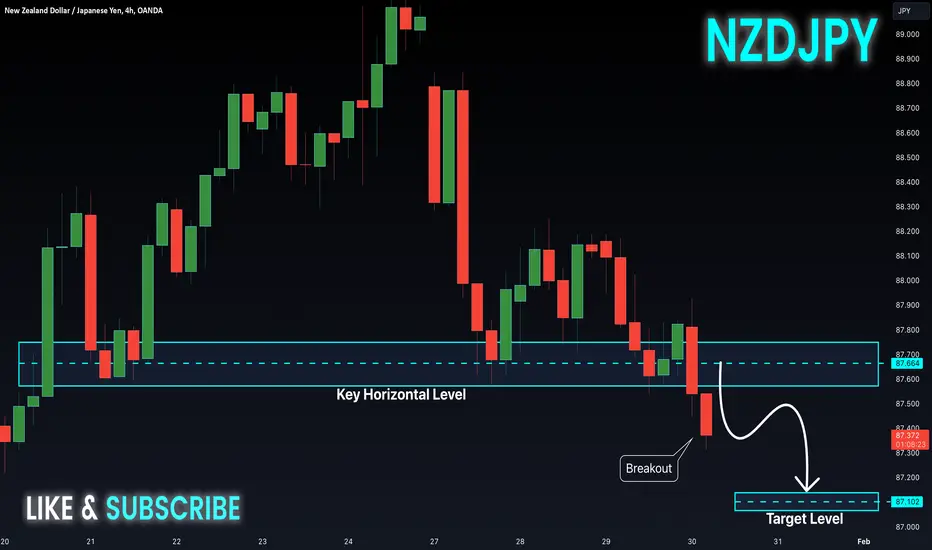
NZD-JPY Bearish Breakout! Sell!
Hello, Traders!
NZD-JPY is going down
Now and broke the key
Horizontal level of 87.700
Which is now a resistance
And the breakout is confirmed
So we are locally bearish biased
Now and we will be expecting a
Further bearish move down
Sell!
Comment and subscribe to help us grow!
Check out other forecasts below too!
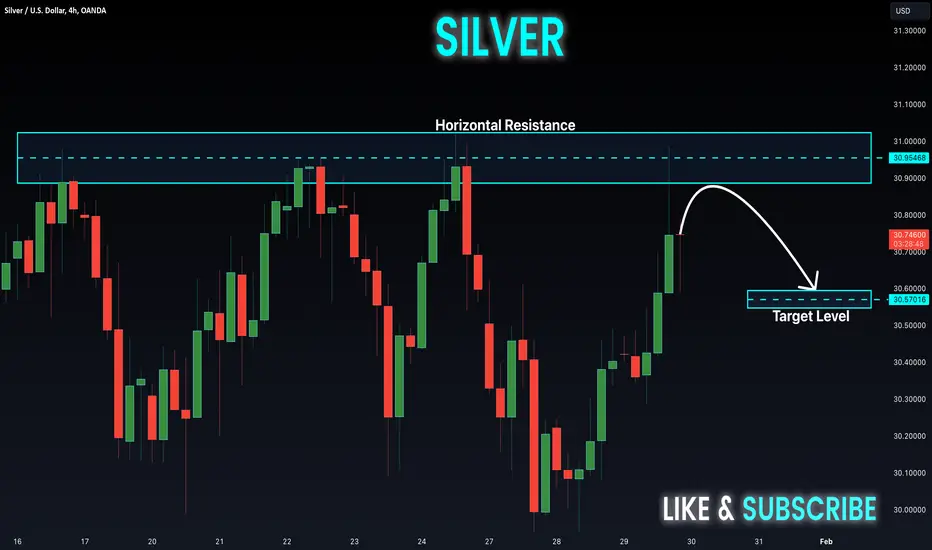
SILVER POTENTIAL SHORT|
✅SILVER is going up to retest a horizontal resistance of 31.00$
Which makes me locally bearish biased
And I think that we will see a pullback
And a move down from the level
Towards the target below at 30.75$
SHORT🔥
✅Like and subscribe to never miss a new idea!✅

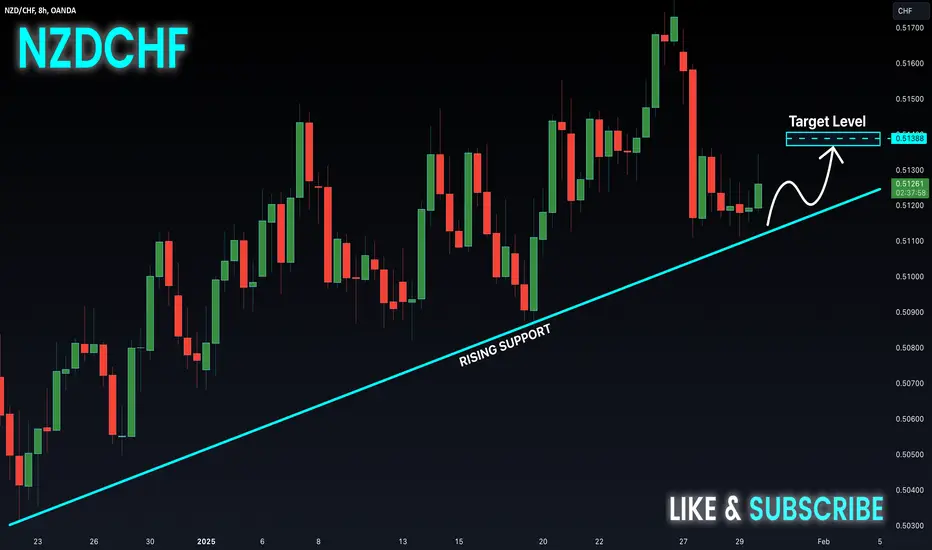
NZD-CHF Risky Long! Buy!
Hello,Traders!
NZD-CHF is trading along
The rising support line and
We are already seeing a
Bullish rebound after the
Retest of the rising support
So we are locally bullish
Biased and we will be
Expecting a further
Bullish move up
Buy!
Comment and subscribe to help us grow!
Check out other forecasts below too!
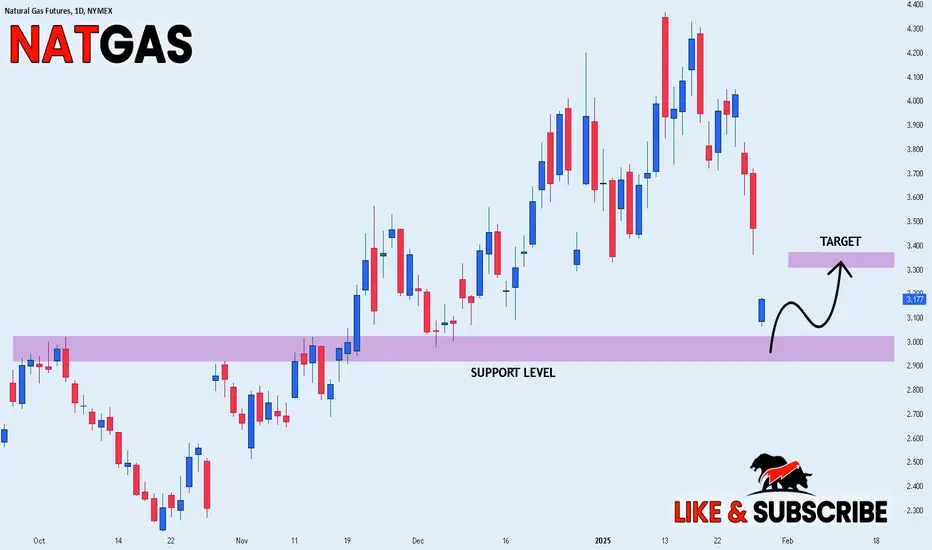
NATGAS GAP CLOSURE|LONG|
✅NATGAS gapped down massively
And the price has almost reached
The strong horizontal support
At the round level of 3.00$
And as Gas is objectively oversold
We are already seeing some
Gap closure moves and we
Will be expecting a further
Move up until the gap is
Closed completely
LONG🚀
✅Like and subscribe to never miss a new idea!✅
SILVER Resistance Ahead! Sell!
Hello,Traders!
SILVER went up sharply
But will soon hit a horizontal
Resistance level of 31.02$
From where we will be
Expecting a pullback and a
Local move down
Sell!
Comment and subscribe to help us grow!
Check out other forecasts below too!
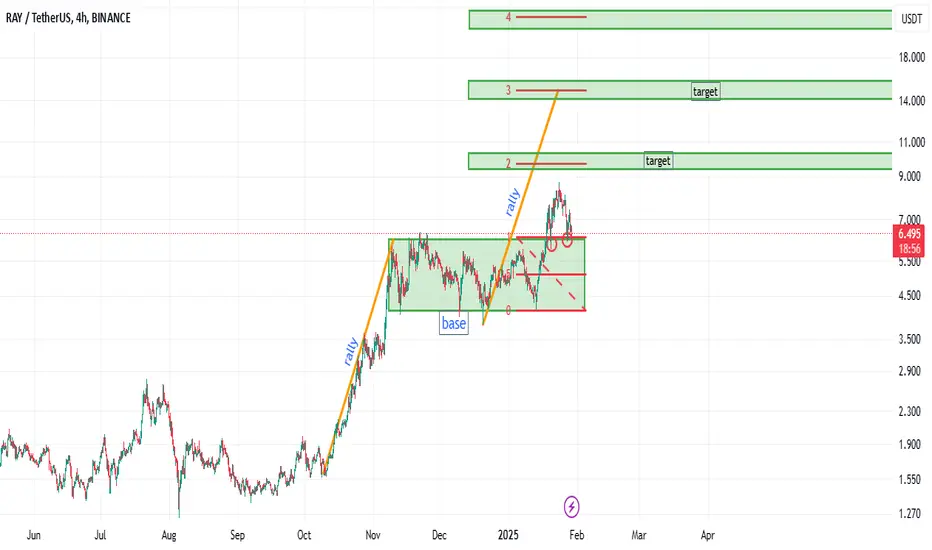
Ray review analysis: can we wait for the second wave of rise?hello friends
Due to the good price growth of this currency, it has been placed in a range, and with the breaking of that range, a double bottom pattern has been created on the ceiling of the range, which can be expected to move up to the specified limits.
We can enter into the transaction with capital and risk management.
*Trade safely with us*
Notcoin analysis: the best support area...hello friends
According to the correction of the price, the price is now in an important support range, which by taking into account the stabilization and not breaking of this support, the price can move up to the specified goals, of course, with capital management...
*Trade safely with us*

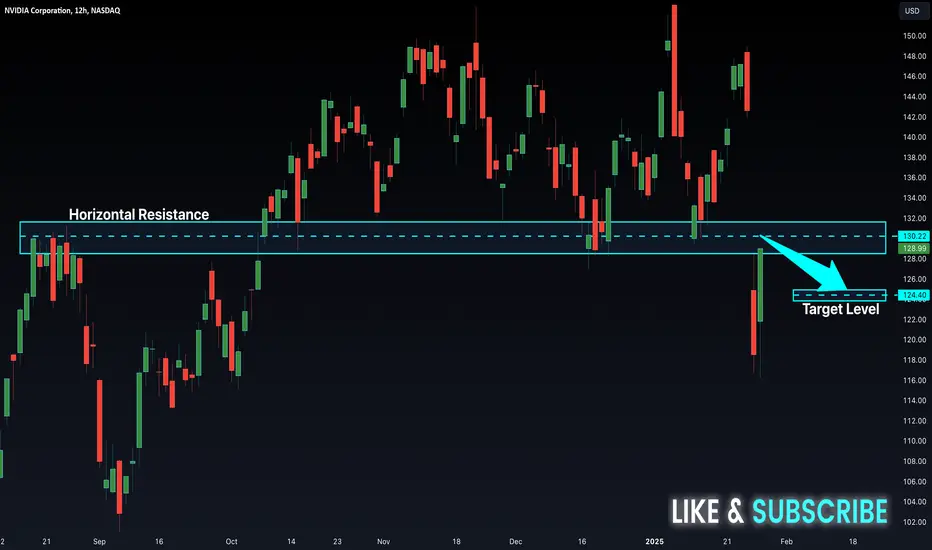
NVIDIA Retesting The Resistance! Sell!
Hello,Traders!
NVIDIA gapped down massively
On the DeepSeek news and
Went further down after the
Opening, but then a gap closing
Move started and the price is now
Retesting the horizontal resistance
Around 130/132$ which also
Happens to be the gap's opening
Level so based on technical analysis
We might be expecting a local
Bearish pullback from the resistance
Sell!
Comment and subscribe to help us grow!
Check out other forecasts below too!
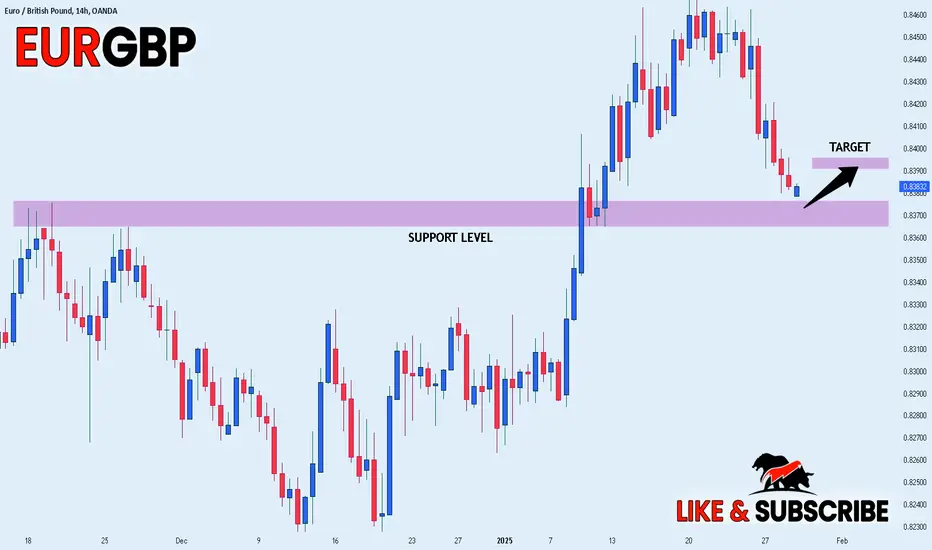
EUR_GBP BULLISH CORRECTION AHEAD|LONG|
✅EUR_GBP is set to retest a
Strong support level below at 0.837
After trading in a local downtrend from some time
Which makes a bullish rebound a likely scenario
With the target being a local resistance above at 0.8391
LONG🚀
✅Like and subscribe to never miss a new idea!✅
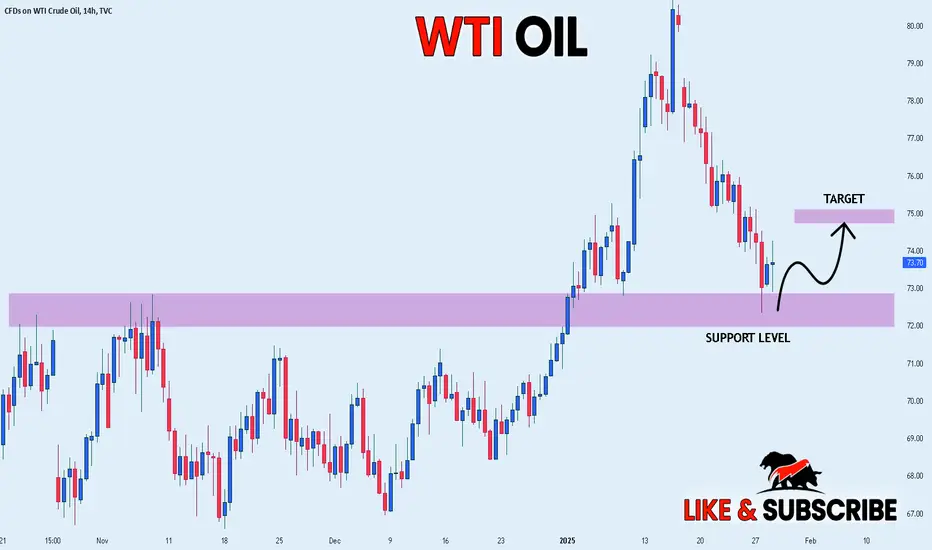
CRUDE OIL Will Go UP! Buy!
Hello,Traders!
CRUDE OIL made a massive
10% bearish correction but
Then it hit a horizontal support
Of 72.89$ and a bullish rebound
Is already happening so we
Are bullish biased and we will
Be expecting a further move up
Buy!
Comment and subscribe to help us grow!
Check out other forecasts below too!
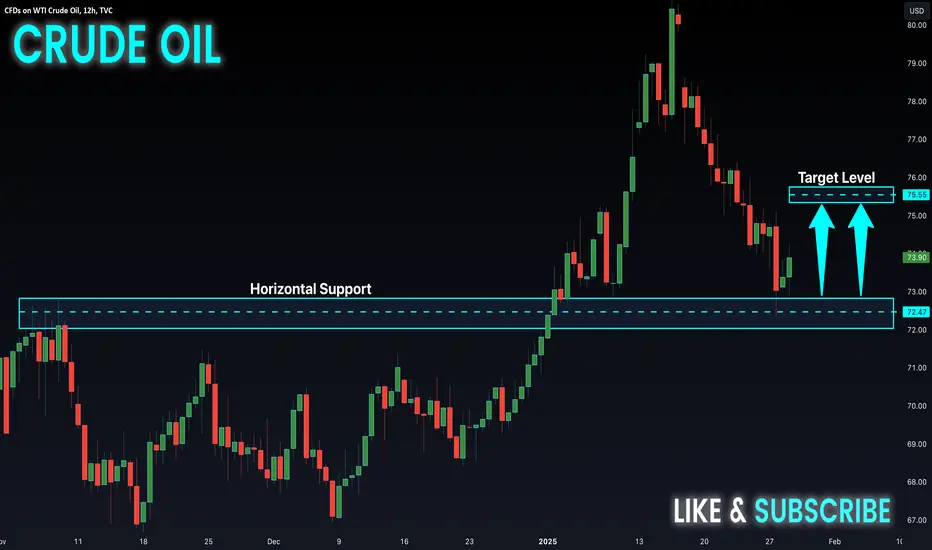
CRUDE OIL WILL GROW|LONG|
✅CRUDE OIL went down to retest a horizontal support of 73.00$
Which makes me locally bullish biased
And I think that a move up
From the level is to be expected
Towards the target above at 75.00$
LONG🚀
✅Like and subscribe to never miss a new idea!✅