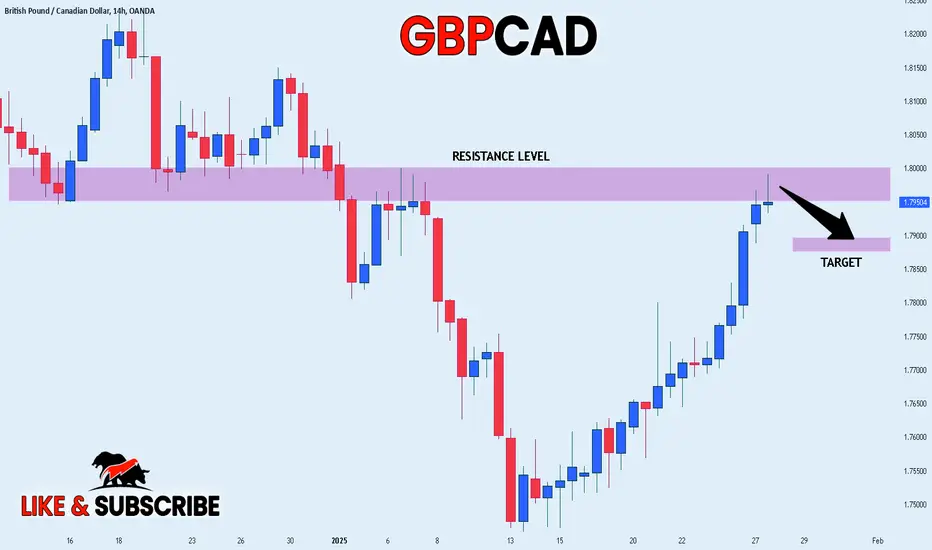
GBP_CAD RISKY SHORT|
✅GBP_CAD is going up to retest a horizontal resistance of 1.8000
Which makes me locally bearish biased
And I think that we will see a pullback
And a move down from the level
Towards the target below at 1.7900
SHORT🔥
✅Like and subscribe to never miss a new idea!✅
Freesignals
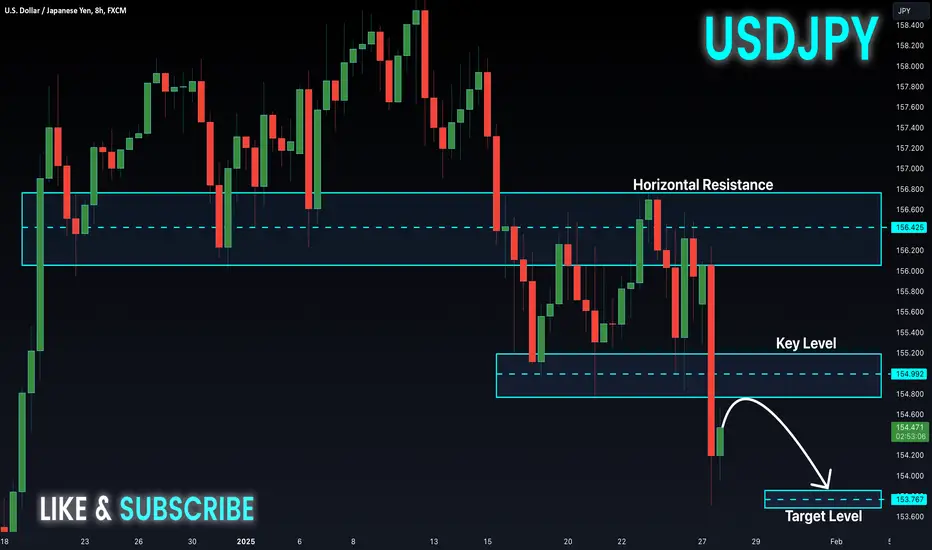
USD-JPY Will Go Down! Sell!
Hello,Traders!
USD-JPY is going down
And made a bearish breakout
So we are bearish biased
And after the retest of the
Broken level of 156.600
We will be expecting
A further move down
Sell!
Comment and subscribe to help us grow!
Check out other forecasts below too!
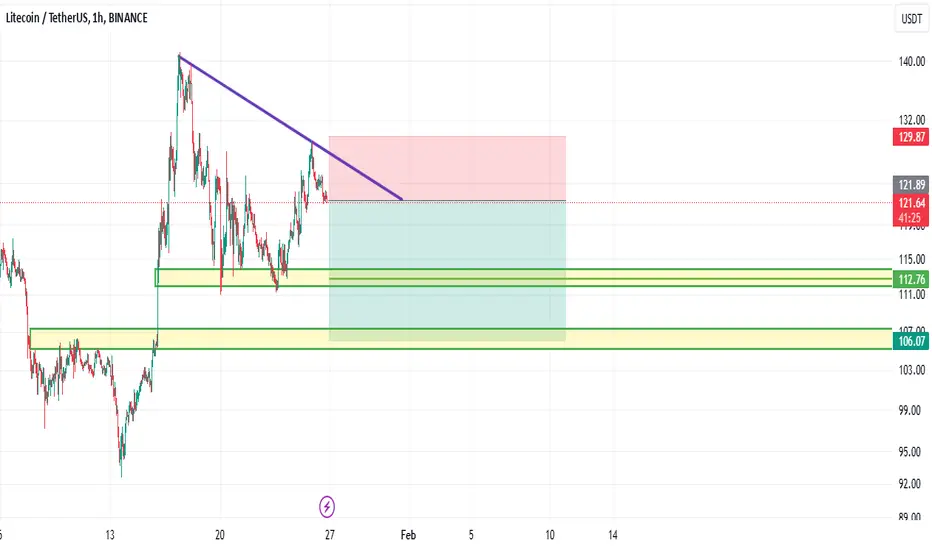
ltc hello friends
Considering the weakness of the trend and its return from resistance, we can enter into a transaction with capital management...
*Trade safely with us*
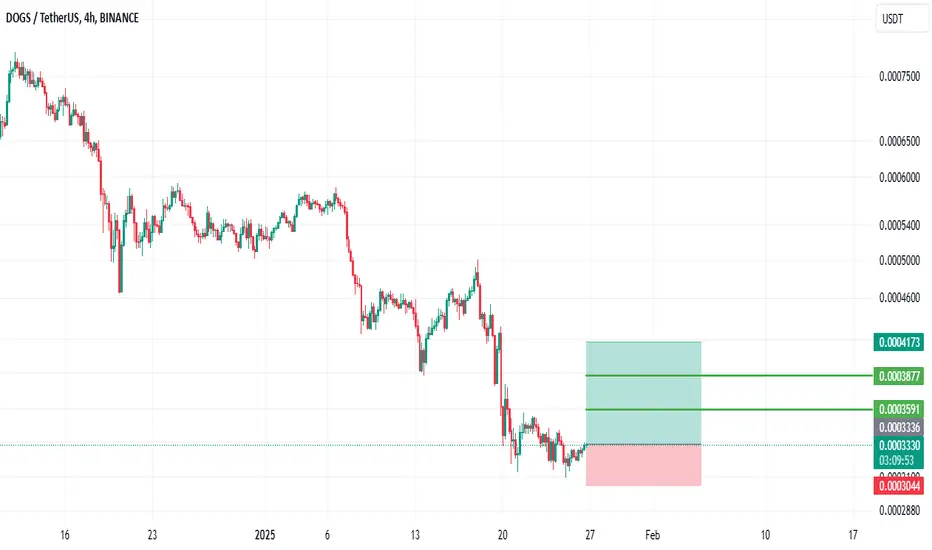
dogs analysis: risky position...hello friends
Due to the fall of this token, now that it is in a support area, we can enter into a transaction with capital and risk management.
*Trade safely with us*
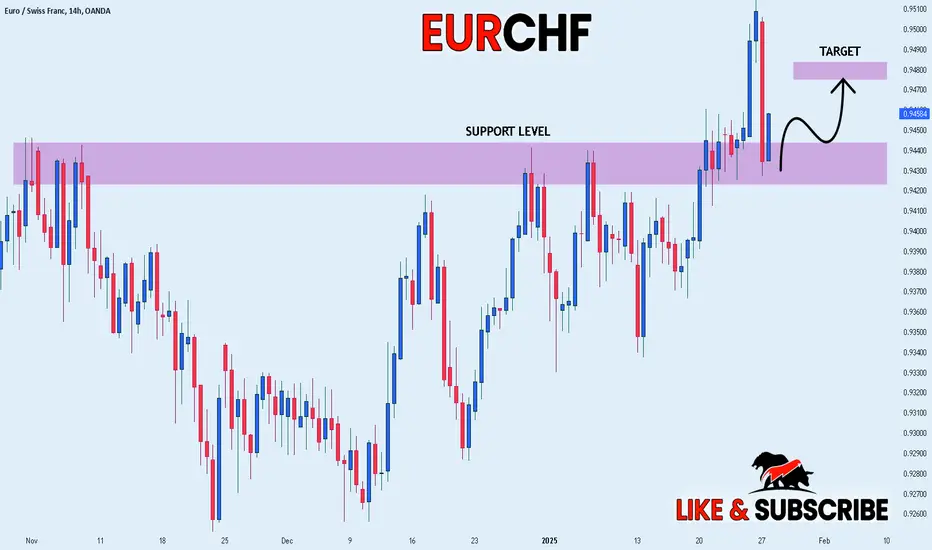
EUR_CHF LONG FROM SUPPORT|
✅EUR_CHF has retested a key support level of 0.9440
And as the pair is already making a bullish rebound
A move up to retest the supply level above at 0.9480 is likely
LONG🚀
✅Like and subscribe to never miss a new idea!✅
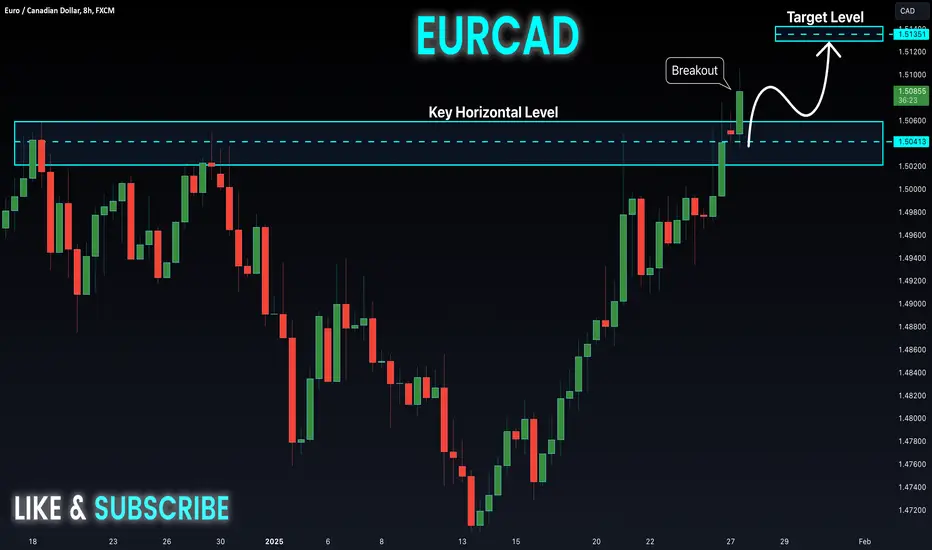
EUR-CAD Strong Breakout! Buy!
Hello,Traders!
EUR-CAD is trading in an
Uptrend and the pair has
Made a bullish breakout of
The key horizontal level
Of 1.5041 and the breakout
Is confirmed so we are
Bullish biased and we
Will be expecting a further
Bullish move up
Buy!
Comment and subscribe to help us grow!
Check out other forecasts below too!
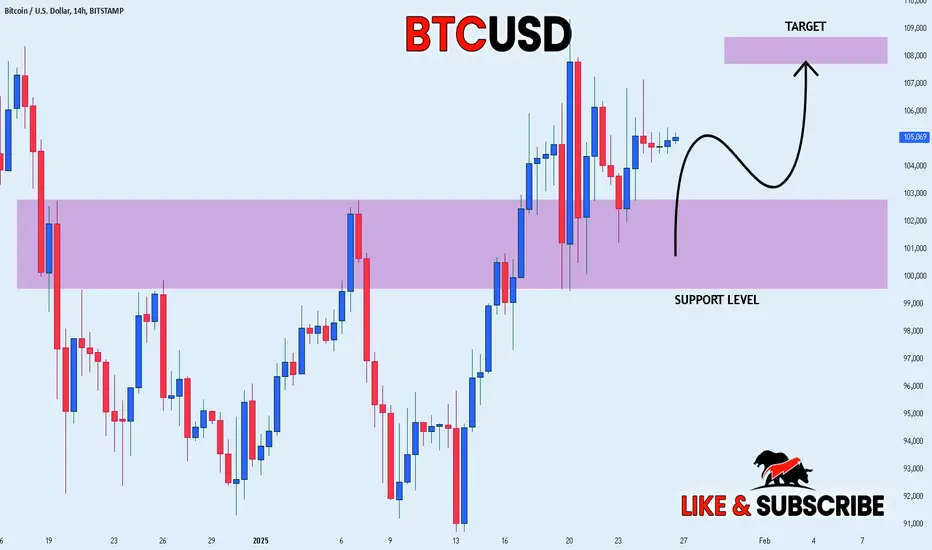
BITCOIN WILL KEEP GROWING|LONG|
✅BITCOIN is consolidating
Above the key horizontal
Support of 101.000 while
Trading in an uptrend so
We are bullish biased and
We will be expecting a
Further move up
LONG🚀
✅Like and subscribe to never miss a new idea!✅
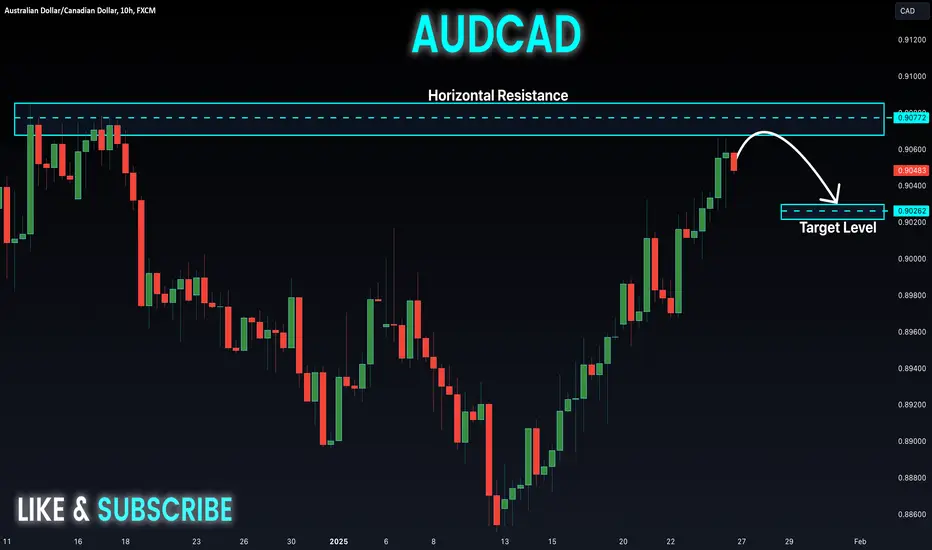
AUD-CAD Short From Resistance! Sell!
Hello,Traders!
AUD-USD keeps growing
And the pair is locally
Oversold so after it hits
A horizontal resistance
Of 0.9085 from where
We will be expecting a
Local bearish correction
Sell!
Comment and subscribe to help us grow!
Check out other forecasts below too!
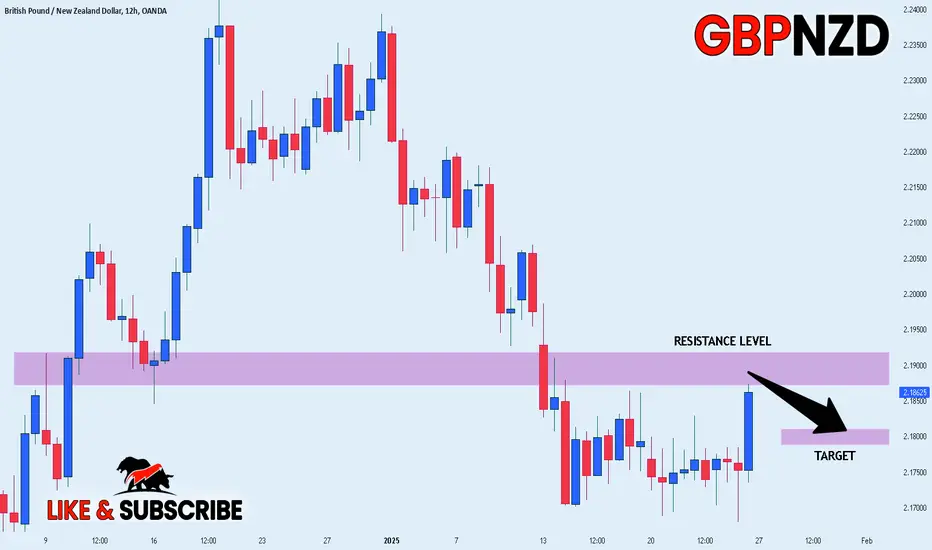
GBP_NZD RISKY SHORT|
✅GBP_NZD is going up now
But a strong resistance level is ahead at 2.1918
Thus I am expecting a pullback
And a move down towards the target at 2.1800
SHORT🔥
✅Like and subscribe to never miss a new idea!✅
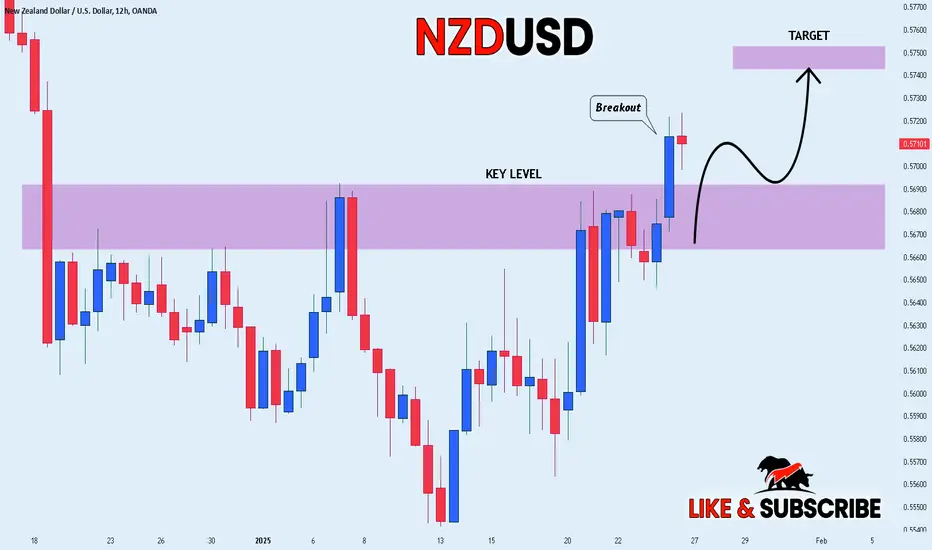
NZD_USD BULLISH BREAKOUT|LONG|
✅NZD_USD is going up and
We are already seeing a
Bullish breakout of the
Key horizontal level 0.5690
So we are bullish biased
And we will be expecting
Further growth
LONG🚀
✅Like and subscribe to never miss a new idea!✅
Ethereum review analysis: buying points and price targets...hello friends
The analysis of Ethereum that we had given you, now we have specified for you step-by-step purchase limits, and the goals have also been specified, and you can enter with capital management...
*Trade safely with us*

Bitcoin analysis: does the trend continue?hello friends
Considering the good upward trend we have in Bitcoin
Now, the price has made a pattern with the correction that it has made, which seems to be a continuous trend, and with the valid failure of the pattern, we can enter into a purchase transaction with capital management...
We have specified the goals for you in order.
*Trade safely with us*

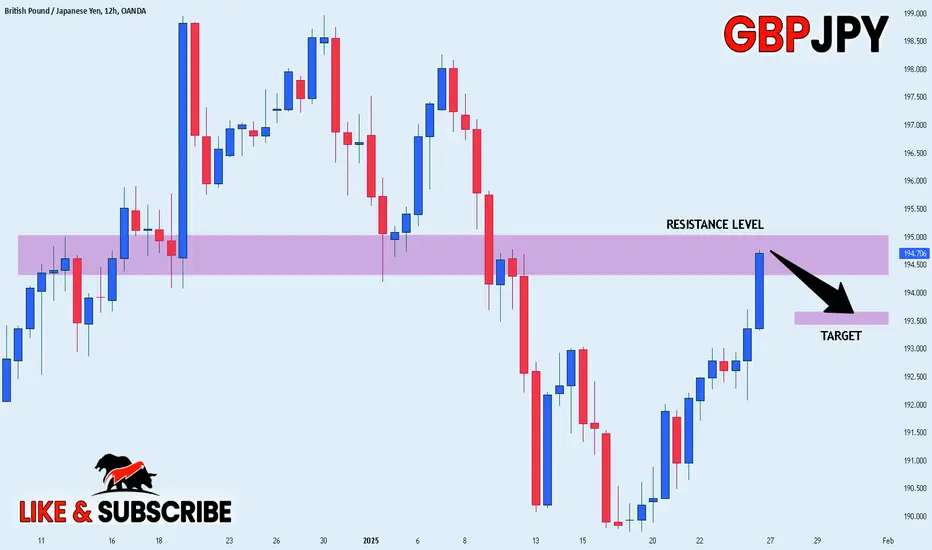
GBP_JPY RISKY SHORT|
✅GBP_JPY is retesting a resistance level of 195.000
From where I am expecting a bearish reaction
With the price going down but we need
To wait for a reversal pattern to form
Before entering the trade, so that we
Get a higher success probability of the trade
SHORT🔥
✅Like and subscribe to never miss a new idea!✅
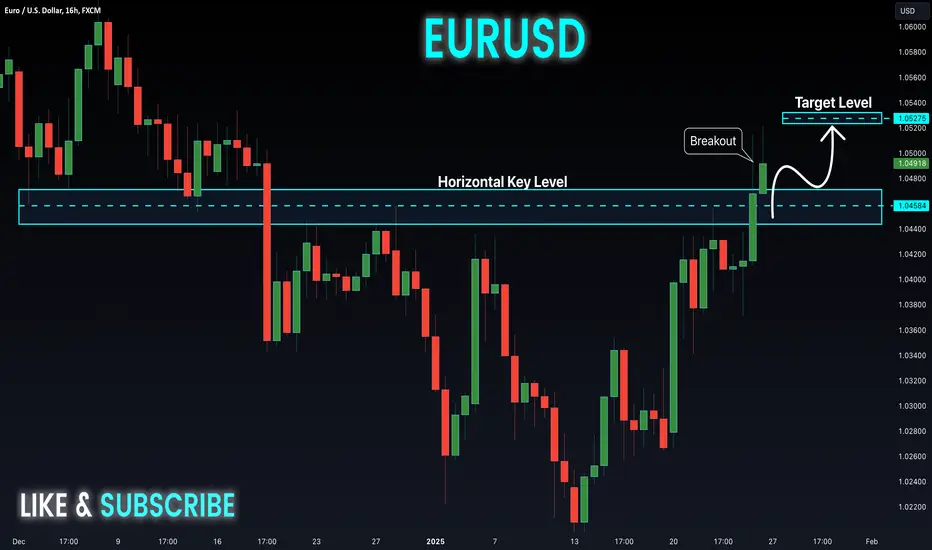
EUR-USD Strong Breakout! Buy!
Hello,Traders!
EUR-USD is trading in a
Local uptrend and the pair
Made a bullish breakout of
The key horizontal level
Of 1.0458 which reinforces
Our bullish bias and will
Be expecting a further
Bullish move up
Buy!
Comment and subscribe to help us grow!
Check out other forecasts below too!
Does history repeat itself?hello guys
We came with the analysis of this coin.
According to the past of the chart and the price correction and the period of time the price has been suffering, we can give the probability that the history will repeat itself.
we will see...
*Trade safely with us*

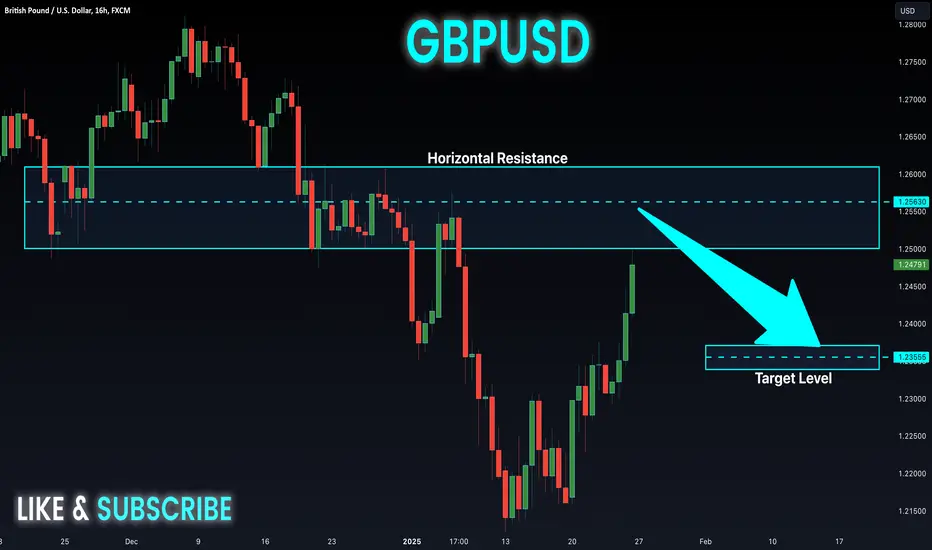
GBP-USD Will Fall! Sell!
Hello,Traders!
GBP-USD keeps growing
But wil soon hit a horizontal
Resistance level of 1.2600
From where we will be
Expecting a local bearish
Move down
Sell!
Comment and subscribe to help us grow!
Check out other forecasts below too!
Cardano analysis: Is it a buying opportunity?hello friends
Considering the good rise we had, now this coin has formed a channel for us, in case of failure, we can enter into a purchase transaction with capital management...
*Trade safely with us*

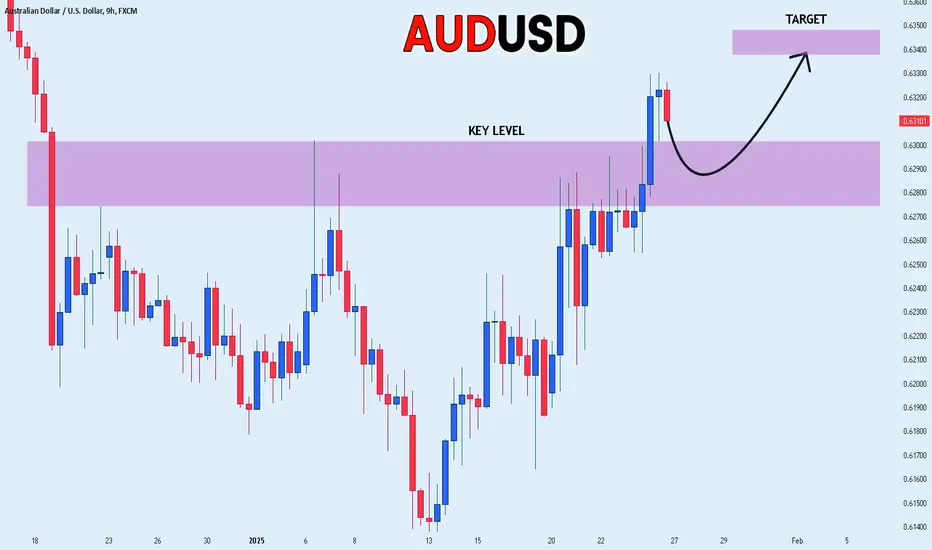
AUD_USD LOCAL LONG|
✅AUD_USD made a bullish
Breakout of the key horizontal
Level of 0.629 so we are
Locally bullish biased and
We will be expecting a
Further bullish move up
LONG🚀
✅Like and subscribe to never miss a new idea!✅
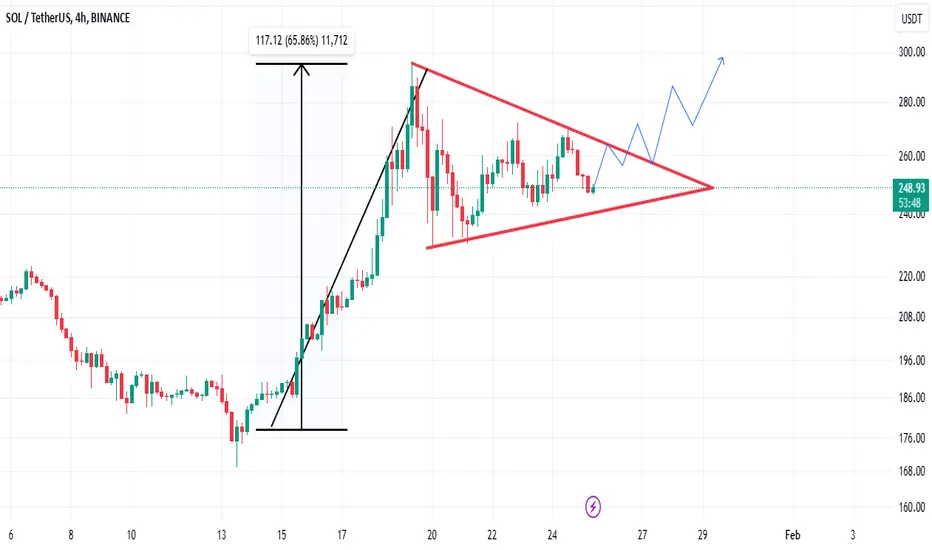
Solana Update: Is another rise coming?hello friends
We came with Solana's analysis.
This coin, whose signal we already gave you and it was pumped by 60%, now by being in this triangle pattern, it gives us this signal that with the failure of the triangle, we can enter into a transaction with capital management...
*Trade safely with us*
Complete analysis and review of Ethereumhello friends
We came with Ethereum analysis
As you can see, the price reached good support after a drop and was able to grow.
Now that the price has compressed and created a triangle for us, we are facing two scenarios:
1_ According to the beginning of the upward trend, succeed in breaking the ceiling and move to the specified goals.
2_ The price should fall from here until the support area is determined and then it starts to climb.
In our opinion, scenario 1 is more tolerant.
*Trade safely with us*

NIKKEI Local Short! Sell!
Hello,Traders!
NIKKEI is trading in an
Uptrend but the price has
Reached a horizontal resistance
Of 40,000 so despite our
Bullish bias we will be
Expecting a local
Bearish correction
Sell!
Comment and subscribe to help us grow!
Check out other forecasts below too!

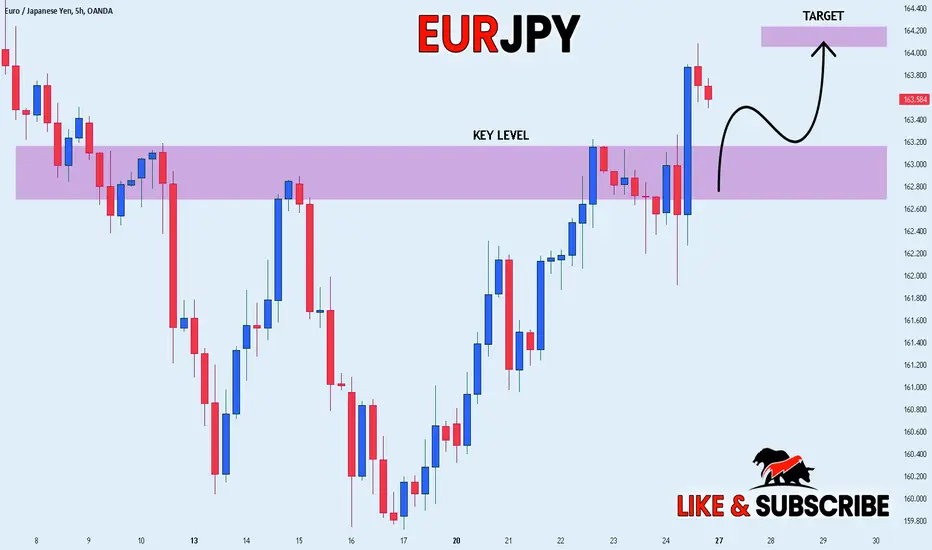
EUR_JPY GROWTH AHEAD|LONG|
✅EUR_JPY is trading in a
Local uptrend and the
Pair made a bullish breakout
Of the key horizontal level of 163.130
And the breakout is confirmed
So we are bullish biased
And we will be expecting
A further move up
LONG🚀
✅Like and subscribe to never miss a new idea!✅
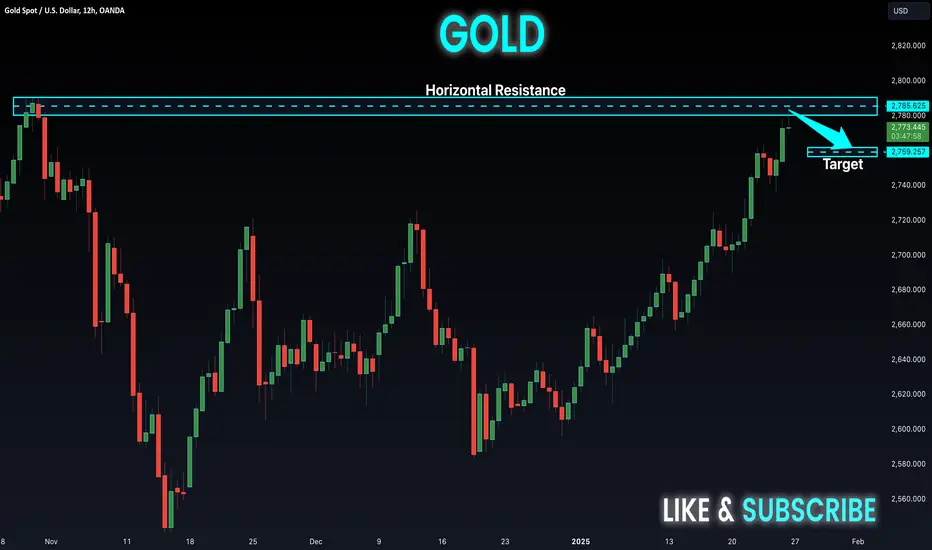
GOLD Short From All-Time-High! Sell!
Hello,Traders!
GOLD is trading in an
Uptrend and has reached
An all-time-high level of 2791.82$
Which is a strong horizontal resistance
So as Gold is locally overbought
We will be expecting a local
Bearish correction
Sell!
Comment and subscribe to help us grow!
Check out other forecasts below too!