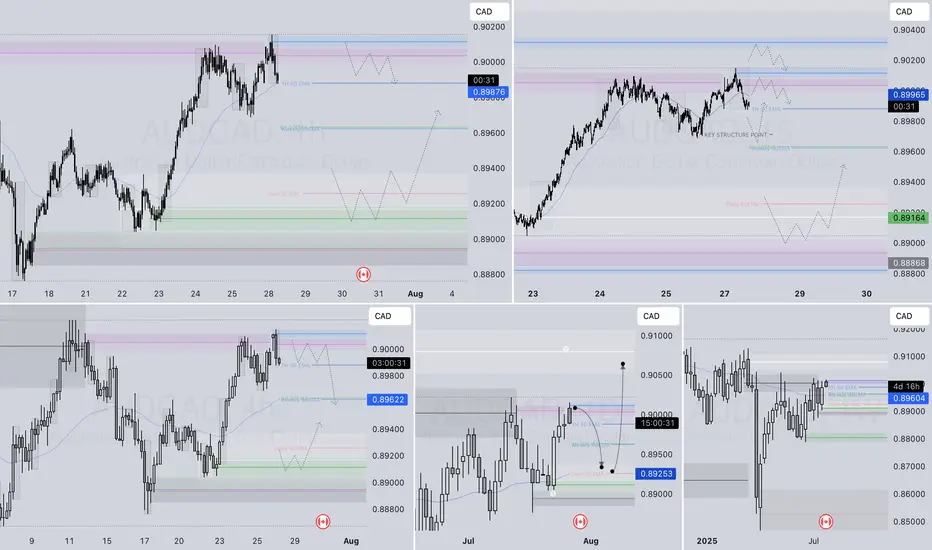
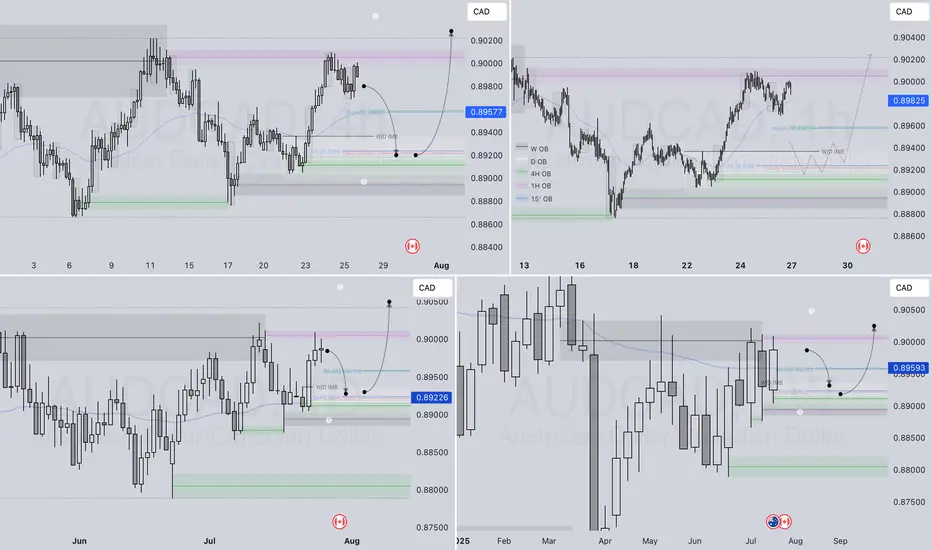
AUDCAD – DAILY FORECAST Q3 | W31 | D28 | Y25📊 AUDCAD – DAILY FORECAST
Q3 | W31 | D28 | Y25
Daily Forecast 🔍📅
Here’s a short diagnosis of the current chart setup 🧠📈
Higher time frame order blocks have been identified — these are our patient points of interest 🎯🧭.
It’s crucial to wait for a confirmed break of structure 🧱✅ before forming a directional bias.
This keeps us disciplined and aligned with what price action is truly telling us.
📈 Risk Management Protocols
🔑 Core principles:
Max 1% risk per trade
Only execute at pre-identified levels
Use alerts, not emotion
Stick to your RR plan — minimum 1:2
🧠 You’re not paid for how many trades you take, you’re paid for how well you manage risk.
🧠 Weekly FRGNT Insight
"Trade what the market gives, not what your ego wants."
Stay mechanical. Stay focused. Let the probabilities work.
FX:AUDCAD
Freesignals
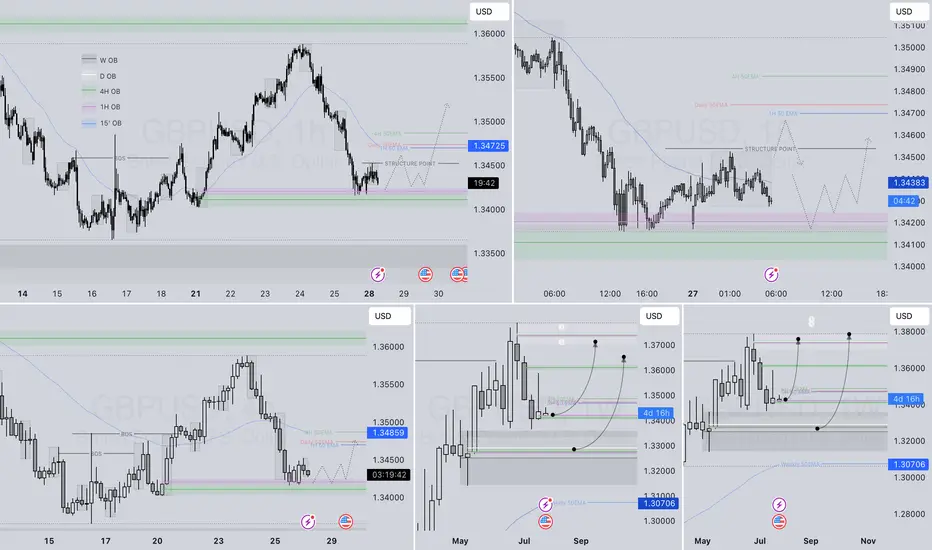
GBPUSD – DAILY FORECAST Q3 | W31 | D28 | Y25📊 GBPUSD – DAILY FORECAST
Q3 | W31 | D28 | Y25
Daily Forecast 🔍📅
Here’s a short diagnosis of the current chart setup 🧠📈
Higher time frame order blocks have been identified — these are our patient points of interest 🎯🧭.
It’s crucial to wait for a confirmed break of structure 🧱✅ before forming a directional bias.
This keeps us disciplined and aligned with what price action is truly telling us.
📈 Risk Management Protocols
🔑 Core principles:
Max 1% risk per trade
Only execute at pre-identified levels
Use alerts, not emotion
Stick to your RR plan — minimum 1:2
🧠 You’re not paid for how many trades you take, you’re paid for how well you manage risk.
🧠 Weekly FRGNT Insight
"Trade what the market gives, not what your ego wants."
Stay mechanical. Stay focused. Let the probabilities work.
FX:GBPUSD
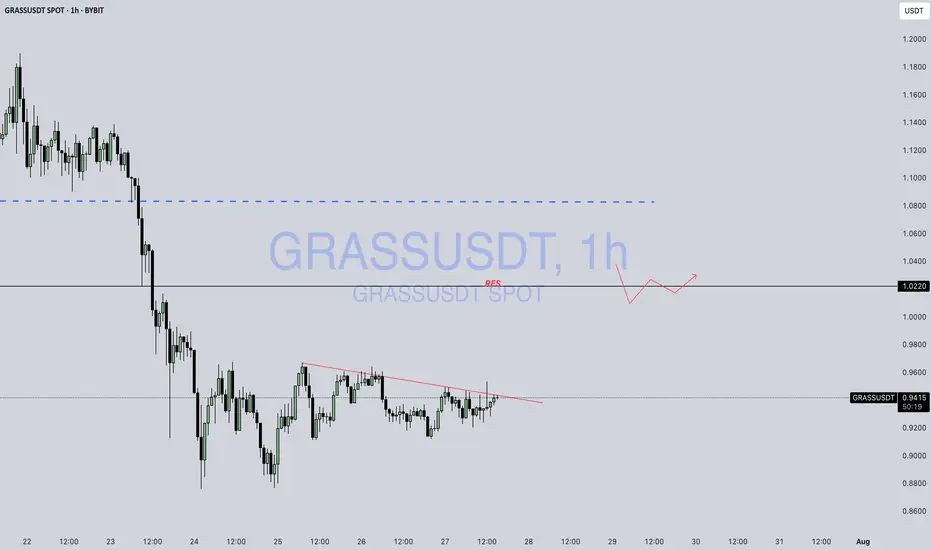
GRASS / USDTBYBIT:GRASSUSDT
Something’s cooking in GRASS coin… 🌱🔥
Be careful — big moves might be brewing. 👀📈
I mention guess it and enjoy the trade...
⚠️ Disclaimer: Not financial advice. Just market observation.
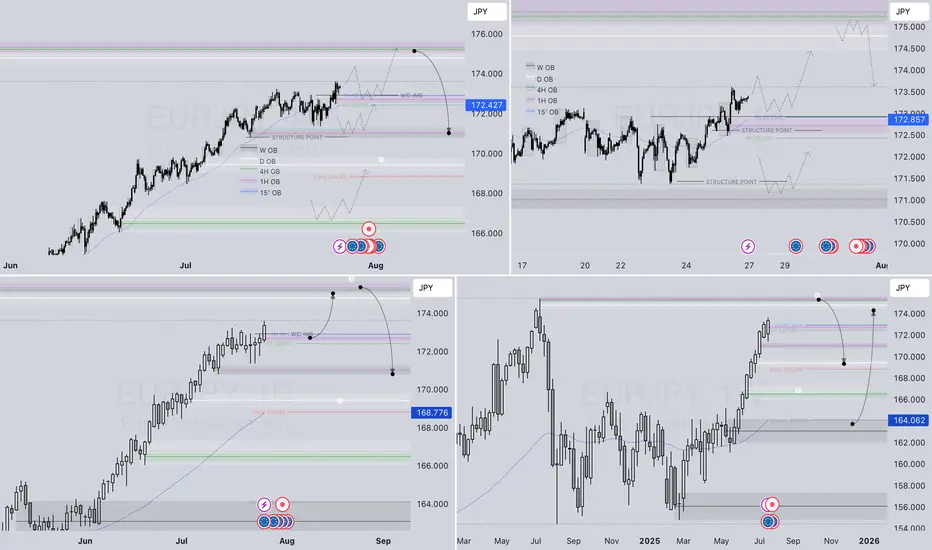
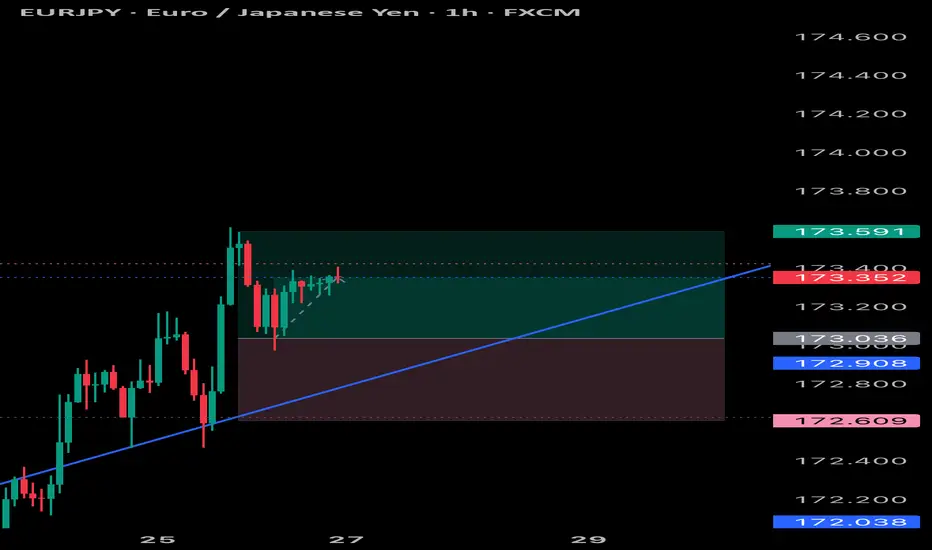
EURJPY – WEEKLY FORECAST Q3 | W31 | Y25📊 EURJPY – WEEKLY FORECAST
Q3 | W31 | Y25
Weekly Forecast 🔍📅
Here’s a short diagnosis of the current chart setup 🧠📈
Higher time frame order blocks have been identified — these are our patient points of interest 🎯🧭.
It’s crucial to wait for a confirmed break of structure 🧱✅ before forming a directional bias.
This keeps us disciplined and aligned with what price action is truly telling us.
📈 Risk Management Protocols
🔑 Core principles:
Max 1% risk per trade
Only execute at pre-identified levels
Use alerts, not emotion
Stick to your RR plan — minimum 1:2
🧠 You’re not paid for how many trades you take, you’re paid for how well you manage risk.
🧠 Weekly FRGNT Insight
"Trade what the market gives, not what your ego wants."
Stay mechanical. Stay focused. Let the probabilities work.
OANDA:EURJPY
AUDCAD – WEEKLY FORECAST Q3 | W31 | Y25📊 AUDCAD – WEEKLY FORECAST
Q3 | W30 | Y25
Weekly Forecast 🔍📅
Here’s a short diagnosis of the current chart setup 🧠📈
Higher time frame order blocks have been identified — these are our patient points of interest 🎯🧭.
It’s crucial to wait for a confirmed break of structure 🧱✅ before forming a directional bias.
This keeps us disciplined and aligned with what price action is truly telling us.
📈 Risk Management Protocols
🔑 Core principles:
Max 1% risk per trade
Only execute at pre-identified levels
Use alerts, not emotion
Stick to your RR plan — minimum 1:2
🧠 You’re not paid for how many trades you take, you’re paid for how well you manage risk.
🧠 Weekly FRGNT Insight
"Trade what the market gives, not what your ego wants."
Stay mechanical. Stay focused. Let the probabilities work.
FX:AUDCAD
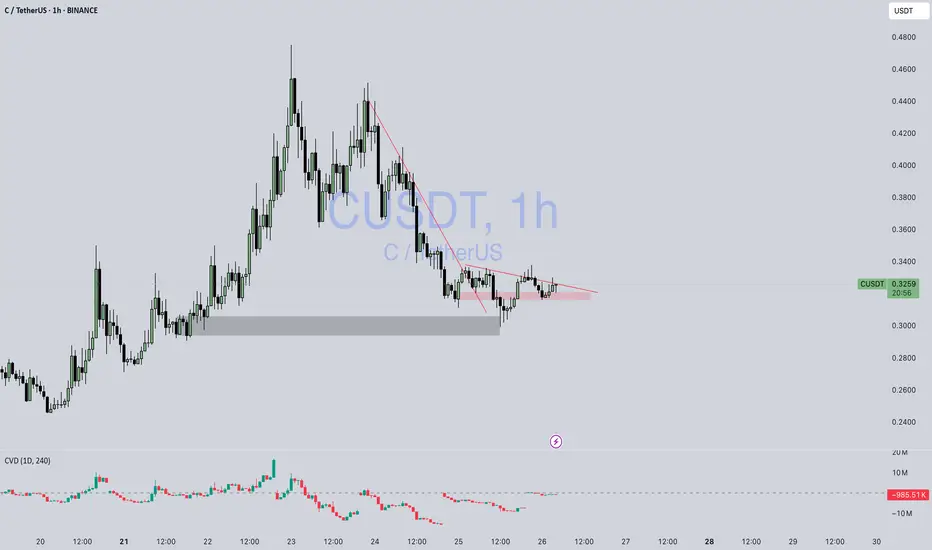
C / UsdtBINANCE:CUSDT
### **📊 Chart Overview – CUSDT (1H):**
* **Current Price:** \$0.3225
* **Recent Trend:** Price is consolidating below a **descending trendline (red)** after a sharp decline from \$0.44–\$0.45.
* **Key Levels:**
* **Support:** \$0.31 – \$0.32 (highlighted zone).
* **Resistance:** \$0.34 – \$0.35 (trendline breakout needed).
* **Major Resistance:** \$0.4456.
---
### **🔍 Technical Breakdown:**
1. **Downtrend Continuation:**
* Price is still below the **red descending trendline**, which acts as dynamic resistance.
* As long as it stays below \$0.34, the bears remain in control.
2. **Bullish Scenario:**
* A **clear breakout above \$0.34** with strong volume could lead to a push toward **\$0.37 – \$0.40**.
3. **Bearish Scenario:**
* Failure to hold **\$0.31 – \$0.32 support** could open doors to a drop towards **\$0.30 or even \$0.28**.
---
### **📌 Summary:**
CUSDT is in a **critical consolidation zone**. Watch the **\$0.32 support** and **\$0.34 resistance** closely — a breakout or breakdown could decide the next move.
---
⚠️ **Disclaimer:**
*This analysis is for educational purposes only, not financial advice. Always do your own research and trade carefully.*
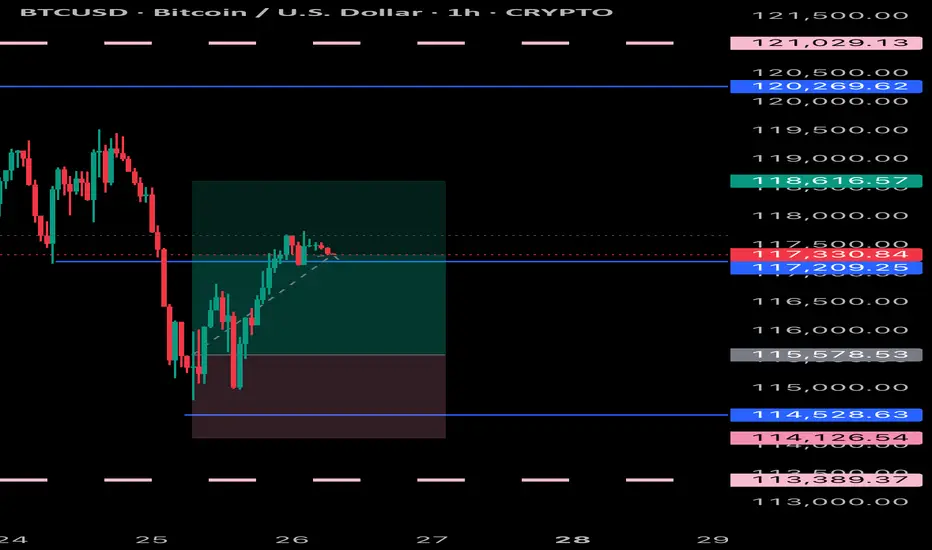
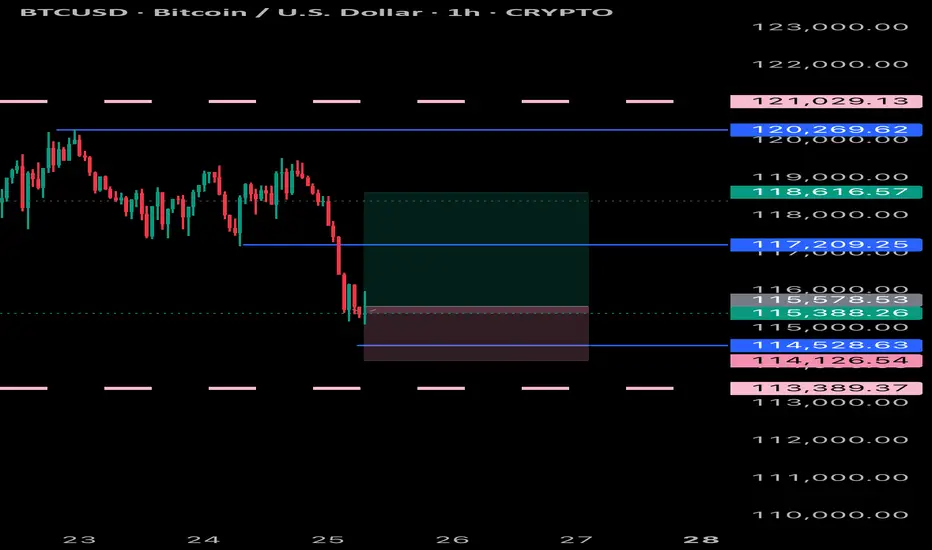
BITCOIN RESULTS Bitcoin has respected the analysis and held very well it’s been following the trend and can partial close some positions and wait for a nice pullback to buy the dip
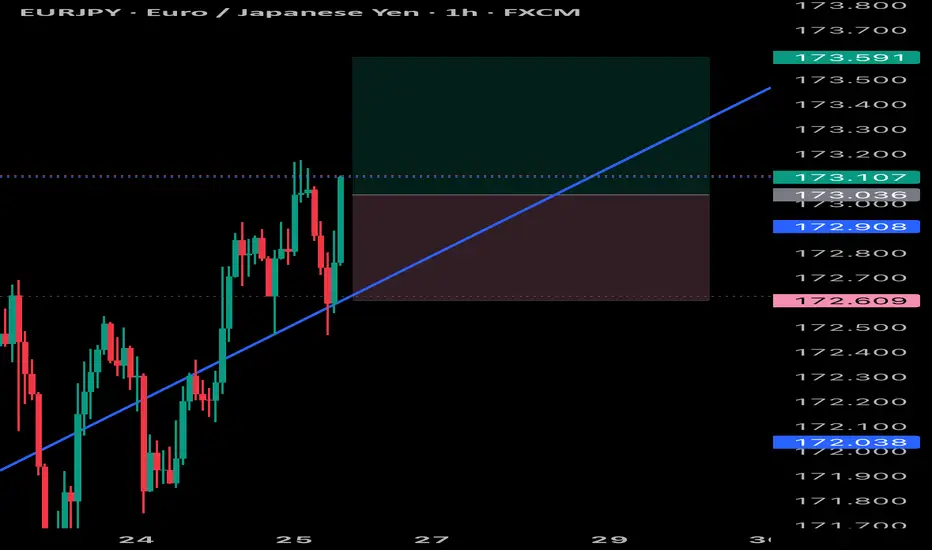
EURJPY LOOKING GOOD Eurjpy has been behaving as expected and can continue to the up side and complete its pattern
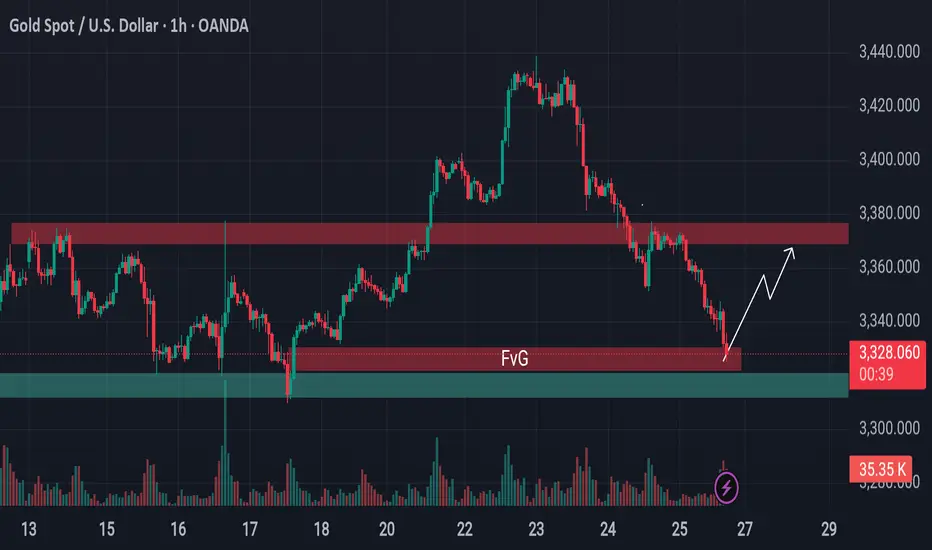
From Breakdown to Breakout? Gold Eyes Support Based Reversal!Gold is approaching a critical support area.
Previously, the price was holding above a key support level, but that zone has now been breached and is likely to act as resistance going forward. However, just beneath the current price, there's a well-established support level still intact—reinforced further by the presence of a bullish Fair Value Gap (FVG).
This setup hints at a possible reversal or a short-term surge from this zone. If market conditions align, gold may stage a pump from here. Keep this level on your radar—it could turn into a decisive point for price direction.
🛡 Always conduct your own analysis before taking any trades. DYOR.
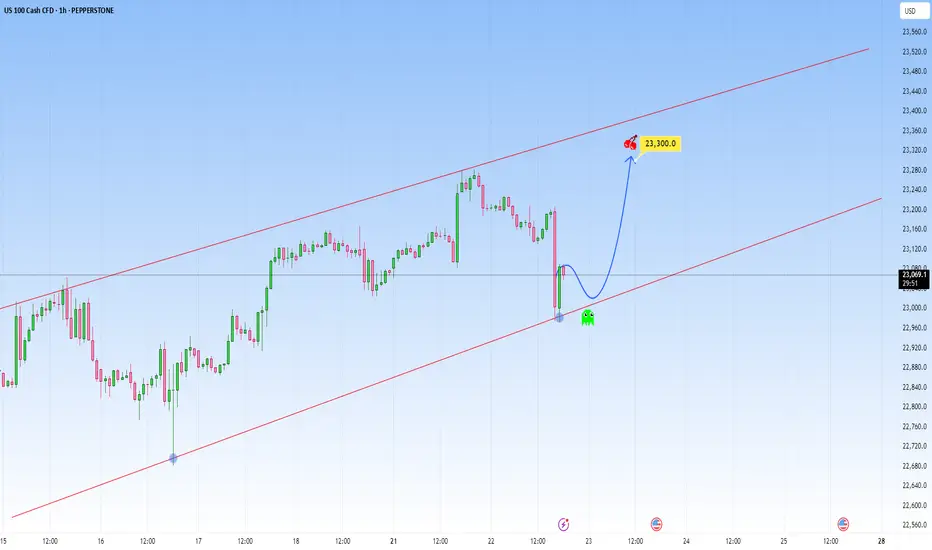
NAS100 steadies at high levels, pay attention nextThe most recent move on NAS100 saw a sharp drop that briefly recovered, likely triggering stops before aggressively reversing from the lower boundary of the newly projected channel. This isn't a cause for concern, on the contrary, it's another opportunity to get involved.
That is because this drop and recovery is a common behavior in strong uptrends before resuming bullish momentum.
The market is likely in the early stages of a new impulsive leg to the upside right here.
We could either have short-term consolidation or pullback, then a continuation toward the upper channel boundary or straight upwards, and with NAS100, the latter is more plausible.
My target will be at 23,300 around the upper boundary of the projected channel resistance.
In this context, the market remains bullish clearly. The most interesting aspect is the emotional flush on the last drop, trapping sellers before fueling what could be another big leg up.
GOLD XAUUSD BUY We shall be looking to scalp a bit on the gold as it has been selling for a while now and can expect a reversal as nothing sells forever in the market, so can buy a dip and expect it to push a fair amount
BTCUSD BUYING can expect a bullish move from bitcoin as it has dropped a fair amount and can extract a reversal to the up side due to being oversold
EURJPY BULLS Bullish move from Eurjpy and will keep following it, to its very top with small pullbacks coming but stay prepared can put buy stops
EURJPY Q3 | D25 | W30 | Y25📊 EURJPY Q3 | D25 | W30 | Y25
Daily Forecast🔍📅
Here’s a short diagnosis of the current chart setup 🧠📈
Higher time frame order blocks have been identified — these are our patient points of interest 🎯🧭.
It’s crucial to wait for a confirmed break of structure 🧱✅ before forming a directional bias.
This keeps us disciplined and aligned with what price action is truly telling us.
📈 Risk Management Protocols
🔑 Core principles:
Max 1% risk per trade
Only execute at pre-identified levels
Use alerts, not emotion
Stick to your RR plan — minimum 1:2
🧠 You’re not paid for how many trades you take, you’re paid for how well you manage risk.
🧠 Weekly FRGNT Insight
"Trade what the market gives, not what your ego wants."
Stay mechanical. Stay focused. Let the probabilities work.
FRGNT
OANDA:EURJPY
GBPUSD Q3 | D25 | W30 | Y25 FUN COUPON FRIDAYGBPUSD Q3 | D25 | W30 | Y25
Daily Forecast🔍📅
Here’s a short diagnosis of the current chart setup 🧠📈
Higher time frame order blocks have been identified — these are our patient points of interest 🎯🧭.
It’s crucial to wait for a confirmed break of structure 🧱✅ before forming a directional bias.
This keeps us disciplined and aligned with what price action is truly telling us.
📈 Risk Management Protocols
🔑 Core principles:
Max 1% risk per trade
Only execute at pre-identified levels
Use alerts, not emotion
Stick to your RR plan — minimum 1:2
🧠 You’re not paid for how many trades you take, you’re paid for how well you manage risk.
🧠 Weekly FRGNT Insight
"Trade what the market gives, not what your ego wants."
Stay mechanical. Stay focused. Let the probabilities work.
FRGNT
FX:GBPUSD
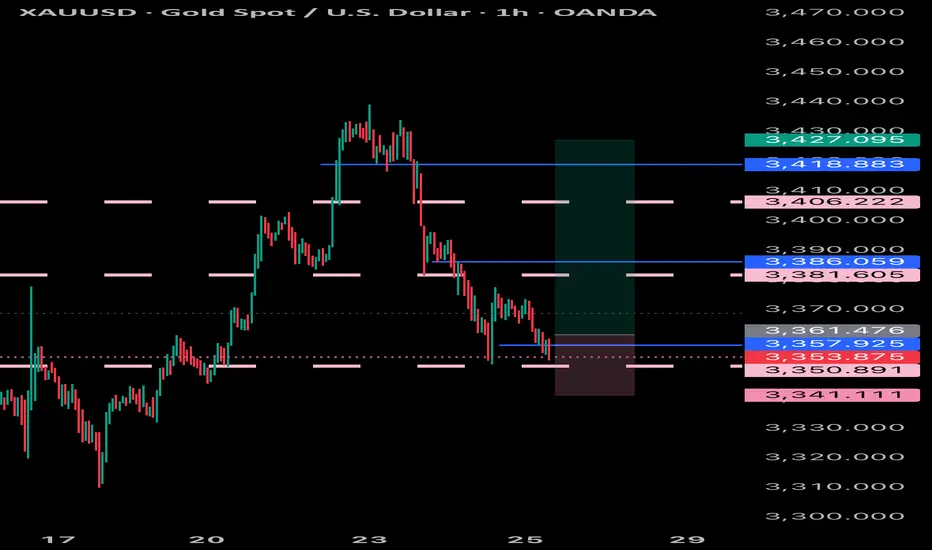
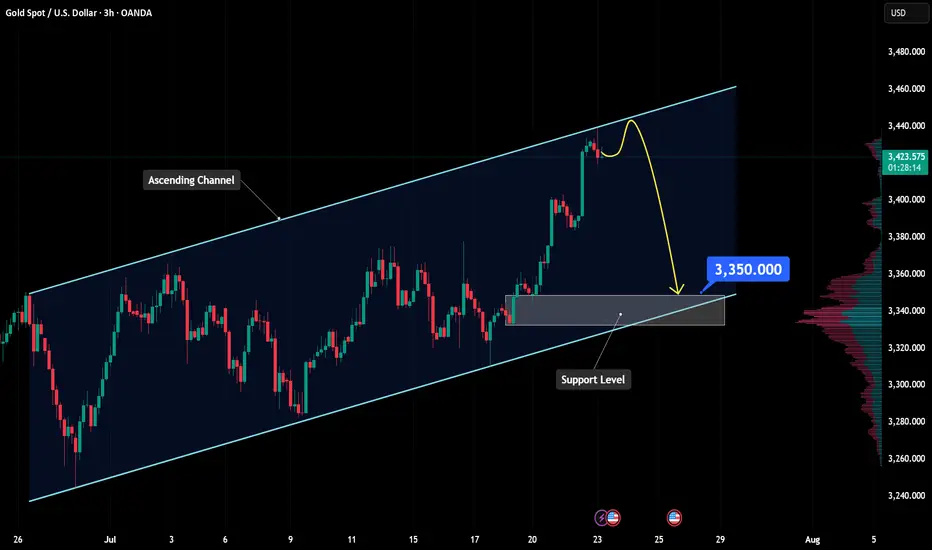
Gold technical outlook – Signs of exhaustion at channel topOANDA:XAUUSD is climbing within a well-defined ascending channel, and price is now brushing up against the upper boundary, a dynamic resistance zone that has historically triggered pullbacks. If price gets rejected here, we may see a healthy correction toward the key support at 3,350, offering a potential reload point for bulls.
Should buyers step in and defend this level, the bullish structure remains intact, setting the stage for a renewed push higher. On the other hand, a clean break below 3,350 could open the door for a deeper retracement toward the lower edge of the channel, where more significant demand may lie.
All eyes should be on price action and volume in this regio, watch for reversal patterns like bullish pin bars or engulfing candles to confirm entries. As always, risk management comes first. Don't trade assumptions, trade confirmations.
What’s your take on this setup? Drop your thoughts below and let’s discuss!
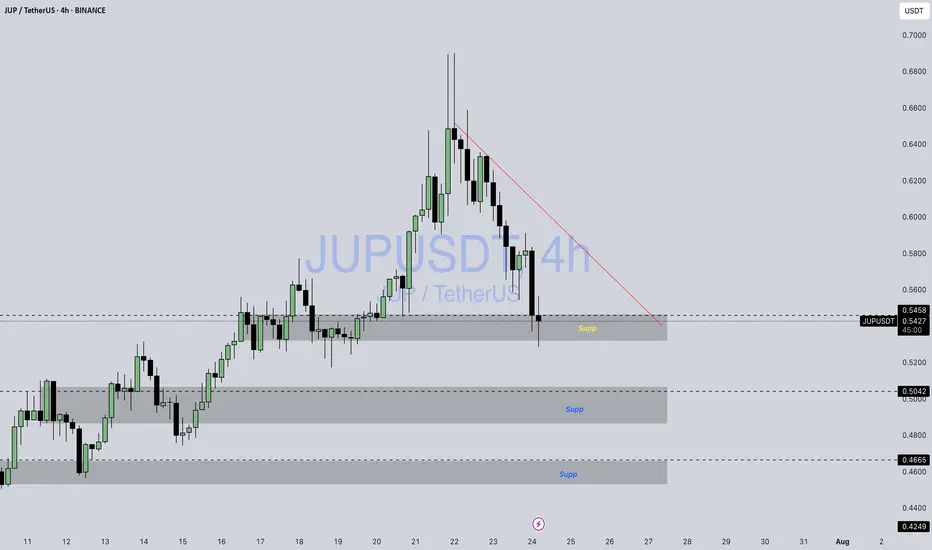
JUP / USDTBINANCE:JUPUSDT
### **📊 Chart Overview – JUPUSDT (4H):**
* **Current Price:** \$0.5415
* **Recent Action:** Price dropped sharply from \$0.668 and is now testing a **key support zone around \$0.54 – \$0.55**.
* **Key Supports:**
* **\$0.545 – \$0.54 (current zone).**
* **\$0.504 – \$0.50 (next support).**
* **\$0.466 (major support).**
* **Resistance Levels:** \$0.60 and \$0.668.
---
### **🔍 Technical Breakdown:**
1. **Trendline Resistance:**
* A descending red trendline is currently capping upside movement.
* Price needs to **break and close above \$0.57 – \$0.60** for bullish momentum.
2. **Bullish Scenario:**
* If \$0.54 holds as strong support, we could see a **bounce towards \$0.60 – \$0.65**.
3. **Bearish Scenario:**
* A breakdown below **\$0.54** might push the price down to **\$0.50** or even **\$0.466**.
---
### **📌 Summary:**
JUP is at a **critical support**. The next 1–2 candles on the 4H chart will decide if it bounces or dips toward the \$0.50 level.
---
⚠️ **Disclaimer:**
*This analysis is for informational and educational purposes only. It is not financial advice. Always do your own research (DYOR) and manage risk appropriately.*
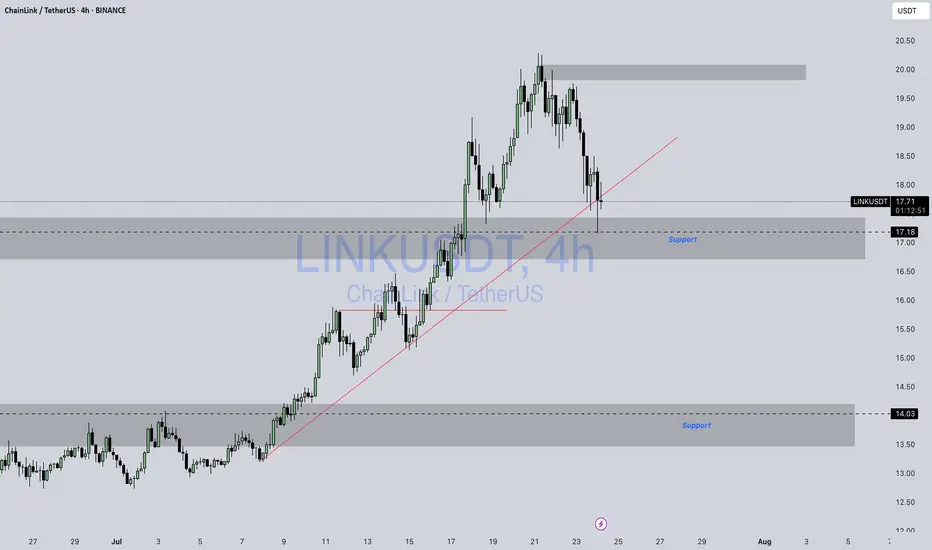
Link / UsdtBINANCE:LINKUSDT
### 📊 **Chart Overview – LINKUSDT (4H):**
* **Current Price:** \$17.65
* **Recent Trend:** Pullback from the \$20.00 resistance zone.
* **Key Support Zones:**
* Immediate: **\$17.00 – \$17.20** (gray demand zone).
* Stronger: **\$14.00 – \$14.20**.
* **Resistance:** \$20.00 psychological level.
---
### 🔍 **Technical Breakdown:**
1. **Trendline Interaction:**
* Price is testing the **ascending red trendline**, which could act as dynamic support.
* A break below could push LINK toward **\$17.18 or even \$14.16** for a deeper correction.
2. **Bullish Scenario:**
* If the \$17.00 zone holds, LINK could bounce and aim for **\$18.50 – \$19.80** in the short term.
3. **Bearish Scenario:**
* A decisive break below \$17.00 may trigger a larger move down to the **\$14.00 support zone**, offering better accumulation levels.
---
### 📌 **Summary:**
LINK is at a **critical decision point** — watch the \$17.00 support zone and the trendline closely for direction confirmation.
---
⚠️ **Disclaimer:**
*This analysis is for informational and educational purposes only. It is not financial advice. Always DYOR and manage your risk before trading.*
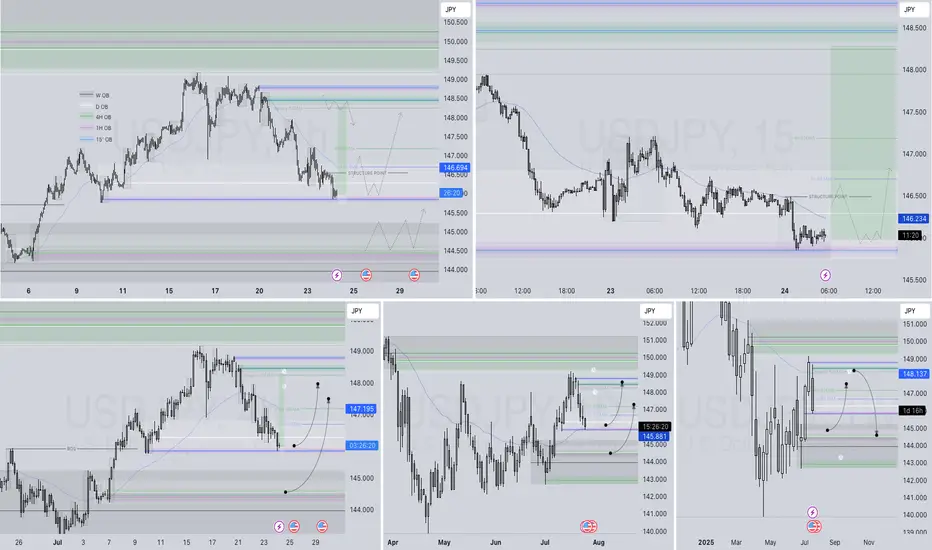
USDJPY Q3 | D24 | W30 | Y25 VIDEO EXPLANATION 📊USDJPY Q3 | D24 | W30 | Y25
Daily Forecast🔍📅
Here’s a short diagnosis of the current chart setup 🧠📈
Higher time frame order blocks have been identified — these are our patient points of interest 🎯🧭.
It’s crucial to wait for a confirmed break of structure 🧱✅ before forming a directional bias.
This keeps us disciplined and aligned with what price action is truly telling us.
📈 Risk Management Protocols
🔑 Core principles:
Max 1% risk per trade
Only execute at pre-identified levels
Use alerts, not emotion
Stick to your RR plan — minimum 1:2
🧠 You’re not paid for how many trades you take, you’re paid for how well you manage risk.
🧠 Weekly FRGNT Insight
"Trade what the market gives, not what your ego wants."
Stay mechanical. Stay focused. Let the probabilities work.
FRGNT

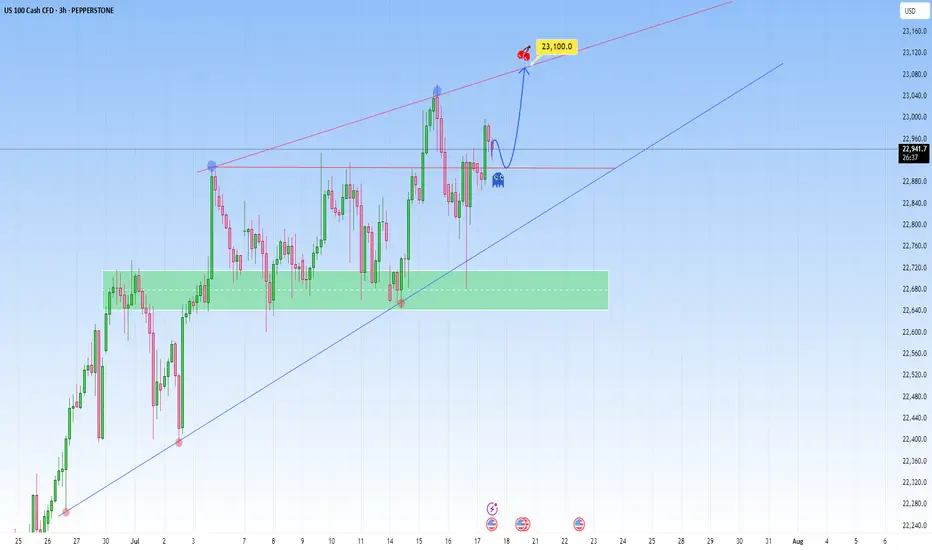
NAS100 Bigger Picture. Uptrend to be resumedLooking at the current structure through the lens of a trend trading approach, what we saw on NAS100 is more than a simple price bounce, it’s a trend continuation trading within a high-volatility environment. As price is approaching a key resistance level, how price is behaving around this dynamic trendline will be key.
This recent retracement and rejection happening near what we can call a demand zone cluster, was confirmed by a beautiful bounce off the support range. And right now price is respecting the upper and lower bounds nicely.
What happens next? Price is showing signs of bullish exhaustion, but the higher-timeframe structure supports a continuation.
My projected target is towards the upper resistance line, that’s my 23,100 zone as shown.
USDJPY Q3 | D24 | W30 | Y25📊USDJPY Q3 | D24 | W30 | Y25
Daily Forecast🔍📅
Here’s a short diagnosis of the current chart setup 🧠📈
Higher time frame order blocks have been identified — these are our patient points of interest 🎯🧭.
It’s crucial to wait for a confirmed break of structure 🧱✅ before forming a directional bias.
This keeps us disciplined and aligned with what price action is truly telling us.
📈 Risk Management Protocols
🔑 Core principles:
Max 1% risk per trade
Only execute at pre-identified levels
Use alerts, not emotion
Stick to your RR plan — minimum 1:2
🧠 You’re not paid for how many trades you take, you’re paid for how well you manage risk.
🧠 Weekly FRGNT Insight
"Trade what the market gives, not what your ego wants."
Stay mechanical. Stay focused. Let the probabilities work.
FRGNT
FX:USDJPY
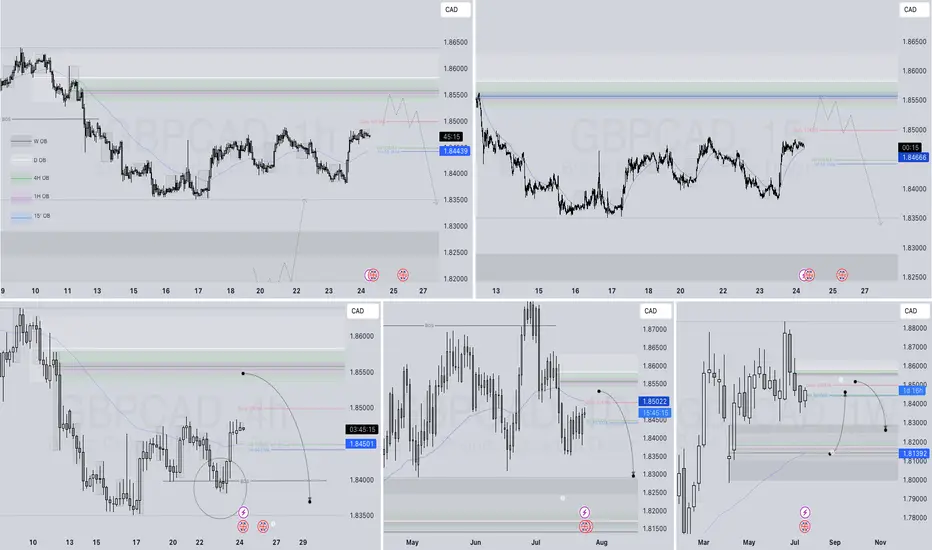
GBPCAD Q3 | D24 | W30 | Y25📊GBPCAD Q3 | D24 | W30 | Y25
Daily Forecast🔍📅
Here’s a short diagnosis of the current chart setup 🧠📈
Higher time frame order blocks have been identified — these are our patient points of interest 🎯🧭.
It’s crucial to wait for a confirmed break of structure 🧱✅ before forming a directional bias.
This keeps us disciplined and aligned with what price action is truly telling us.
📈 Risk Management Protocols
🔑 Core principles:
Max 1% risk per trade
Only execute at pre-identified levels
Use alerts, not emotion
Stick to your RR plan — minimum 1:2
🧠 You’re not paid for how many trades you take, you’re paid for how well you manage risk.
🧠 Weekly FRGNT Insight
"Trade what the market gives, not what your ego wants."
Stay mechanical. Stay focused. Let the probabilities work.
FRGNT
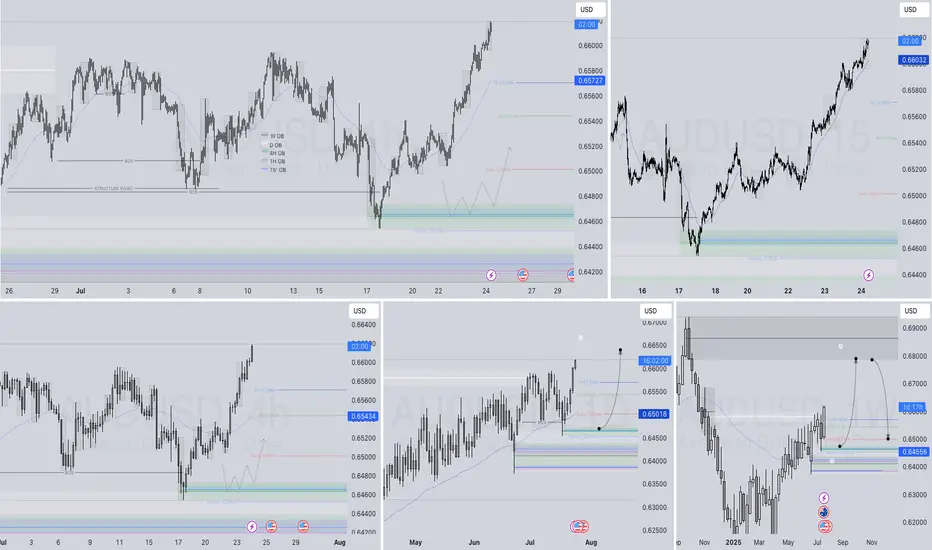
AUDUSD Q3 | D24 | W30 | Y25📊AUDUSD Q3 | D24 | W30 | Y25
Daily Forecast🔍📅
Here’s a short diagnosis of the current chart setup 🧠📈
Higher time frame order blocks have been identified — these are our patient points of interest 🎯🧭.
It’s crucial to wait for a confirmed break of structure 🧱✅ before forming a directional bias.
This keeps us disciplined and aligned with what price action is truly telling us.
📈 Risk Management Protocols
🔑 Core principles:
Max 1% risk per trade
Only execute at pre-identified levels
Use alerts, not emotion
Stick to your RR plan — minimum 1:2
🧠 You’re not paid for how many trades you take, you’re paid for how well you manage risk.
🧠 Weekly FRGNT Insight
"Trade what the market gives, not what your ego wants."
Stay mechanical. Stay focused. Let the probabilities work.
FRGNT