GBPUSD Q3 | D24 | W30 | Y25📊GBPUSD Q3 | D24 | W30 | Y25
Daily Forecast🔍📅
Here’s a short diagnosis of the current chart setup 🧠📈
Higher time frame order blocks have been identified — these are our patient points of interest 🎯🧭.
It’s crucial to wait for a confirmed break of structure 🧱✅ before forming a directional bias.
This keeps us disciplined and aligned with what price action is truly telling us.
📈 Risk Management Protocols
🔑 Core principles:
Max 1% risk per trade
Only execute at pre-identified levels
Use alerts, not emotion
Stick to your RR plan — minimum 1:2
🧠 You’re not paid for how many trades you take, you’re paid for how well you manage risk.
🧠 Weekly FRGNT Insight
"Trade what the market gives, not what your ego wants."
Stay mechanical. Stay focused. Let the probabilities work.
FRGNT
Freesignals
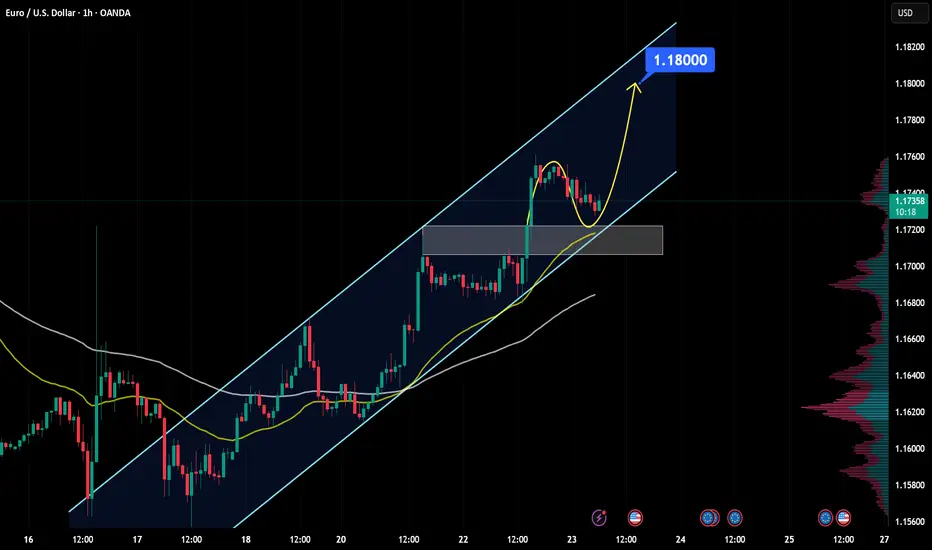
EURUSD Analysis - Can Buyers Push Price To $1.18000?Hello all dear traders!
EURUSD is trading within a clear bullish channel, with price action consistently respecting both the upper and lower boundaries. The recent bullish momentum shows that buyers are in control, suggesting further upside.
The price recently broke above a key resistance zone and is now coming back to retest it. If this level holds as support, it will consolidate the bullish structure and increase the likelihood of a move towards the 1.18000 target, which is in line with the upper boundary of the channel.
As long as the price remains above this support zone, the bullish outlook remains intact. However, a failure to hold this level could invalidate the bullish scenario and increase the likelihood of a deeper pullback.
Remember, always validate your setups and use appropriate risk management.
AUDUSD Q3 | D23 | W30 | Y25📊AUDUSD Q3 | D23 | W30 | Y25
Daily Forecast🔍📅
Here’s a short diagnosis of the current chart setup 🧠📈
Higher time frame order blocks have been identified — these are our patient points of interest 🎯🧭.
It’s crucial to wait for a confirmed break of structure 🧱✅ before forming a directional bias.
This keeps us disciplined and aligned with what price action is truly telling us.
📈 Risk Management Protocols
🔑 Core principles:
Max 1% risk per trade
Only execute at pre-identified levels
Use alerts, not emotion
Stick to your RR plan — minimum 1:2
🧠 You’re not paid for how many trades you take, you’re paid for how well you manage risk.
🧠 Weekly FRGNT Insight
"Trade what the market gives, not what your ego wants."
Stay mechanical. Stay focused. Let the probabilities work.
FRGNT
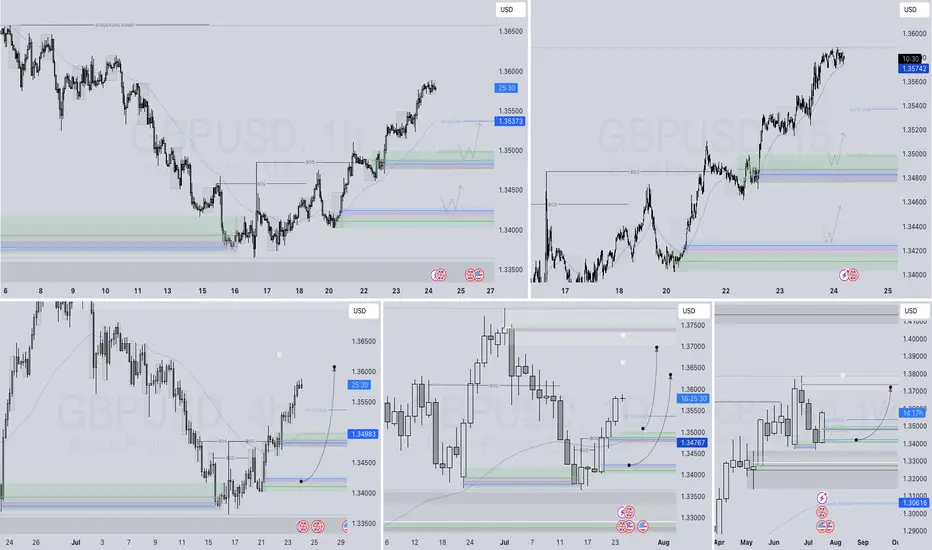
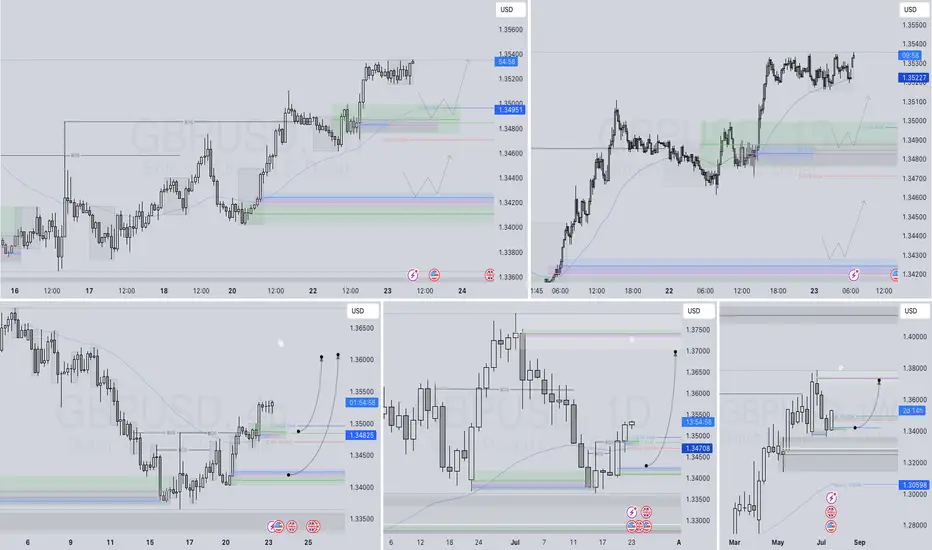
GBPUSD Q3 | D23 | W30 | Y25📊GBPUSD Q3 | D23 | W30 | Y25
Daily Forecast🔍📅
Here’s a short diagnosis of the current chart setup 🧠📈
Higher time frame order blocks have been identified — these are our patient points of interest 🎯🧭.
It’s crucial to wait for a confirmed break of structure 🧱✅ before forming a directional bias.
This keeps us disciplined and aligned with what price action is truly telling us.
📈 Risk Management Protocols
🔑 Core principles:
Max 1% risk per trade
Only execute at pre-identified levels
Use alerts, not emotion
Stick to your RR plan — minimum 1:2
🧠 You’re not paid for how many trades you take, you’re paid for how well you manage risk.
🧠 Weekly FRGNT Insight
"Trade what the market gives, not what your ego wants."
Stay mechanical. Stay focused. Let the probabilities work.
FRGNT
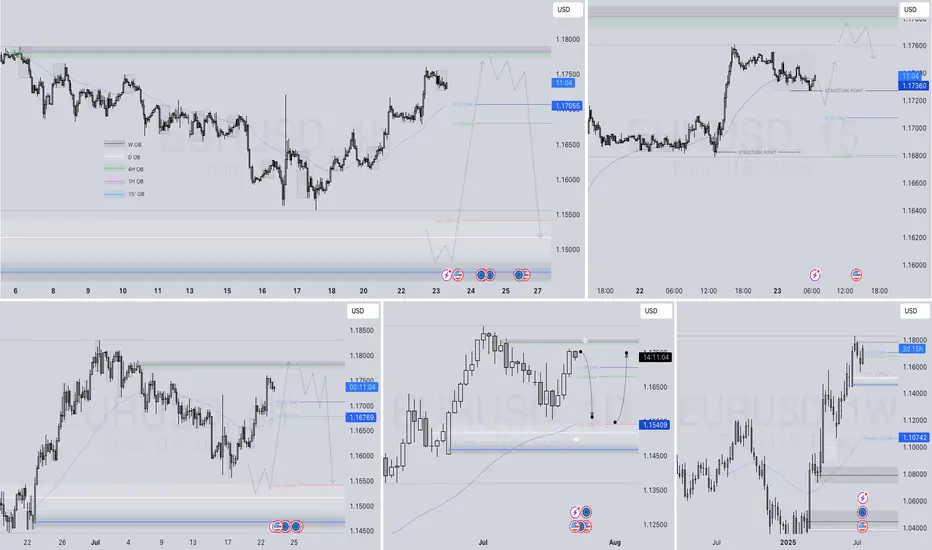
EURUSD Q3 | D23 | W30 | Y25📊EURUSD Q3 | D23 | W30 | Y25
Daily Forecast🔍📅
Here’s a short diagnosis of the current chart setup 🧠📈
Higher time frame order blocks have been identified — these are our patient points of interest 🎯🧭.
It’s crucial to wait for a confirmed break of structure 🧱✅ before forming a directional bias.
This keeps us disciplined and aligned with what price action is truly telling us.
📈 Risk Management Protocols
🔑 Core principles:
Max 1% risk per trade
Only execute at pre-identified levels
Use alerts, not emotion
Stick to your RR plan — minimum 1:2
🧠 You’re not paid for how many trades you take, you’re paid for how well you manage risk.
🧠 Weekly FRGNT Insight
"Trade what the market gives, not what your ego wants."
Stay mechanical. Stay focused. Let the probabilities work.
FRGNT
RF 1D: Breakout or Just a Bullish Pause?Regions Financial (ticker: RF) finally escaped the descending channel it had been stuck in for nearly 8 months — like someone who missed their stop and woke up in a different state. The breakout came with volume and a hold above the 50-day MA, which technically gives the bulls a reason to stretch their legs — cautiously.
The price has already cleared the 0.618 Fibonacci level (~21.66), and is now pushing toward the 0.5 zone (~22.87). If momentum holds, the next key area is target 1 around 24.00–24.50. Beyond that — and this is where things get ambitious — we have target 2 in the 27.50–28.50 range, which aligns with pre-breakdown resistance from late 2024.
RSI is climbing into overbought territory but still confirms the breakout rather than warning of a top — at least for now.
On the macro side: U.S. regional banks have had a rough ride in early 2025, but RF has held up better than many peers. The recent earnings beat and visible uptick in volume suggest growing institutional interest. If bond yields keep cooling and risk appetite returns to the value sector, RF could remain in favor.
That said, bulls need to see a confirmed hold above 22.80. Otherwise, this could end up as another failed retest — and bears are always lurking just outside the channel.

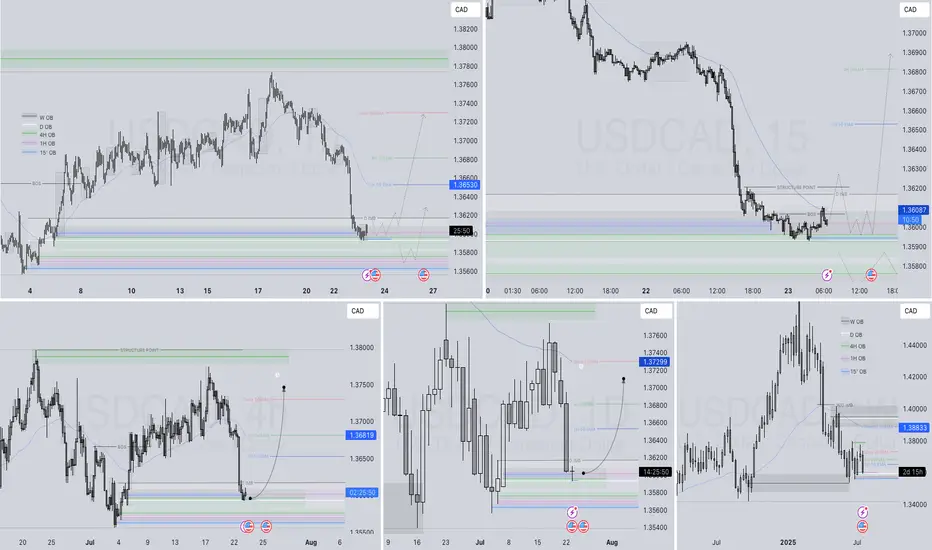
USCAD Q3 | D23 | W30 | Y25📊USCAD Q3 | D23 | W30 | Y25
Daily Forecast🔍📅
Here’s a short diagnosis of the current chart setup 🧠📈
Higher time frame order blocks have been identified — these are our patient points of interest 🎯🧭.
It’s crucial to wait for a confirmed break of structure 🧱✅ before forming a directional bias.
This keeps us disciplined and aligned with what price action is truly telling us.
📈 Risk Management Protocols
🔑 Core principles:
Max 1% risk per trade
Only execute at pre-identified levels
Use alerts, not emotion
Stick to your RR plan — minimum 1:2
🧠 You’re not paid for how many trades you take, you’re paid for how well you manage risk.
🧠 Weekly FRGNT Insight
"Trade what the market gives, not what your ego wants."
Stay mechanical. Stay focused. Let the probabilities work.
FRGNT
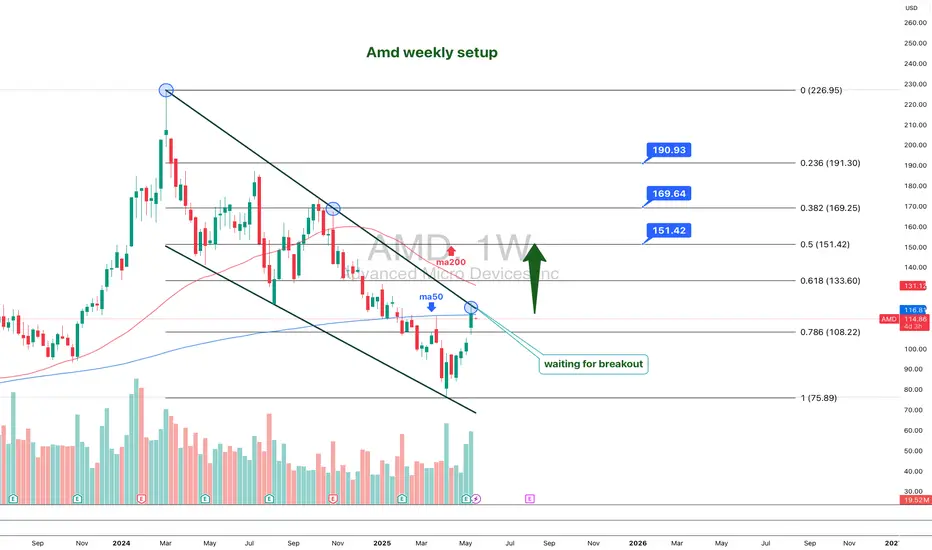
AMD 1W: If Not Now — Then When?The weekly chart of AMD looks like it’s holding its breath: a well-defined falling wedge, double bottom support, and price pressing right against long-term trendline resistance. Everything’s in place — now it just needs to break and run, preferably without tripping over nearby Fibonacci levels.
The stock is trading around $114 and attempting to hold above the 50-week MA. Just ahead is the 200-week MA (~131) — not only a technical hurdle but also a psychological pivot. A move above it could reignite talk of $150+ targets.
The wedge has been narrowing since late 2024. After repeated bounces off support, price has returned to the top of the pattern. A confirmed weekly close above the wedge could trigger a real breakout. Without that — it risks yet another scripted pullback.
Key Fibonacci levels:
0.618 — $133.60
0.5 — $151.42
0.382 — $169.25
0.236 — $191.30
0.0 — $226.95 (all-time high)
The roadmap looks clean — but only if volume follows through. There are signs of quiet accumulation at the bottom, but no explosive buying just yet.
Fundamentals:
AMD delivered solid Q1 results: revenue is growing, EPS beat expectations, and margins are holding. More importantly, the company launched a new $6 billion stock buyback program — showing clear internal confidence in its long-term trajectory.
There’s also a strategic AI partnership underway with a Middle Eastern tech group. This move positions AMD to challenge not just for GPU market share, but for future AI infrastructure dominance — long game stuff.
Analyst sentiment has turned bullish again, with new price targets in the $130–150 range. All of this makes the current chart structure more than just technical noise — it’s backed by strong tailwinds.
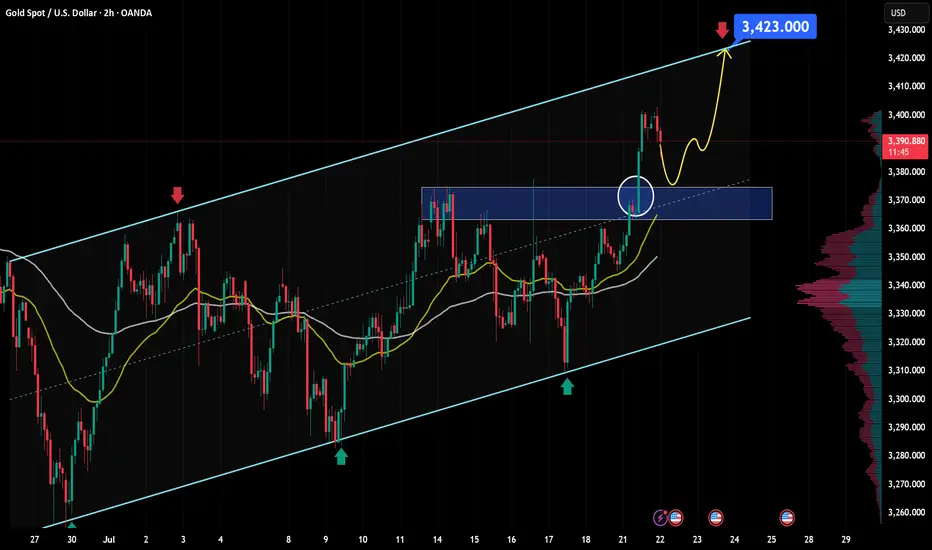
XAU/USD outlook: Bullish momentum building after breakoutGold saw a powerful rally yesterday, surging from $3,350 to nearly $3,400 — an impressive $50 move, equivalent to 500 pips.
From a macroeconomic perspective, this recent uptrend in gold is driven by a combination of supportive factors. First, the U.S. dollar has shown clear signs of weakness following dovish signals from several Federal Reserve officials, who hinted at potential rate cuts if the U.S. economy begins to slow. In addition, geopolitical risks such as renewed U.S.–China trade tensions, instability in the Middle East, and slowing growth in China are all pushing investors toward safe-haven assets like gold. Another key driver is the ongoing accumulation of gold by central banks worldwide — particularly China and Turkey — highlighting gold’s growing appeal as a strategic reserve asset. Together, these factors have built a strong foundation for gold’s upward momentum, explaining why prices remain above yesterday’s opening level, despite the current short-term pullback.
From a technical and short-term outlook, gold (XAU/USD) continues to show a bullish setup supported by both price structure and market sentiment. On the H2 timeframe, gold remains in a clear uptrend, with a series of higher highs and higher lows. After breaking through a strong resistance zone around $3,374 (aligned with the 0.5 Fibonacci level), price surged to a peak of $3,403 before entering a healthy retracement phase.
Currently, the $3,367–$3,374 zone is acting as newly-formed support — a key confluence area that aligns with:
A former resistance now flipped into support,
The 0.5–0.618 Fibonacci retracement cluster,
And a bullishly aligned short-term EMA structure.
In the short term, as long as this support zone holds, the bullish outlook remains valid. A successful retest of this area could reignite buying pressure, with the next target set around $3,423 — in line with the projected extension of the previous bullish leg.
However, if buyers fail to defend this zone, the bullish setup could be invalidated or lose momentum. This area warrants close monitoring of price action and volume behavior to confirm the next directional move.
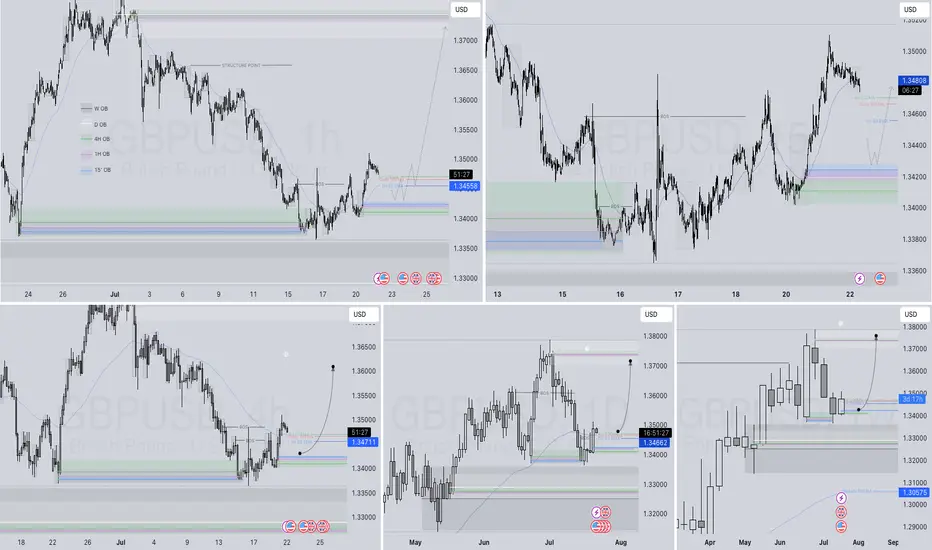
GBPUSD Q3 | D22 | W30 | Y25📊GBPUSD Q3 | D22 | W30 | Y25
Daily Forecast Long 🔍📅
Here’s a short diagnosis of the current chart setup 🧠📈
Higher time frame order blocks have been identified — these are our patient points of interest 🎯🧭.
It’s crucial to wait for a confirmed break of structure 🧱✅ before forming a directional bias.
This keeps us disciplined and aligned with what price action is truly telling us.
📈 Risk Management Protocols
🔑 Core principles:
Max 1% risk per trade
Only execute at pre-identified levels
Use alerts, not emotion
Stick to your RR plan — minimum 1:2
🧠 You’re not paid for how many trades you take, you’re paid for how well you manage risk.
🧠 Weekly FRGNT Insight
"Trade what the market gives, not what your ego wants."
Stay mechanical. Stay focused. Let the probabilities work.
FRGNT
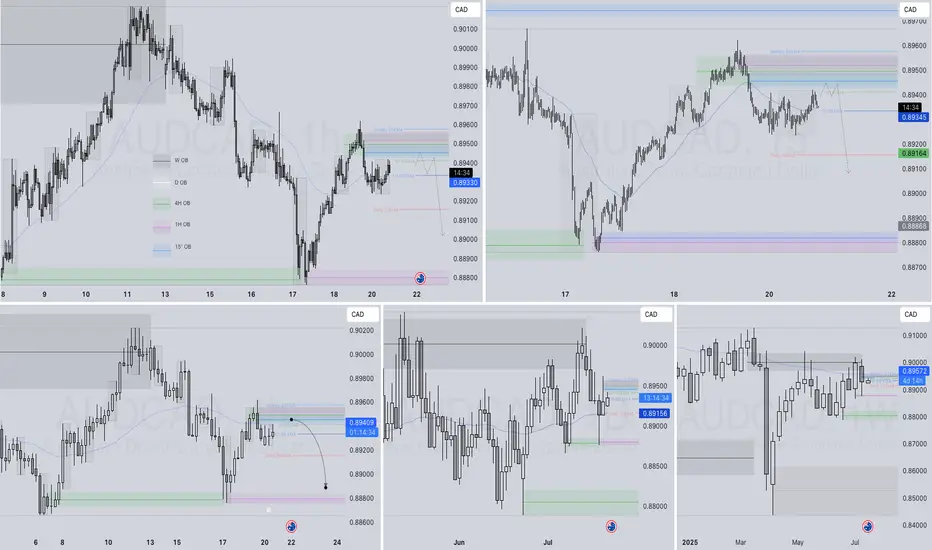
AUDCAD Q3 | D21 | W30 | Y25 📊AUDCAD Q3 | D21 | W30 | Y25
Daily Forecast 🔍📅
Here’s a short diagnosis of the current chart setup 🧠📈
Higher time frame order blocks have been identified — these are our patient points of interest 🎯🧭.
It’s crucial to wait for a confirmed break of structure 🧱✅ before forming a directional bias.
This keeps us disciplined and aligned with what price action is truly telling us.
📈 Risk Management Protocols
🔑 Core principles:
Max 1% risk per trade
Only execute at pre-identified levels
Use alerts, not emotion
Stick to your RR plan — minimum 1:2
🧠 You’re not paid for how many trades you take, you’re paid for how well you manage risk.
🧠 Weekly FRGNT Insight
"Trade what the market gives, not what your ego wants."
Stay mechanical. Stay focused. Let the probabilities work.
FRGNT 📊
EUR/USD at Resistance – Will Sellers Push Price Down to 1.15000?Hello fellow traders! What’s your take on EUR/USD?
From Brian’s personal perspective:
This currency pair is approaching a key resistance zone, which previously acted as a strong support level. This area aligns with historical price reactions and could serve as a solid foundation for potential bearish movements.
If sellers confirm their presence through bearish price action, I anticipate the price could move toward 1.15000. However, a clear break above this resistance level may signal the possibility of further bullish continuation.
Let me know your thoughts or any additional insights you might have!

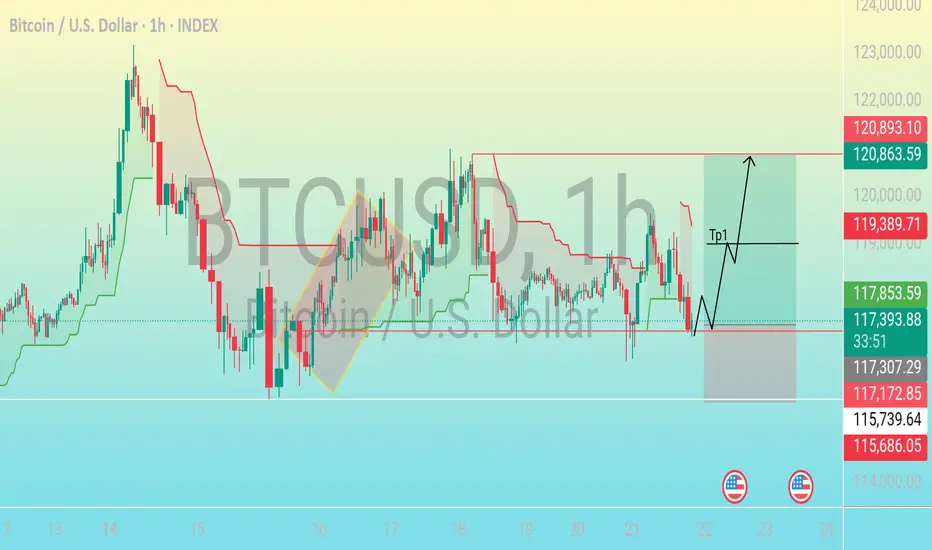
Precision Entry Zone📊 Chart Breakdown: BTC/USD (1H Timeframe)
As of July 21, 2025
---
1. Support Zone Identified (117,172 – 117,307)
The blue shaded box near the bottom of the range marks a strong demand/support zone.
Price action has tested this area multiple times and bounced, indicating buyers are stepping in.
The recent wick rejections in this zone suggest it's a key level to watch for potential reversals.
---
2. Entry Area (Near 117,359)
Current price sits around 117,359, just above the support.
The horizontal trend line indicates a possible early long entry as price respects this level.
It's a low-risk entry point because the stop loss can be placed just below the support box.
---
3. Bullish Structure Anticipated
The drawn path shows an expected bullish breakout, with price climbing after retesting the support.
This implies a "break–retest–continue" pattern — price pushes up, retests support or broken resistance, then continues higher.
---
4. First Take Profit (TP1 at ~119,389)
The first target zone is marked as TP1.
This coincides with a previous resistance level, making it a logical area for partial profits or full exit if trading conservatively.
It's also the mid-point of the projected range, providing a 1:1 to 1:2 risk-to-reward ratio, depending on entry.
---
5. Final Target Area (120,863 – 120,893)
The green zone above TP1 is the major resistance zone, where price may slow or reverse.
This area also aligns with the upper boundary of the previous sideways consolidation.
If bullish momentum is strong and TP1 is broken with volume, this zone becomes the final destination for the move.
---
6. Stop-Loss Placement
A smart SL (stop-loss) would be set just below the support zone, around 115,739 – 115,686.
This keeps downside limited and avoids being stopped out by noise, while preserving a solid R:R (risk-to-reward) structure.
---
7. Indicators Used (Likely Ichimoku or Trend Bands)
The red and green lines on the chart resemble Kijun-Sen / Tenkan-Sen or dynamic S/R levels like trend-following bands.
These are providing visual dynamic resistance and support, further confirming the horizontal zones.
BITSTAMP:BTCUSD
Bullish Breakout Toward 3,436 TargetThis chart shows a technical analysis setup for XAUUSD (Gold Spot vs US Dollar) on the 1-hour timeframe using harmonic and pattern trading strategies. Here's a discretionary breakdown:
---
🔍 Pattern Identified:
A Bullish Gartley Pattern or potentially ABC-D Harmonic Pattern is forming:
Points X-A-B-C-D are labeled, with D just completed.
D point completion indicates a buy (long) opportunity, as the price reversed upward from point C to D.
---
📊 Current Market Action:
Price is currently at 3,386.770 (green candle).
A breakout from the potential neckline or resistance zone around the D point is observed.
There's a small bullish consolidation marked as “TR” (likely Trading Range or Temporary Resistance).
---
🎯 Target Projection:
The price target is labeled at 3,436.495, which is:
Based on the harmonic projection or previous swing high.
~+50 points above the current level (around +1.5%).
---
🧩 Support & Resistance Levels:
Immediate support: 3,360.125 (gray zone)
Next major support: 3,344.380 (lower red line)
Resistance/Target: 3,436.495 (red line/target zone)
---
📈 Discretionary Insight:
Bullish Bias: The pattern suggests a bullish reversal or continuation.
Breakout confirmation: If price holds above the D point and TR zone, it could accelerate to the target.
Risk consideration: Watch for potential pullbacks into the support zone near 3,360. A break below that could invalidate the setup.
---
✅ Potential Trading Plan (Discretionary):
Entry: Already triggered above the D point (confirmation breakout).
Stop Loss: Below C or below the gray support zone (around 3,344).
Target: 3,436.495
Risk-Reward Ratio: Appears favorable if stop is tight and target is reached.

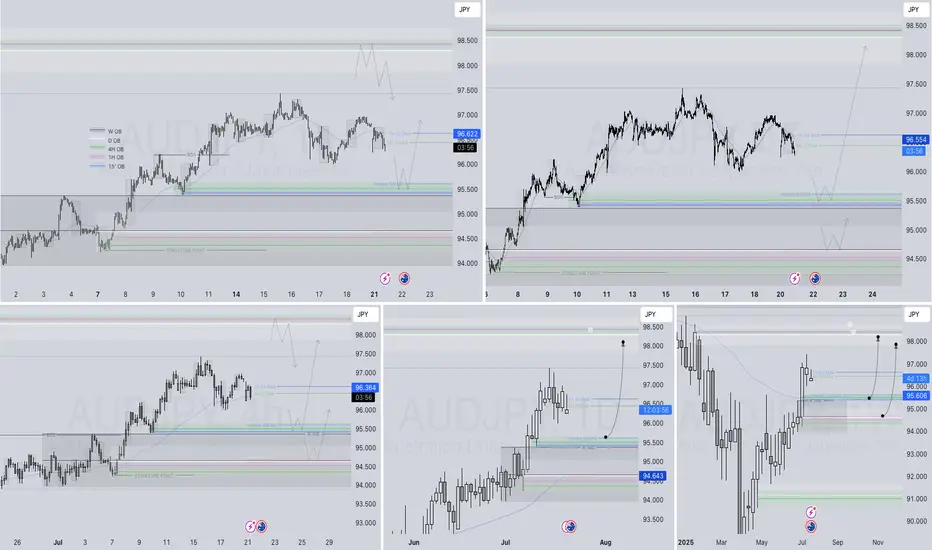
AUDJPY Q3 | D21 | W30 | Y25📊AUDJPY Q3 | D21 | W30 | Y25
Daily Forecast 🔍📅
Here’s a short diagnosis of the current chart setup 🧠📈
Higher time frame order blocks have been identified — these are our patient points of interest 🎯🧭.
It’s crucial to wait for a confirmed break of structure 🧱✅ before forming a directional bias.
This keeps us disciplined and aligned with what price action is truly telling us.
📈 Risk Management Protocols
🔑 Core principles:
Max 1% risk per trade
Only execute at pre-identified levels
Use alerts, not emotion
Stick to your RR plan — minimum 1:2
🧠 You’re not paid for how many trades you take, you’re paid for how well you manage risk.
🧠 Weekly FRGNT Insight
"Trade what the market gives, not what your ego wants."
Stay mechanical. Stay focused. Let the probabilities work.
FRGNT 📊
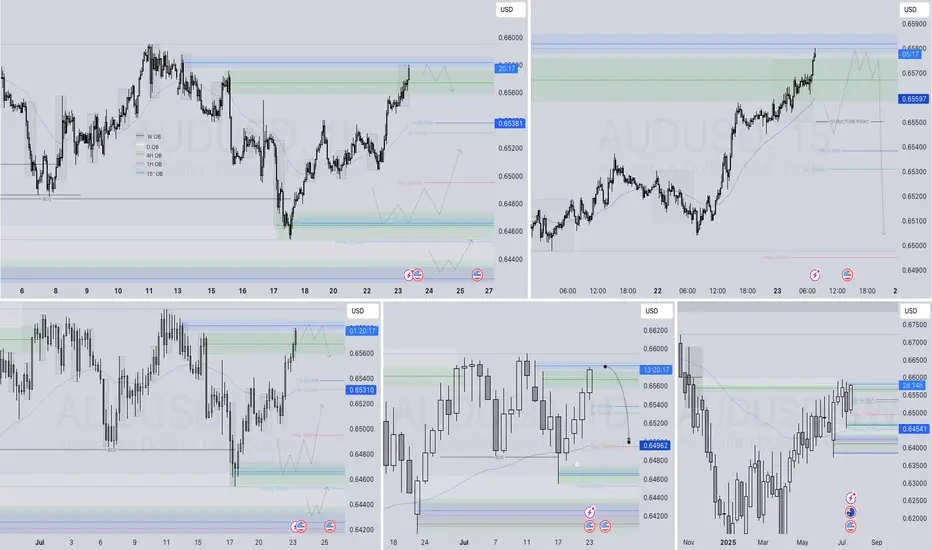
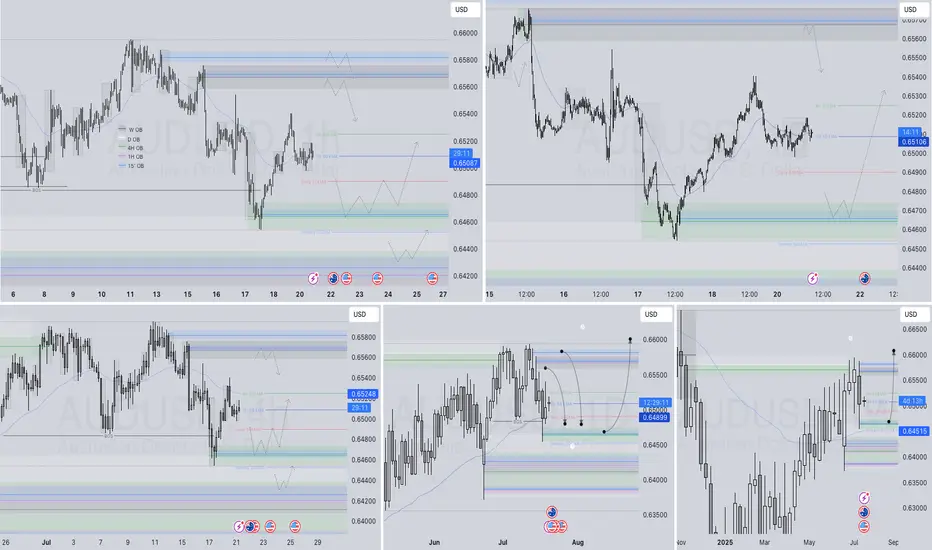
AUDUSD Q3 | D21 | W30 | Y25📊AUDUSD Q3 | D21 | W30 | Y25
Daily Forecast 🔍📅
Here’s a short diagnosis of the current chart setup 🧠📈
Higher time frame order blocks have been identified — these are our patient points of interest 🎯🧭.
It’s crucial to wait for a confirmed break of structure 🧱✅ before forming a directional bias.
This keeps us disciplined and aligned with what price action is truly telling us.
📈 Risk Management Protocols
🔑 Core principles:
Max 1% risk per trade
Only execute at pre-identified levels
Use alerts, not emotion
Stick to your RR plan — minimum 1:2
🧠 You’re not paid for how many trades you take, you’re paid for how well you manage risk.
🧠 Weekly FRGNT Insight
"Trade what the market gives, not what your ego wants."
Stay mechanical. Stay focused. Let the probabilities work.
FRGNT 📊
USDJPY Q3 | D21 | W30 | Y25 15' OB UPDATE 📊USDJPY Q3 | D21 | W30 | Y25 15' OB UPDATE
Daily Forecast 🔍📅
Here’s a short diagnosis of the current chart setup 🧠📈
Higher time frame order blocks have been identified — these are our patient points of interest 🎯🧭.
It’s crucial to wait for a confirmed break of structure 🧱✅ before forming a directional bias.
This keeps us disciplined and aligned with what price action is truly telling us.
📈 Risk Management Protocols
🔑 Core principles:
Max 1% risk per trade
Only execute at pre-identified levels
Use alerts, not emotion
Stick to your RR plan — minimum 1:2
🧠 You’re not paid for how many trades you take, you’re paid for how well you manage risk.
🧠 Weekly FRGNT Insight
"Trade what the market gives, not what your ego wants."
Stay mechanical. Stay focused. Let the probabilities work.
FRGNT 📊

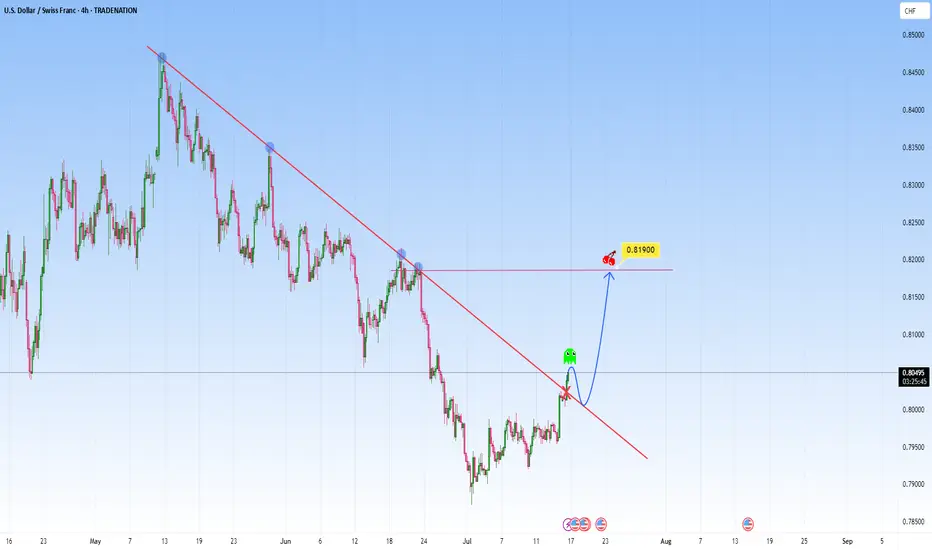
USDCHF: Could be telling a story of break-retest-reversalThe price action on the USDCHF presents an opportunity of structural transition. The descending trendline has acted as dynamic resistance, has contained each rally attempt beautifully. This trendline is marked by multiple rejections, reflected bearish dominance, a controlled downtrend in motion.
The recent movement though could signal a shift. The market has started to break above this descending structure, and it could early suggest that bearish momentum is weakening.
I will be waiting for the price to return to the broken trendline, treating former resistance as newfound support. It’s a confirmation pattern in order to filter false moves, a structure retest that reinforces breakout reliability.
From this base, I am expecting it to target the 0.81900 level, as shown. This area coinciding with horizontal resistance that aligns with previous reactions. Such levels as natural “gravitational pivots”.
An ideal approach here would involve observing the character of the pullback. If the market returns to the trendline with declining bearish volume and forms higher lows on lower timeframes, it strengthens the bullish case.
The trendline break on the chart is not just a signal, it’s a storyline unfolding. It marks a shift with a story. And if volume, price structure, and timing align as they appear poised to, this move could be the first move in a broader upside correction or trend reversal.
Just sharing my thoughts for the charts, this isn’t financial advice. Always confirm your setups and manage your risk properly.
Disclosure: I am part of Trade Nation's Influencer program and receive a monthly fee for using their TradingView charts in my analysis.
TRB : FREE SIGNALHello friends🙌
📈Given the price reaching its bottom and the buyers supporting it, you can see that a classic head and shoulders pattern has formed and buyers have entered. For this reason, you can buy with capital and risk management and move with it to the specified targets.
🔥Follow us for more signals🔥
*Trade safely with us*

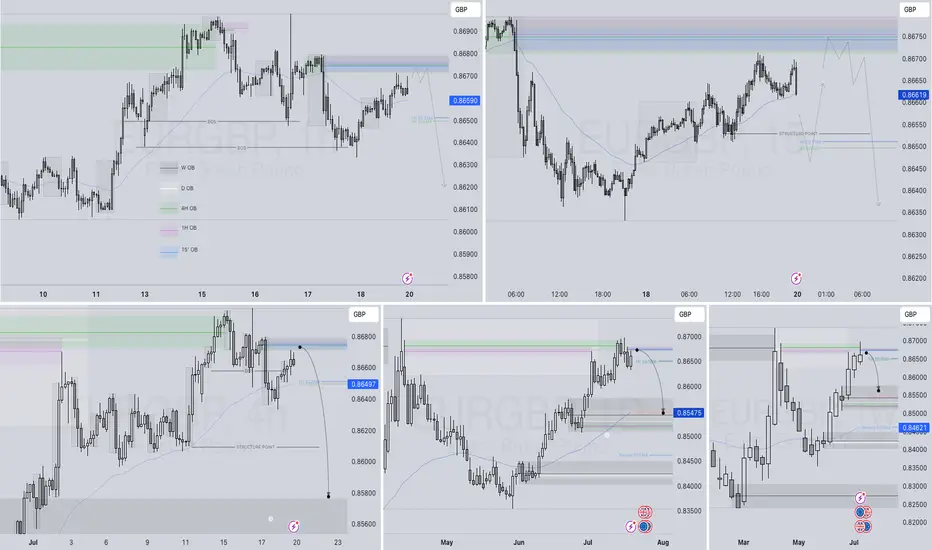
EURGBP – WEEKLY FORECAST Q3 | W30 | Y25📊 EURGBP – WEEKLY FORECAST
Q3 | W30 | Y25
Weekly Forecast 🔍📅
Here’s a short diagnosis of the current chart setup 🧠📈
Higher time frame order blocks have been identified — these are our patient points of interest 🎯🧭.
It’s crucial to wait for a confirmed break of structure 🧱✅ before forming a directional bias.
This keeps us disciplined and aligned with what price action is truly telling us.
📈 Risk Management Protocols
🔑 Core principles:
Max 1% risk per trade
Only execute at pre-identified levels
Use alerts, not emotion
Stick to your RR plan — minimum 1:2
🧠 You’re not paid for how many trades you take, you’re paid for how well you manage risk.
🧠 Weekly FRGNT Insight
"Trade what the market gives, not what your ego wants."
Stay mechanical. Stay focused. Let the probabilities work.
FRGNT FOREX ANALYSIS 📊
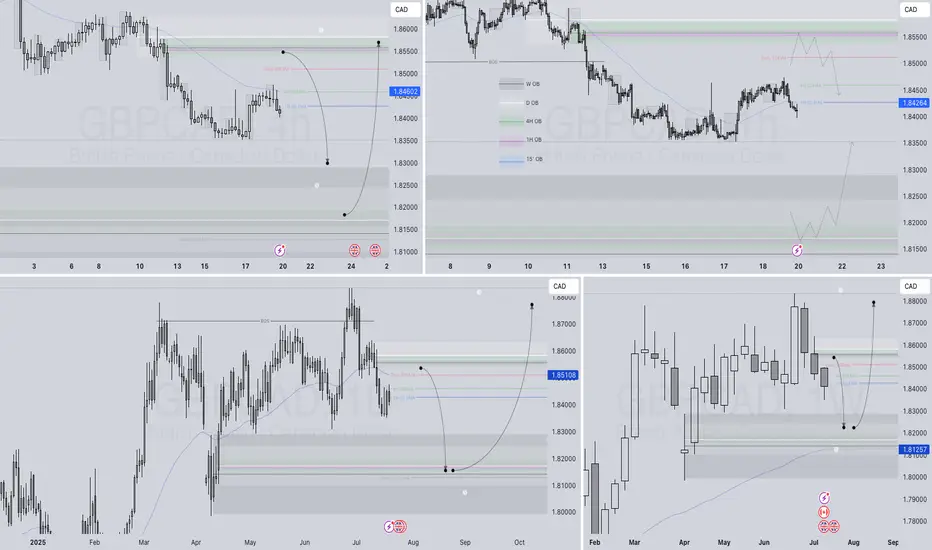
GBPCAD – WEEKLY FORECAST Q3 | W30 | Y25📊 GBPCAD – WEEKLY FORECAST
Q3 | W30 | Y25
Weekly Forecast 🔍📅
Here’s a short diagnosis of the current chart setup 🧠📈
Higher time frame order blocks have been identified — these are our patient points of interest 🎯🧭.
It’s crucial to wait for a confirmed break of structure 🧱✅ before forming a directional bias.
This keeps us disciplined and aligned with what price action is truly telling us.
📈 Risk Management Protocols
🔑 Core principles:
Max 1% risk per trade
Only execute at pre-identified levels
Use alerts, not emotion
Stick to your RR plan — minimum 1:2
🧠 You’re not paid for how many trades you take, you’re paid for how well you manage risk.
🧠 Weekly FRGNT Insight
"Trade what the market gives, not what your ego wants."
Stay mechanical. Stay focused. Let the probabilities work.
FRGNT FOREX ANALYSIS 📊
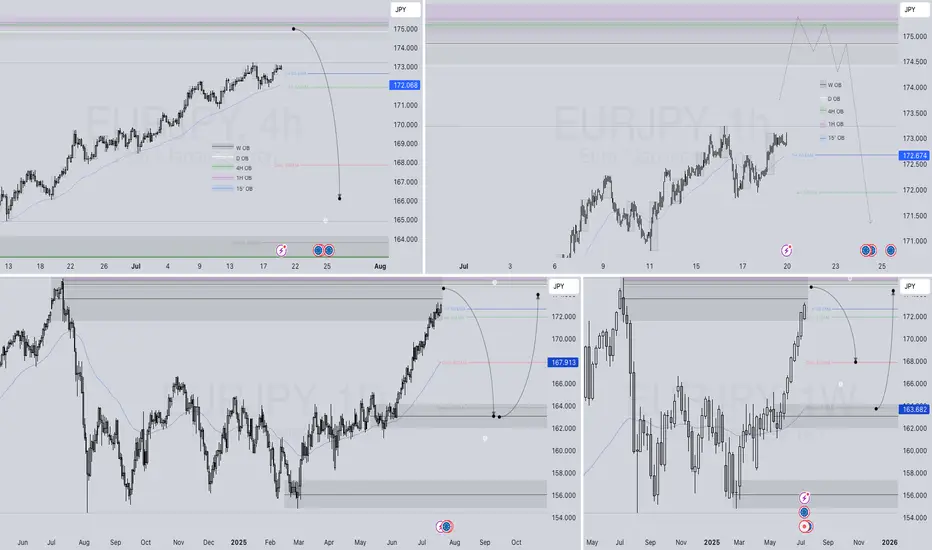
EURJPY – WEEKLY FORECAST Q3 | W30 | Y25📊 EURJPY – WEEKLY FORECAST
Q3 | W30 | Y25
Weekly Forecast 🔍📅
Here’s a short diagnosis of the current chart setup 🧠📈
Higher time frame order blocks have been identified — these are our patient points of interest 🎯🧭.
It’s crucial to wait for a confirmed break of structure 🧱✅ before forming a directional bias.
This keeps us disciplined and aligned with what price action is truly telling us.
📈 Risk Management Protocols
🔑 Core principles:
Max 1% risk per trade
Only execute at pre-identified levels
Use alerts, not emotion
Stick to your RR plan — minimum 1:2
🧠 You’re not paid for how many trades you take, you’re paid for how well you manage risk.
🧠 Weekly FRGNT Insight
"Trade what the market gives, not what your ego wants."
Stay mechanical. Stay focused. Let the probabilities work.
FRGNT FOREX ANALYSIS 📊
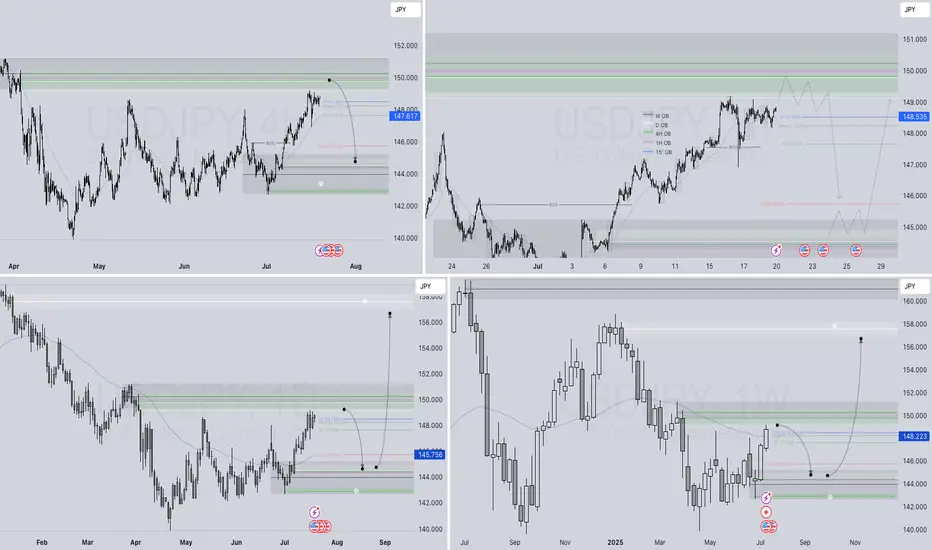
USDJPY – WEEKLY FORECAST Q3 | W30 | Y25📊 USDJPY – WEEKLY FORECAST
Q3 | W30 | Y25
Weekly Forecast 🔍📅
Here’s a short diagnosis of the current chart setup 🧠📈
Higher time frame order blocks have been identified — these are our patient points of interest 🎯🧭.
It’s crucial to wait for a confirmed break of structure 🧱✅ before forming a directional bias.
This keeps us disciplined and aligned with what price action is truly telling us.
📈 Risk Management Protocols
🔑 Core principles:
Max 1% risk per trade
Only execute at pre-identified levels
Use alerts, not emotion
Stick to your RR plan — minimum 1:2
🧠 You’re not paid for how many trades you take, you’re paid for how well you manage risk.
🧠 Weekly FRGNT Insight
"Trade what the market gives, not what your ego wants."
Stay mechanical. Stay focused. Let the probabilities work.
FRGNT FOREX ANALYSIS 📊