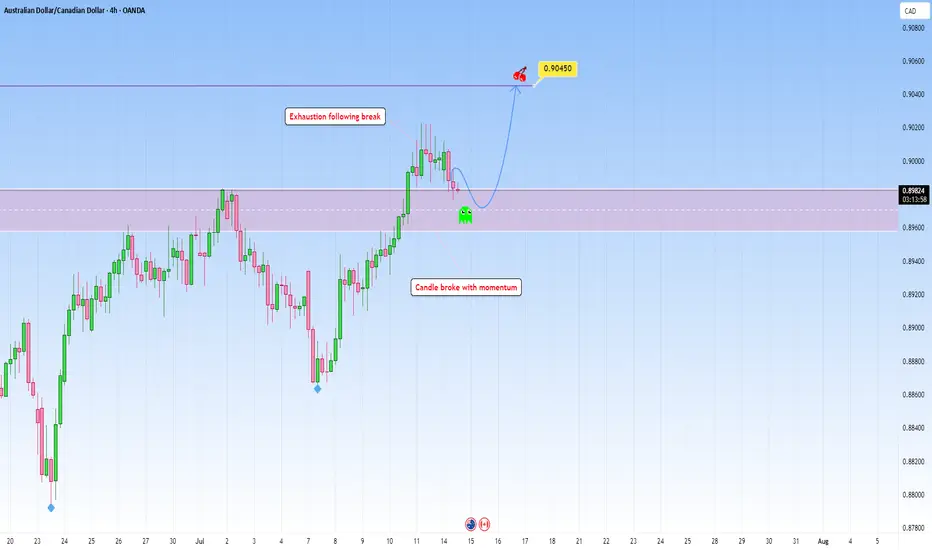
AUDCAD Trade plan: Waiting for bullish confirmation at RetestPrice broke above resistance with a momentum candle, indicating buyer control. This is our first clue that a structure shift might have occurred.
This retest is essential. Many traders make the mistake of entering too early without confirmation. But it's right here, once price touches the former resistance, that you must observe how price reacts. Look for price exhaustion or reversal candlesticks such as bullish engulfing patterns, or even inside bars.
Once rejection is confirmed, I'm looking to go long to 0.90450.
Just sharing my thoughts for the charts, this isn’t financial advice. Always confirm your setups and manage your risk properly.
Freesignals
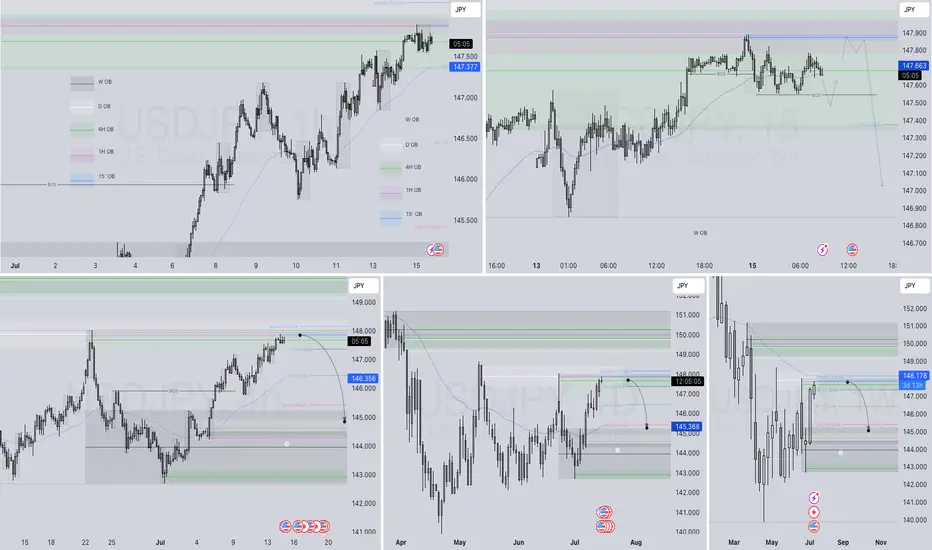
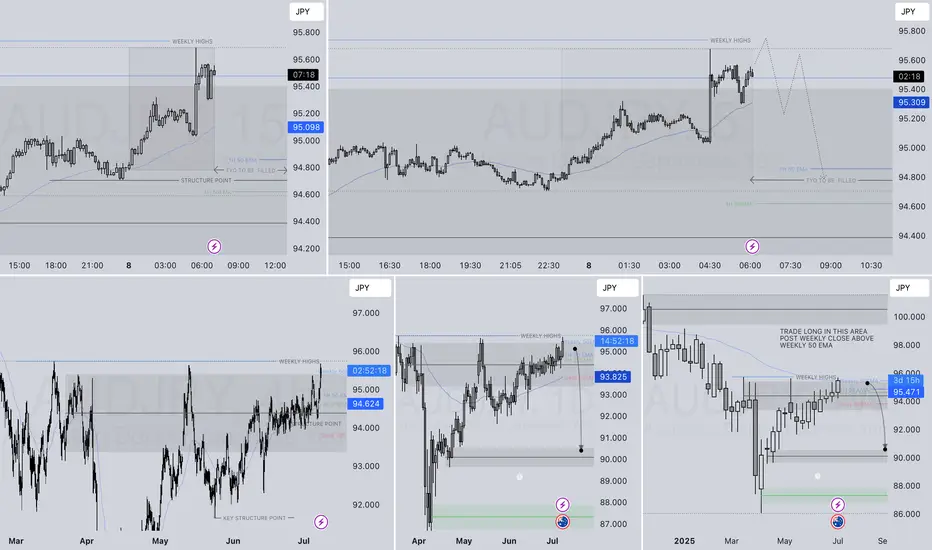
USDJPY LONG & SHORT – DAILY FORECAST Q3 | D15 | W29 | Y25💼 USDJPY LONG & SHORT – DAILY FORECAST
Q3 | D15 | W29 | Y25
📊 MARKET STRUCTURE SNAPSHOT
USDJPY is currently reaching for a key higher time frame supply zone, looking for price action to show weakness at premium levels. Structure and momentum are now aligning for a short opportunity backed by multi-timeframe confluence.
🔍 Confluences to Watch 📝
✅ Daily Order Block (OB)
Looking for Strong reaction and early signs of distribution.
✅ 4H Order Block
Break of internal structure (iBoS) confirms a short-term bearish transition.
✅ 1H Order Block
📈 Risk Management Protocols
🔑 Core principles:
Max 1% risk per trade
Only execute at pre-identified levels
Use alerts, not emotion
Stick to your RR plan — minimum 1:2
🧠 You’re not paid for how many trades you take, you’re paid for how well you manage risk.
🧠 Weekly FRGNT Insight
"Trade what the market gives, not what your ego wants."
Stay mechanical. Stay focused. Let the probabilities work.
🏁 Final Thoughts from FRGNT
📌 The structure is clear.
The confluences are stacked.
Let execution follow discipline, not emotion.
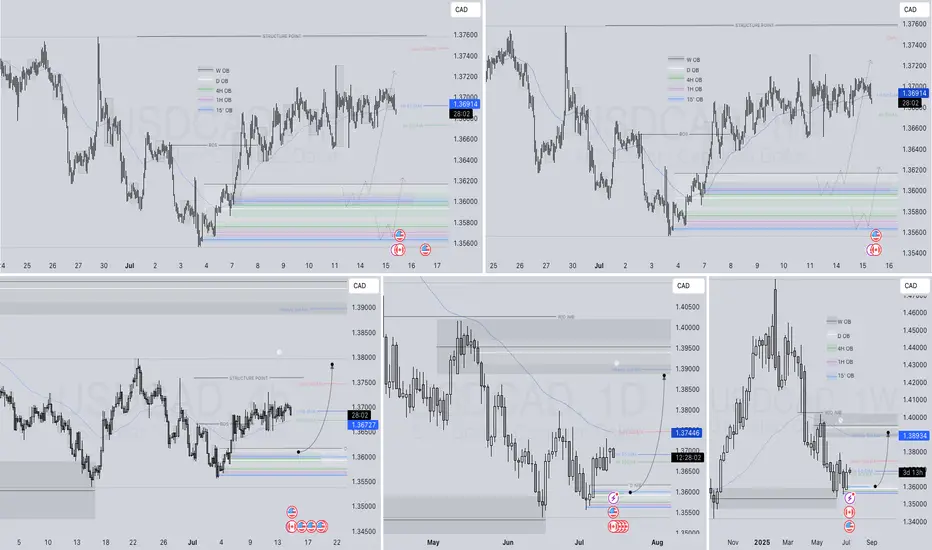
USDCAD LONG DAILY FORECAST Q3 D15 W29 Y25USDCAD LONG DAILY FORECAST Q3 D15 W29 Y25
Professional Risk Managers👋
Welcome back to another FRGNT chart update📈
Diving into some Forex setups using predominantly higher time frame order blocks alongside confirmation breaks of structure.
Let’s see what price action is telling us today! 👀
💡Here are some trade confluences📝
✅Daily Order block identified
✅4H Order Block identified
✅1H Order Block identified
🔑 Remember, to participate in trading comes always with a degree of risk, therefore as professional risk managers it remains vital that we stick to our risk management plan as well as our trading strategies.
📈The rest, we leave to the balance of probabilities.
💡Fail to plan. Plan to fail.
🏆It has always been that simple.
❤️Good luck with your trading journey, I shall see you at the very top.
🎯Trade consistent, FRGNT X
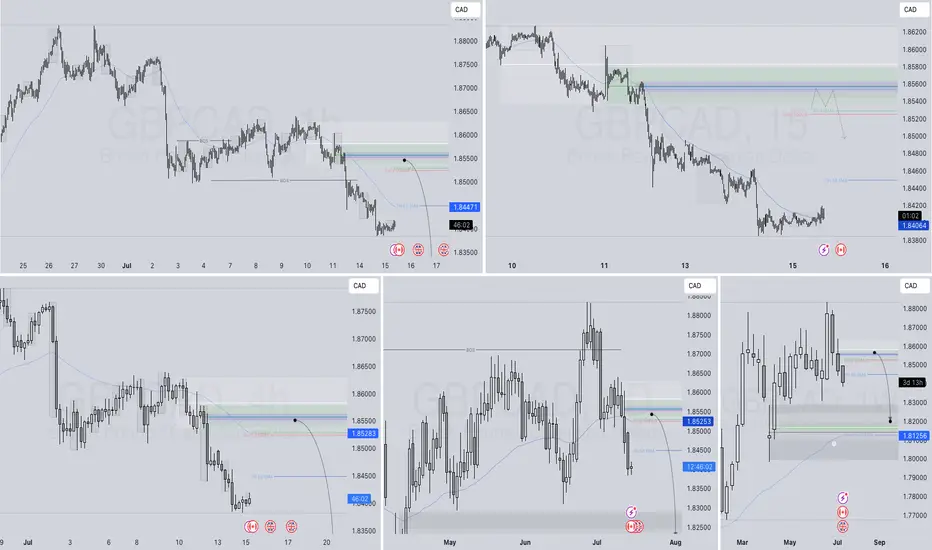
GBPCAD SHORT FORECAST Q3 D15 W29 Y25GBPCAD SHORT FORECAST Q3 D15 W29 Y25
Professional Risk Managers👋
Welcome back to another FRGNT chart update📈
Diving into some Forex setups using predominantly higher time frame order blocks alongside confirmation breaks of structure.
Let’s see what price action is telling us today! 👀
💡Here are some trade confluences📝
✅Daily Order block identified
✅4H Order Block identified
✅1H Order Block identified
🔑 Remember, to participate in trading comes always with a degree of risk, therefore as professional risk managers it remains vital that we stick to our risk management plan as well as our trading strategies.
📈The rest, we leave to the balance of probabilities.
💡Fail to plan. Plan to fail.
🏆It has always been that simple.
❤️Good luck with your trading journey, I shall see you at the very top.
🎯Trade consistent, FRGNT X
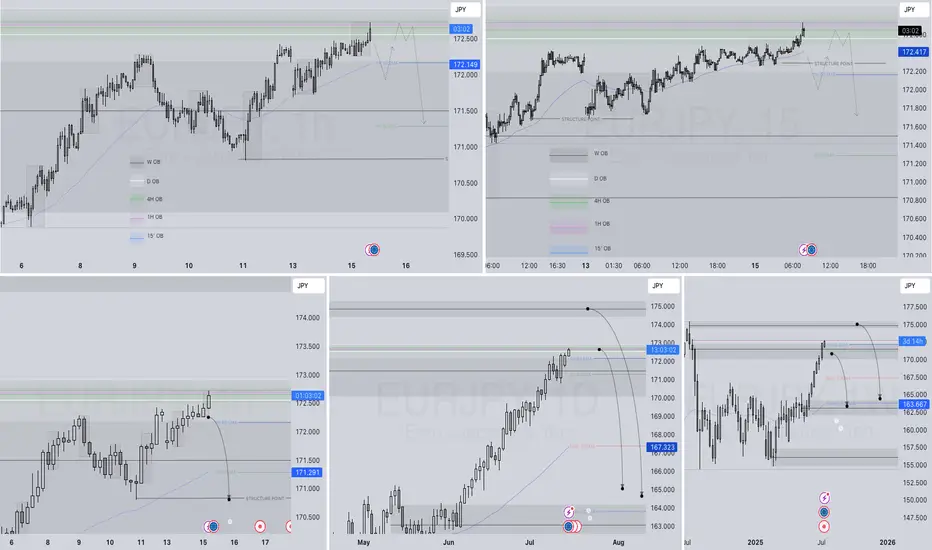
EURJPY SHORT – DAILY FORECAST Q3 | W29 | D15 | Y25💼 EURJPY SHORT – DAILY FORECAST
Q3 | W29 | D15 | Y25
📊 MARKET STRUCTURE SNAPSHOT
EURJPY is currently reacting from a key higher time frame supply zone, with price action showing weakness at premium levels. Structure and momentum are now aligning for a short opportunity backed by multi-timeframe confluence.
🔍 Confluences to Watch 📝
✅ Daily Order Block (OB)
Strong reaction and early signs of distribution.
Previous bullish momentum is losing steam; structure is flattening with rejection wicks forming.
✅ 4H Order Block
Break of internal structure (iBoS) confirms a short-term bearish transition.
✅ 1H Order Block
1H structure shift bearish
📈 Risk Management Protocols
🔑 Core principles:
Max 1% risk per trade
Only execute at pre-identified levels
Use alerts, not emotion
Stick to your RR plan — minimum 1:2
🧠 You’re not paid for how many trades you take, you’re paid for how well you manage risk.
🧠 Weekly FRGNT Insight
"Trade what the market gives, not what your ego wants."
Stay mechanical. Stay focused. Let the probabilities work.
🏁 Final Thoughts from FRGNT
📌 The structure is clear.
The confluences are stacked.
Let execution follow discipline, not emotion.
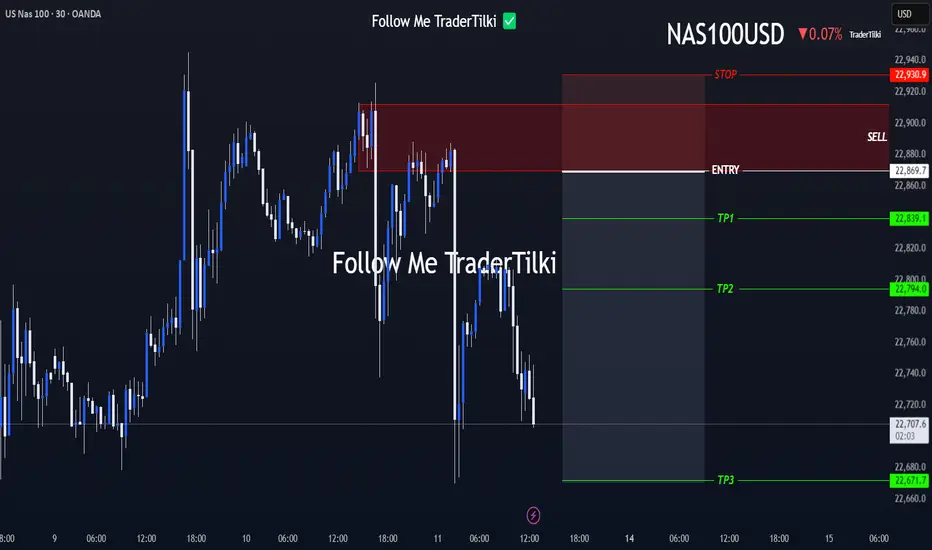
NAS100 Setup Locked In — Ride the Drop from the Order Block!Hey Guys,
I'm planning a sell trade on the NAS100 index from a designated order block. Once price reaches the sell zone, the position will be activated.
📍 Trade Details:
- 🟢 Entry Level: 22,869
- 🔴 Stop Loss: 22,930
- 🎯 TP1 – First Target: 22,839
- 🎯 TP2 – Second Target: 22,794
- 🎯 TP3 – Final Target: 22,671
📐 Risk-to-Reward Ratio: 3.24
Your likes and support are what keep me motivated to share these analyses consistently.
Huge thanks to everyone who shows love and appreciation! 🙏
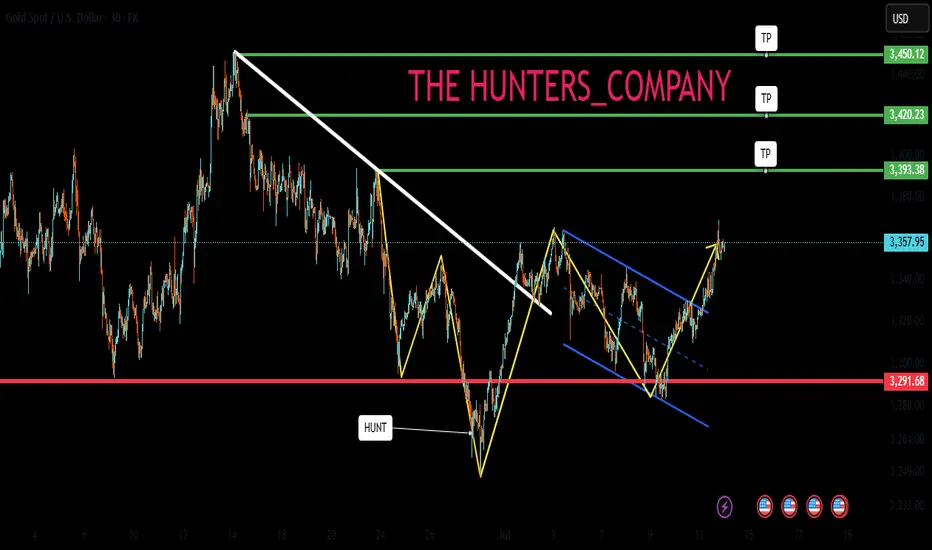
GOLD UPDATE Hello friends🙌
📉Regarding the decline we had, which we also analyzed for you and said that the price is falling...
✔Now, with the support hunt identified, you can see that the price has returned strongly and broken the identified resistance and managed to reach higher ceilings, which also created a QM pattern, which increases the likelihood of the upward trend continuing.
Now with capital and risk management you can move towards your specified goals.
🔥Follow us for more signals🔥
*Trade safely with us*
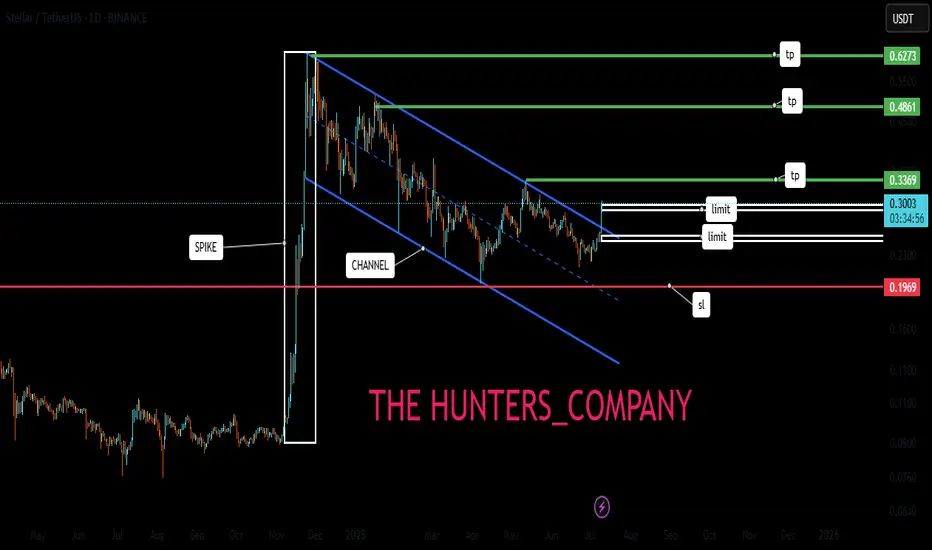
XLM/USDT;FREE SIGNALHello friends🙌
Given the good price growth, you can see that the price has entered a channel, which has caused the price to form a flag...
Now, with a strong channel breakdown by buyers and their entry, you can enter the trade with risk and capital management and move with it to the specified targets.
🔥Join us for more signals🔥
*Trade safely with us*
What Are Bollinger Bands? How to use it.✅ What Are Bollinger Bands?
Bollinger Bands are a volatility-based technical analysis tool developed by John Bollinger. They consist of three lines:
1. Middle Band: 20-period Simple Moving Average (SMA)
2. Upper Band: Middle Band + 2 standard deviations
3. Lower Band: Middle Band - 2 standard deviations
The bands expand and contract based on price volatility.
📊 What Bollinger Bands Tell You
Contraction (Squeeze): Low volatility, possible breakout coming
Expansion: High volatility, breakout in progress or exhausted
Price Touches Band: Doesn’t mean reversal—it's a sign of strength or weakness
🎯 Mastering Strategies with Bollinger Bands
1. Bollinger Band Squeeze (Breakout Strategy)
Setup: Bands are very close together (low volatility)
Signal: Wait for breakout and volume spike
Action: Enter in direction of breakout
Tip: Combine with MACD or RSI for confirmation
> 🔍 Example: If the price breaks above the upper band with strong volume after a squeeze → potential long entry.
2. Mean Reversion (Reversal Strategy)
Setup: Price touches or exceeds upper/lower band
Signal: Look for RSI divergence, candlestick reversal patterns
Action: Fade the move back to the 20 SMA (mean reversion)
Tip: Works best in ranging markets
> ⚠️ Warning: Don’t short just because price touches the upper band. Look for confluence.
3. Trend Riding with Bands
Setup: Price rides upper/lower band
Signal: Pullbacks to the 20 SMA in a strong trend
Action: Enter on bounce near SMA if the trend is strong
Tip: Use higher timeframes to confirm the trend
> 🟢 In an uptrend, buy near the 20 SMA when price pulls back but doesn’t break lower band.
📌 Key Tips for Mastery
1. Adjust settings for asset/timeframe (e.g., crypto might need a 10 or 14 SMA)
2. Never use Bollinger Bands alone – combine with:
RSI (for overbought/oversold confirmation)
MACD (trend confirmation)
Volume (for breakout confirmation)
3. Use multiple timeframes – e.g., 4H for trend, 15m for entry
4. Avoid chasing band breakouts without confirmation
5. Backtest strategies with your preferred asset
🧠 Advanced Concepts
Double Bottoms Outside Band: When price forms a W-bottom with the second low outside the lower band bullish reversal setup.
Walking the Band: In strong trends, price can "walk" along the band don’t fade too early.
Band Width: Track the width of bands to detect upcoming breakouts.
⚠️ Disclaimer
This guide is for educational purposes only and does not constitute financial advice. Trading involves risk, and past performance does not guarantee future results. Always do your own research (DYOR) and consult with a financial advisor before making any investment decisions.

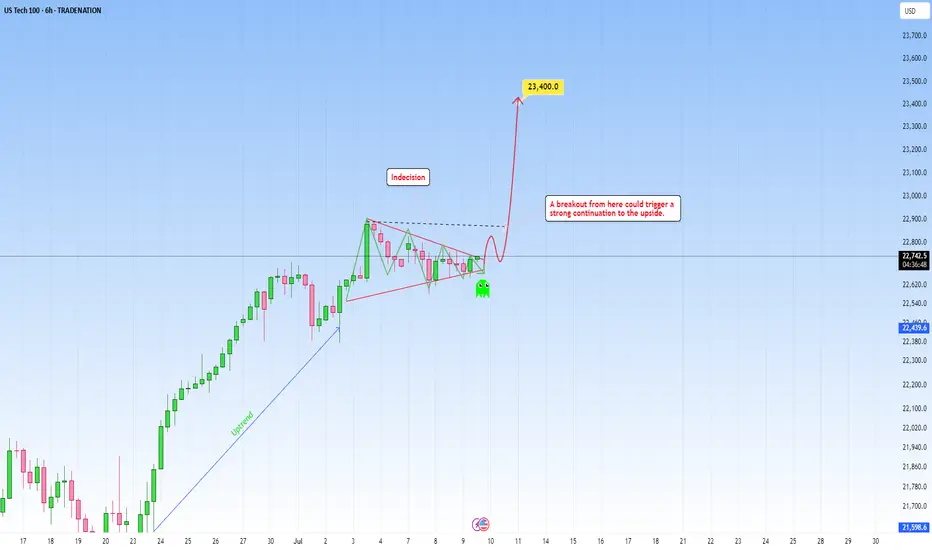
One last squeeze and NAS100 could explode into the next rallyThe NAS100 is currently coiling within a tight consolidation range, showing signs of tension building up. After a strong push upward, price has been moving sideways in a narrowing structure. This build-up around the high, a compression of buyers and sellers in a low-volatility squeeze could be an indication that we could use. This kind of price action typically signals that buyers are gaining control, squeezing out sellers with each dip.
The lack of deep pullbacks combined with increasingly shallow sell-offs shows fading bearish momentum. Which is often typical during a buildup phase before a breakout. If buyers can push price above with a strong close, it could trigger breakout momentum and lead to a continuation of the larger bullish trend.
Ideally, if price reacts positively and forms bullish confirmation, it would set up a solid continuation entry, with upside potential toward the next target of 23.400.
Until then, bulls are watching closely for signs of commitment. The breakout is yet to be confirmed, but the squeeze is on, and the pressure is building.
What will happen next?
Just sharing my thoughts for the charts, this isn’t financial advice. Always confirm your setups and manage your risk properly.
Disclosure: I am part of Trade Nation's Influencer program and receive a monthly fee for using their TradingView charts in my analysis.
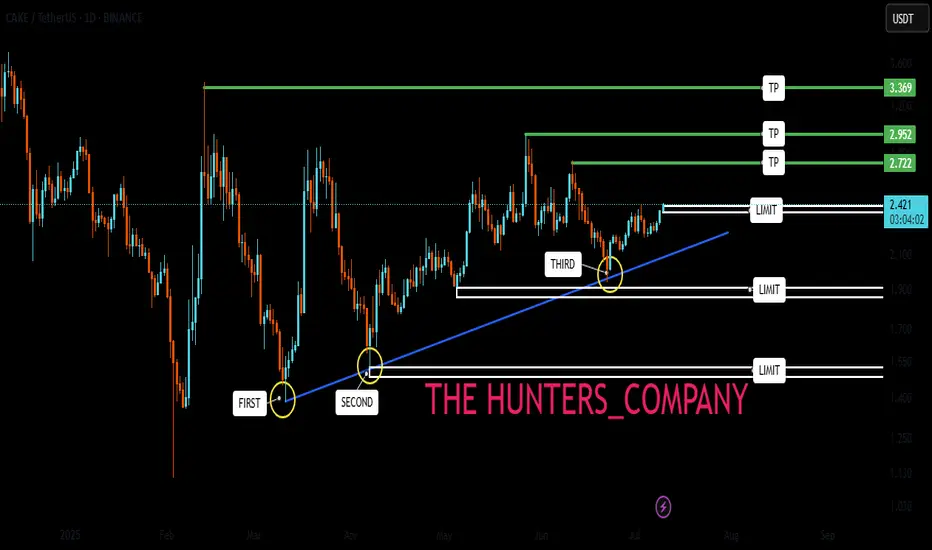
CAKE : Are we left behind?Hello friends🙌
😉We came with a good currency analysis from the decentralized exchange Pancake Swap.
So you see that we have a good price support that buyers supported the price well after each collision.
🔊Now, considering the collision with this support, we can expect growth to the specified areas. Of course, don't forget that capital management and risk are the priority of trading.
🔥Follow us for more signals🔥
*Trade safely with us*
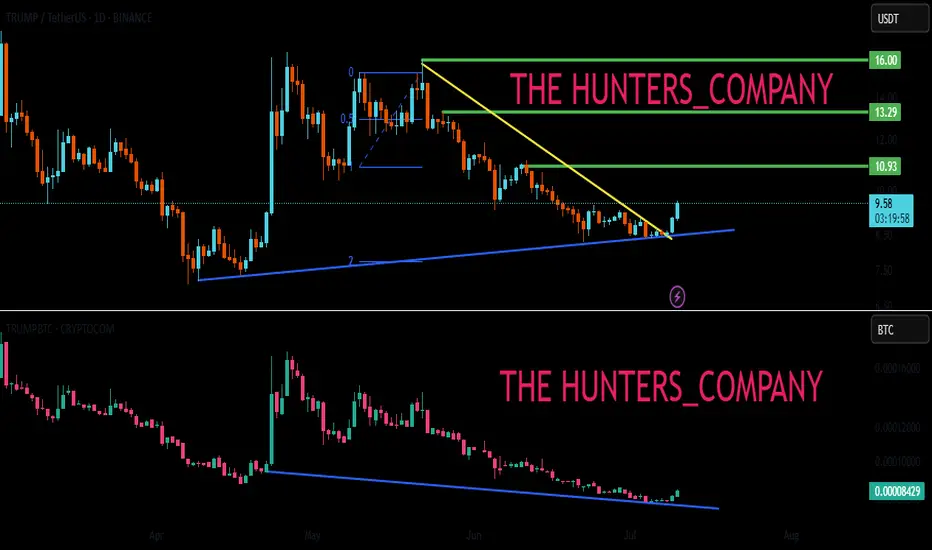
TRUMP BUY ???Hello friends🙌
🔊As you can see in the picture, we have brought you two Trump charts:
1_TRUMP/USDT, in which we see an upward trend.
2_TRUMP/BTC, in which we see a downward trend.
✔Now what is the conclusion? When this negative divergence occurs, it means that money flows from Bit to Tether, and we can expect good growth from it to the specified targets, given the price reaching important support and its return📈
🔥Join us for more signals🔥
Trade safely with us.
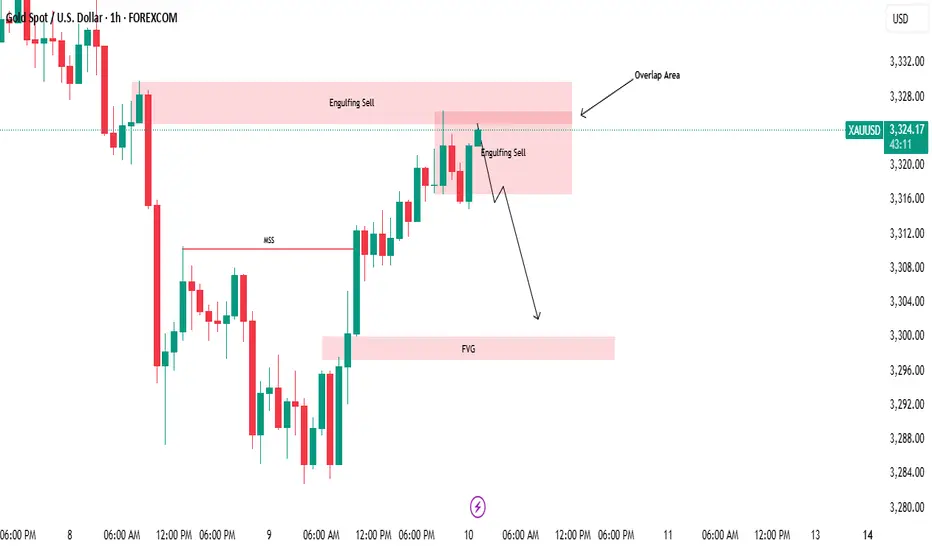
Market Structure Break & Bearish Reaction from Supply Zone.🔍 GOLD – Market Structure Break & Bearish Reaction from Supply Zone
Gold has recently broken its market structure (MSS), which is a significant shift in momentum and a potential indication of a change in the prevailing trend. Following this break, price retraced into a key supply zone, where it was rejected sharply—this rejection came in the form of a strong bearish engulfing candle, highlighting aggressive selling interest.
Interestingly, the market has now printed a second consecutive bearish engulfing from the same zone. This is a powerful signal that sellers are active and defending this level, making it a valid and confirmed short-term resistance zone. The repeated rejection suggests that smart money or institutional sellers may be positioned here.
Given this price action, we can anticipate a potential retracement from the current levels. The most probable downside target for this retracement would be the Fair Value Gap (FVG) that has been marked on the chart. If price respects the FVG and reacts bullishly from there, we may then see a resumption of the uptrend, possibly taking price higher again.
This setup presents a good opportunity for both short-term intraday traders and swing traders to watch for confirmation signals before entering the trade.
📌 Key Takeaways:
MSS indicates shift in trend
Consecutive bearish engulfing candles from supply zone
Sellers likely active in this area
Potential retracement toward marked FVG
Possible bullish continuation from FVG zone
🚨 As always, Do Your Own Research (DYOR) and manage your risk accordingly before making any trading decisions.
Gold To The Basement? Week Ahead with Bearish Bias by PhoenixFX🌟 Welcome to Phoenix FX’s Intraday Pulse! 🌟
Hello, Phoenix FX family! 👋 I’m thrilled you’ve joined us for today’s TradingView chart breakdown. Our focus? Intraday opportunities—spotting those high-probability setups you can enter, manage, and leave to run whilst you concentrate on the things you love doing.
Here’s what you’ll find in this analysis:
Key Levels & Zones: Support, resistance, and Fair Value Gaps that matter on the smaller timeframes.
Price-Action Clues: Exact candlestick patterns and momentum signals to watch for your next entry.
Trade Triggers & Targets: Clear criteria for when to get in, where to take profits, and how to manage your risk.
Whether you’re hunting quick scalps or tactical swing moves, our goal is simple: help you trade with confidence, clarity, and community support. Got a different view or a fresh idea? Drop it in the comments—after all, “each one, teach one.” 😉
Let’s dive into the charts and make today’s market moves count! 🚀📈
Donald Trump’s presidency continues to exert outsized influence on gold through three main channels: trade policy uncertainty, fiscal stimulus (and resulting deficits), and shifts in safe-haven demand. Here’s how each factor has played out—and what it could mean for gold going forward:
1. Trade-War Uncertainty
What’s Happening: The Trump administration’s aggressive use of tariffs—including recent 25% duties on goods from Japan and South Korea—has periodically roiled markets and driven investors into gold as a safe haven. On July 7, gold pared losses after tariff news, as traders sought refuge despite a firm dollar.
Looking Ahead: If further tariff escalations or retaliations emerge, expect renewed spikes in gold. Conversely, any de-escalation or trade-deal breakthroughs could sap that safe-haven bid.
2. Fiscal Stimulus & Deficits
What’s Happening: Senate Republicans recently passed a Trump-backed tax‐and‐spending package projected to add $3.3 trillion to the U.S. deficit. Larger deficits—especially when financed by the Fed—tend to stoke inflation expectations, which bolsters gold’s appeal as an inflation hedge.
Looking Ahead: Continued large-scale stimulus or fresh tax cuts without offsetting revenue measures could keep real yields low (or negative), a classic tailwind for gold.
3. Safe-Haven Flows & Investor Positioning
What’s Happening: Despite peaking at record highs earlier this year, gold remains up roughly 30% since November, driven largely by investor fears around Trump’s policy unpredictability and geopolitical tensions.
Looking Ahead: Should Trump-era uncertainty persist—whether around trade, foreign policy, or domestic turmoil—gold is likely to retain its status as a portfolio diversifier and crisis hedge. A sustained drop in U.S. real rates or fresh bouts of market volatility would reinforce that trend.
🎯 Outlook Summary
Bullish Drivers: Ongoing trade-war rhetoric, larger deficits, and any new geopolitical flashpoints.
Bearish Risks: Clear resolution of major trade disputes, a pivot by the Fed toward earlier rate cuts (reducing real‐rate support for gold), or diminished investor fear.
------------------------------------------------------------------------------------------
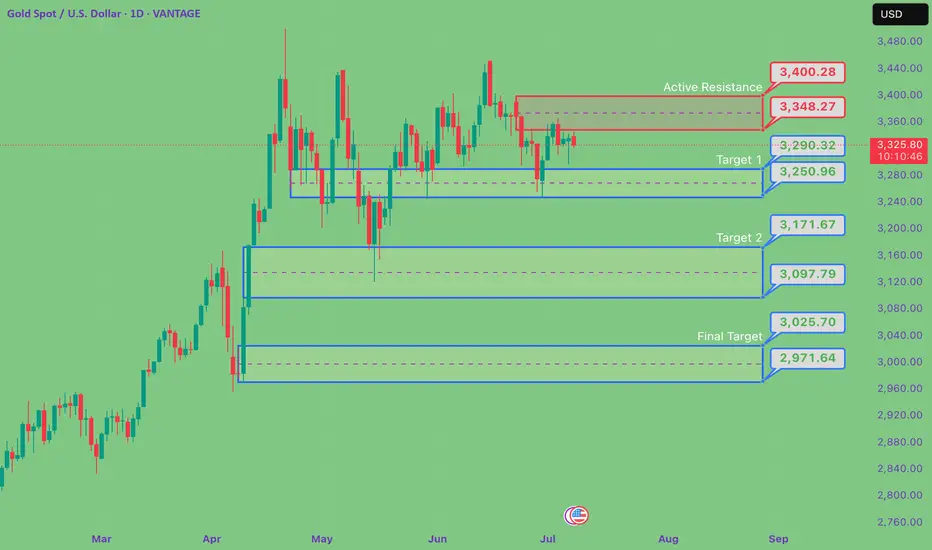
PhoenixFX price action analysis based on the Daily time frame
🔴 Primary Resistance (Daily)
Zone: $3,348 – $3,400
Why It Matters:
Multiple daily closes have stalled here, leaving a clear Fair-Value Gap (dashed purple). Sellers are likely to defend this range until we see a decisive daily close above $3,400.
📉 Bearish Bias – Short Setups
Short at Resistance
Entry: Bearish daily reversal candle (engulfing, pin-bar) in $3,348–$3,400
Targets:
TP1: $3,290 (50% of Primary Buy Zone)
TP2: $3,250 (Primary Buy Zone low)
TP3: $3,172 (Secondary Buy Zone high)
Stop-Loss: Above $3,420
Breakdown Short
Trigger: Daily close below $3,250 (Primary Buy Zone low)
Entry: On the open of the next daily candle after close below $3,250
Targets:
TP1: $3,172 (Secondary Buy Zone)
TP2: $3,026 (Final Buy Zone 50% level)
Stop-Loss: Above $3,290
🔵 Potential Long Opportunities
Defensive Long (Aggressive)
Entry: Bullish daily rejection candle in $3,250–$3,290
Targets:
TP1: $3,348 (short-term resistance)
TP2: $3,400 (key resistance)
Stop-Loss: Below $3,230
Trend-Reversal Long (Ultra-Conservative)
Trigger: Daily close above $3,400
Entry: Open of the next daily candle after the close above $3,400
Targets:
TP1: $3,450
TP2: $3,500+
Stop-Loss: Below $3,360
📊 Week-Ahead Scenarios
Bearish Scenario (High Probability):
Price remains capped under $3,400.
Look for a bearish signal in $3,348–$3,400 to initiate shorts.
A break below $3,250 extends the move into deeper demand zones ($3,172 → $3,026).
Bullish Counter-Trend (Lower Probability):
Strong daily rejection candle in $3,250–$3,290 could spark a relief rally.
Short-term longs can target $3,348 and $3,400—ideal for quick swing trades.
Only a sustained daily close above $3,400 shifts the bias back to the upside.
Just a Heads-Up:
This is my take on the charts—not gospel, not financial advice, and definitely not a crystal ball 🔮.
Trading is part skill, part patience, and part “what just happened?” 😅
We all see things a little differently, and that’s the beauty of it. So if you’ve got a hot take, wild theory, or just want to drop some chart wisdom—hit the comments!
Let’s grow, learn, and laugh through the madness together. 🚀📈
Each one, teach one.
— Phoenix FX Team 🔥🦅
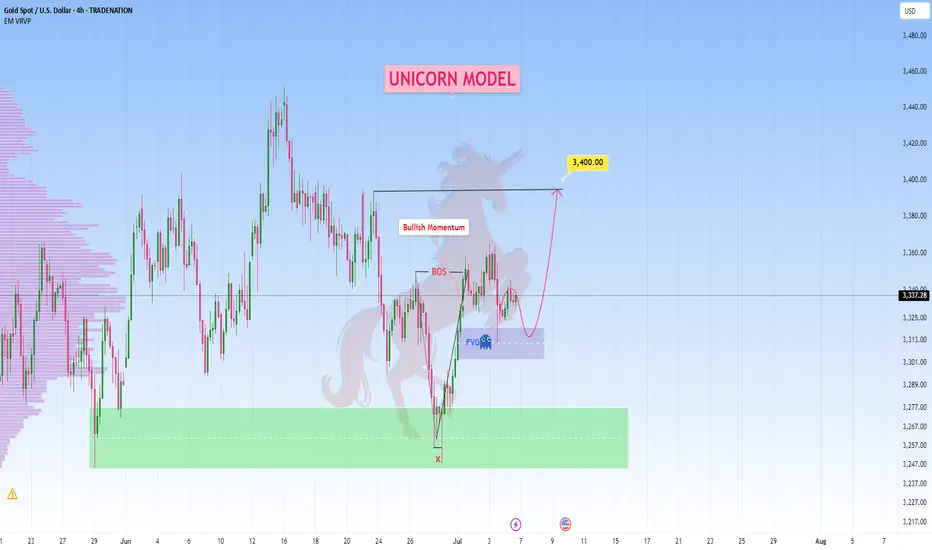
| ICT Unicorn model | The most potent concept spotted on GoldThe Unicorn model is considered by many traders to be one of the most refined and effective concepts within the ICT framework concepts because it brings together several core ideas into one powerful, repeatable setup. But what makes it so highly regarded as one of the best?
It’s the ability to stack multiple high-probability conditions: liquidity grabs, market structure shifts, fair value gaps, and optimal trade entry zones.
Unlike isolated concepts, the Unicorn model doesn’t rely on just one factor. It uses the synergy between time and price → waiting for manipulation first, then entering during the retracement into a fair value gap or order block.
This not only increases accuracy but allows for tight stops and high reward-to-risk ratios. Many traders rely on it exclusively because it’s both structured and versatile, making it easier to apply consistently across various market conditions.
How does this work:
You’ll see the price breaks a swing high, reverses, and creates a Breaker Block (failed order block) with a Fair Value Gap. These overlap to form the “Unicorn zone” → After that, price drops sharply, breaking the previous structure, indicating a shift in market direction → Price retraces, entering the overlapping zone → Traders look for rejections (candlestick patterns, wick spikes) as the entry signal→ With entry near the zone, the stop-loss is placed just beyond the Breaker Block or FVG.
Targets can be the next liquidity levels (e.g., recent lows). Many traders use 2:1 or 3:1 R:R, though targets can be higher.
In other words as a standalone strategy, the Unicorn model is highly effective , if, and only if, you have the correct daily bias. With a clear directional outlook, it becomes a complete and reliable setup.
Which in our case, on Gold it aligns perfectly.
Just sharing my thoughts for the charts, this isn’t financial advice. Always confirm your setups and manage your risk properly.
Disclosure: I am part of Trade Nation's Influencer program and receive a monthly fee for using their TradingView charts in my analysis.
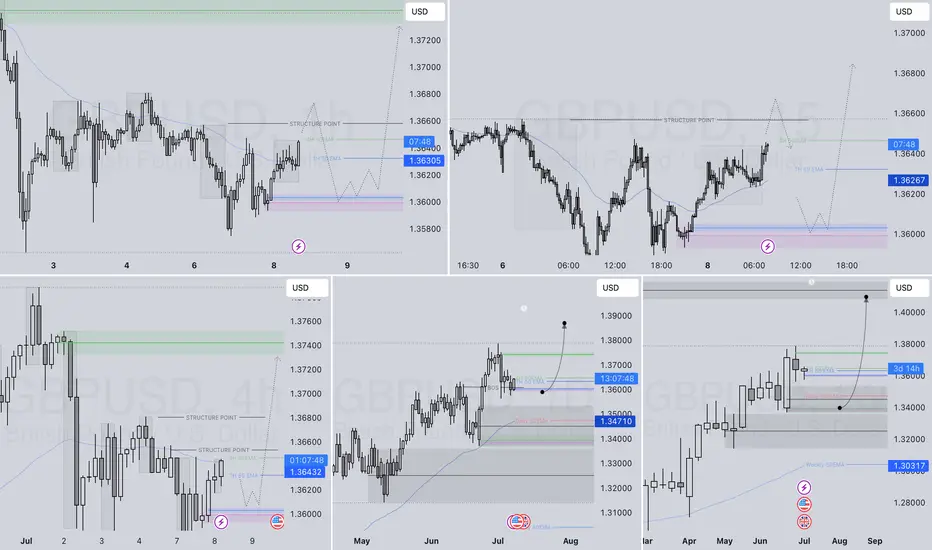
GBPUSD LONG FORECAST Q3 D8 W28 Y25GBPUSD LONG FORECAST Q3 D8 W28 Y25
Professional Risk Managers👋
Welcome back to another FRGNT chart update📈
Diving into some Forex setups using predominantly higher time frame order blocks alongside confirmation breaks of structure.
Let’s see what price action is telling us today!
💡Here are some trade confluences📝
✅Daily order block
✅1H Order block
✅Intraday breaks of structure
✅4H Order block
🔑 Remember, to participate in trading comes always with a degree of risk, therefore as professional risk managers it remains vital that we stick to our risk management plan as well as our trading strategies.
📈The rest, we leave to the balance of probabilities.
💡Fail to plan. Plan to fail.
🏆It has always been that simple.
❤️Good luck with your trading journey, I shall see you at the very top.
🎯Trade consistent, FRGNT X
AUDJPY SHORT FORECAST Q3 D8 W28 Y25AUDJPY SHORT FORECAST Q3 D8 W28 Y25
Professional Risk Managers👋
Welcome back to another FRGNT chart update📈
Diving into some Forex setups using predominantly higher time frame order blocks alongside confirmation breaks of structure.
Let’s see what price action is telling us today! 👀
🔑 Remember, to participate in trading comes always with a degree of risk, therefore as professional risk managers it remains vital that we stick to our risk management plan as well as our trading strategies.
📈The rest, we leave to the balance of probabilities.
💡Fail to plan. Plan to fail.
🏆It has always been that simple.
❤️Good luck with your trading journey, I shall see you at the very top.
🎯Trade consistent, FRGNT X
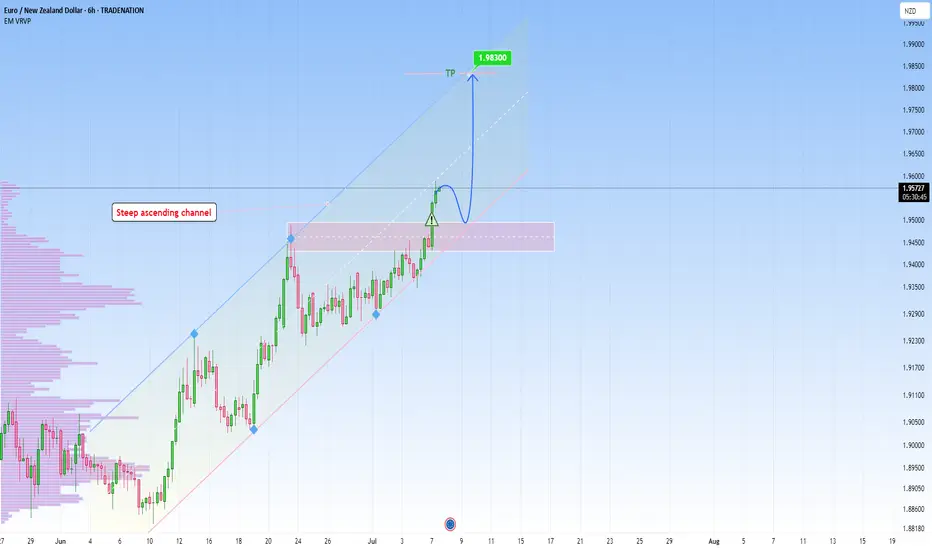
EURNZD: Steep Channel continuation setupEURNZD continues to rise within a steep ascending channel, maintaining a well-structured sequence. No signs of exhaustion are evident yet, as bullish momentum remains strong and price action continues to respect both the midline and lower boundary of the channel.
This ongoing strength suggests that buyers remain in control, and unless we see a clear shift in structure, such as a break below channel support or loss of momentum, the trend remains intact.
🟢 Trend Bias: I remain bullish on EURNZD while price stays within this channel. Any pullbacks toward the lower channel boundary or previous breakout zones may offer continuation opportunities.
🎯 Target: My upside target is 1.983 , which aligns with the projected upper boundary of the ascending channel and makes a good technical target if the structure continues to hold.
🟥 Invalidation: A confirmed breakdown below the channel with follow-through would challenge this bias and signal the possibility of a deeper corrective move.
For now, the structure favors trend continuation over reversal.
Just sharing my thoughts on support and resistance, this isn’t financial advice. Always confirm your setups and manage your risk properly.
Disclosure: I am part of Trade Nation's Influencer program and receive a monthly fee for using their TradingView charts in my analysis.
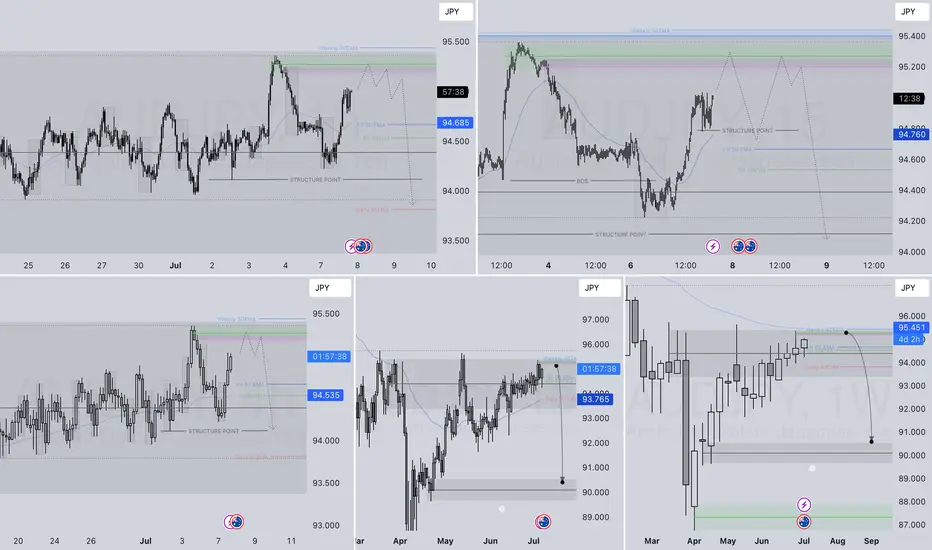
AUDJPY SHORT FORECAST Q3 W28 Y25AUDJPY SHORT FORECAST Q3 W28 Y25
Professional Risk Managers👋
Welcome back to another FRGNT chart update📈
Diving into some Forex setups using predominantly higher time frame order blocks alongside confirmation breaks of structure.
Let’s see what price action is telling us today! 👀
💡Here are some trade confluences📝
✅Weekly Order Block Identified
✅Daily Order block identified
✅4H Order Block identified
✅15' Order block identified
🔑 Remember, to participate in trading comes always with a degree of risk, therefore as professional risk managers it remains vital that we stick to our risk management plan as well as our trading strategies.
📈The rest, we leave to the balance of probabilities.
💡Fail to plan. Plan to fail.
🏆It has always been that simple.
❤️Good luck with your trading journey, I shall see you at the very top.
🎯Trade consistent, FRGNT X
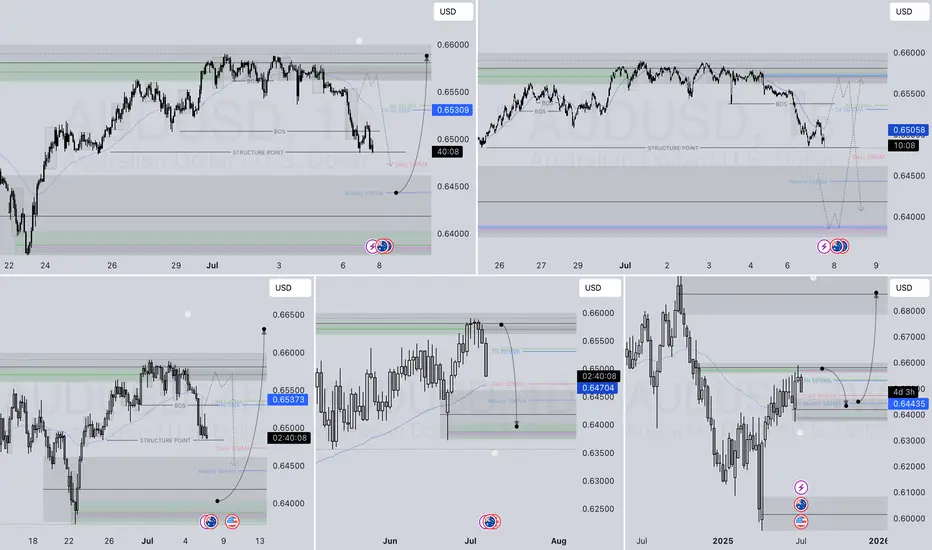
AUDUSD SHORT & LONG FORECAST Q3 W28 Y25AUDUSD SHORT & LONG FORECAST Q3 W28 Y25
Professional Risk Managers👋
Welcome back to another FRGNT chart update📈
Diving into some Forex setups using predominantly higher time frame order blocks alongside confirmation breaks of structure.
Let’s see what price action is telling us today! 👀
💡Here are some trade confluences📝
✅Daily Order block identified
✅4H Order Block identified
✅1H Order Block identified
🔑 Remember, to participate in trading comes always with a degree of risk, therefore as professional risk managers it remains vital that we stick to our risk management plan as well as our trading strategies.
📈The rest, we leave to the balance of probabilities.
💡Fail to plan. Plan to fail.
🏆It has always been that simple.
❤️Good luck with your trading journey, I shall see you at the very top.
🎯Trade consistent, FRGNT X
Live Trade hello friends✋️
Considering the price drop, you can now see that we are in important support and now we can take advantage of this situation and enter into a transaction with risk and capital management.
🔥Follow us for more signals🔥
*Trade safely with us*
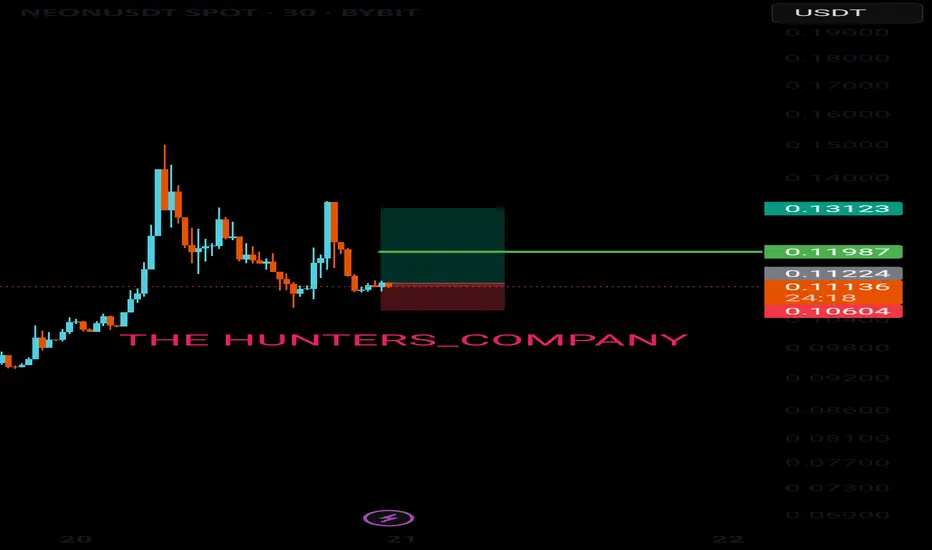
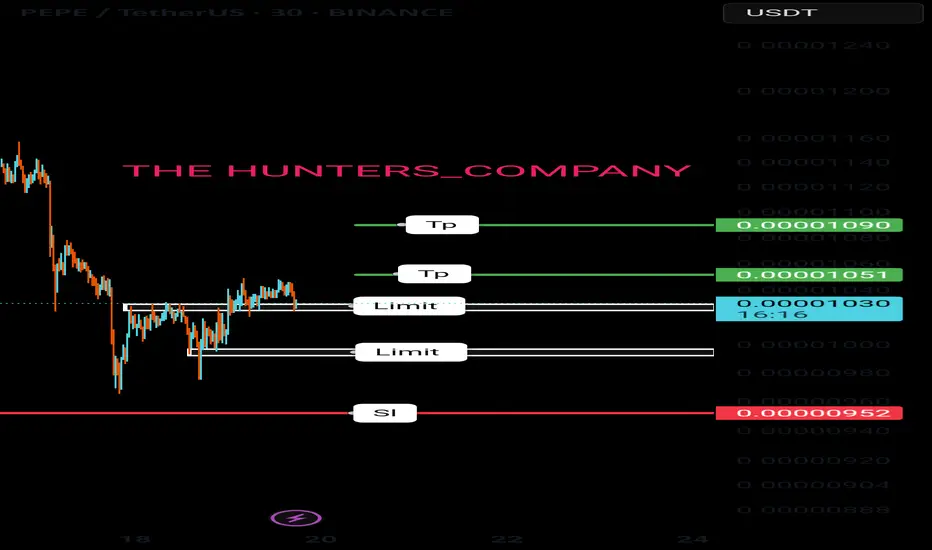
Pepe update hello friends✋️
Considering the drop we had, you can see that the price was well supported in the specified area and buyers came in. Now in the return of the price, we can buy step by step in the specified support areas and move with it until the specified goals, of course, with the management of shame and risk...
*Trade safely with us*
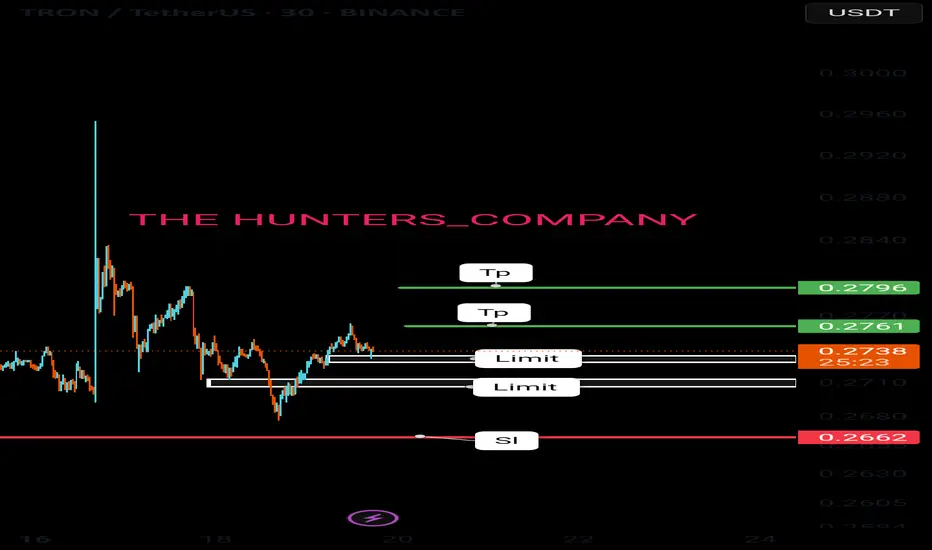
Free signals: today (TRX)hello friends✋️
Considering the drop we had, you can see that the price was well supported in the specified area and buyers came in. Now in the return of the price, we can buy step by step in the specified support areas and move with it until the specified goals, of course, with the management of shame and risk...
*Trade safely with us*