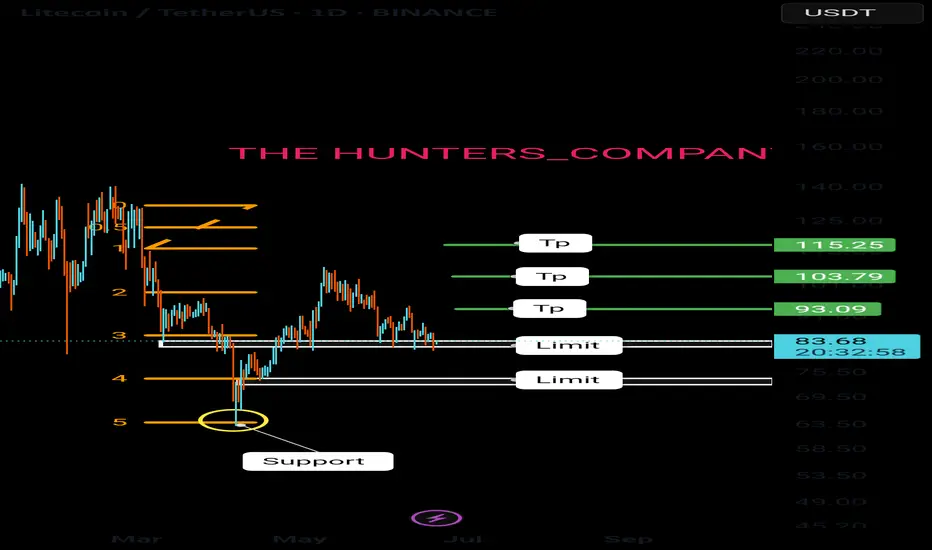
Litecoin:Is the main climb coming?hello friends👋
As you can see, the price, after falling in the support area specified by the buyers, has been supported and returned, forming an upward pattern.
Now we don't enter into a transaction with just one pattern, we also check the entry of buyers and the amount of currency and other factors and draw conclusions.
According to the points we have said, we have identified very important support points for you to buy step by step with capital and risk management and move to the specified goals.
🔥Follow us for more signals 🔥
*Trade with us safely*
Freesignals
Live tradehello friends👋
✅️Considering the drop we had, now the price has reached an important and good support and the price is supported by the buyers, and the downward trend line has broken and the ceiling has been raised. Considering this, we entered into the transaction with capital and risk management.
🔥Join us for more signals🔥
*Trade safely with us*
Live trade hello friends👋
Considering the fall that we had, you can see that the buyers supported the price at the support point and caused it to grow. Now with the return of the price and the construction of an upward pattern, you can see that we can enter into the transaction with capital and risk management and move to the specified goals with it.💰
🔥Join us for more signals🔥
*Trade safely with us*
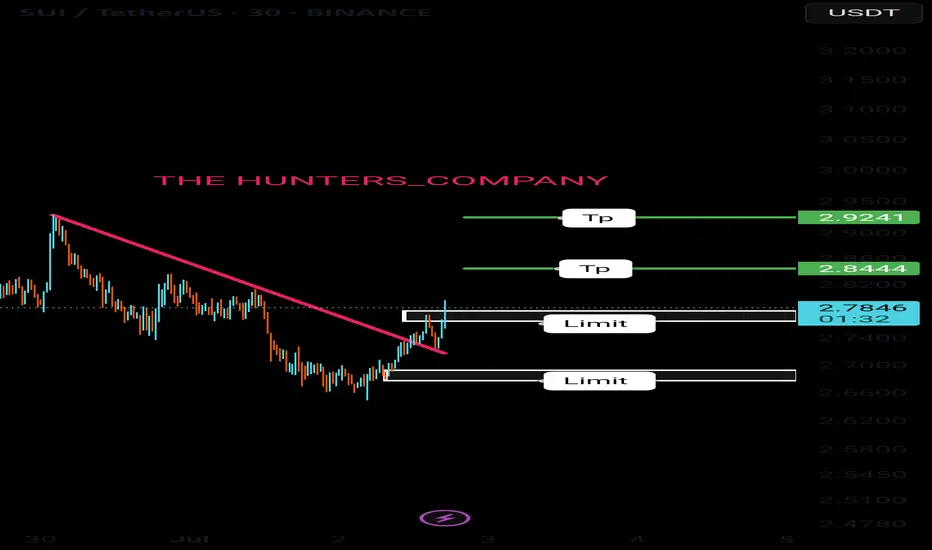
Sui update hello friends👋
✅️Considering the drop we had, now the price has reached an important and good support and the price has been supported by the buyers and the downward trend line has broken and the ceiling has been raised. Considering this, it was possible to enter into the transaction with capital and risk management and move to the specified goals with it.
🔥Join us for more signals🔥
*Trade safely with us*
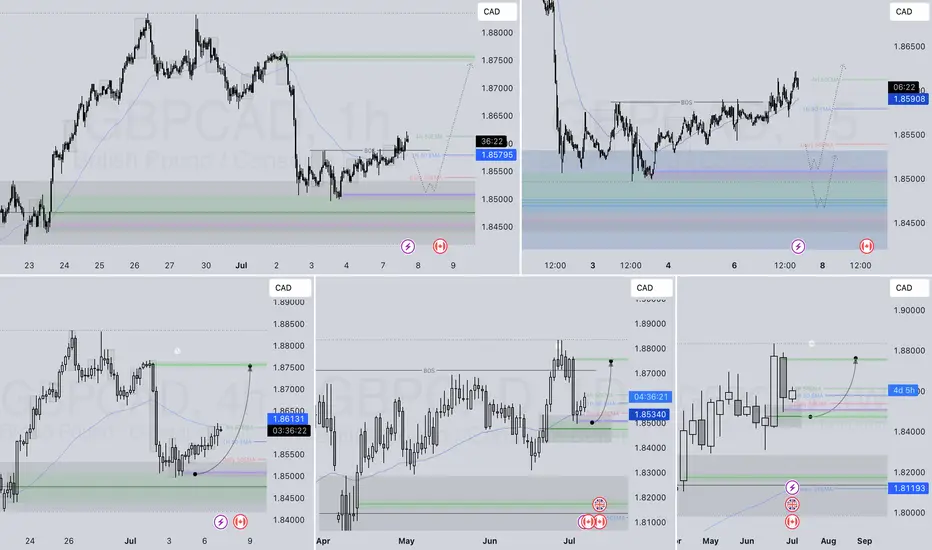
GBPCAD LONG FORECAST Q3 W28 Y25GBPCAD LONG FORECAST Q3 W28 Y25
Professional Risk Managers👋
Welcome back to another FRGNT chart update📈
Diving into some Forex setups using predominantly higher time frame order blocks alongside confirmation breaks of structure.
Let’s see what price action is telling us today! 👀
💡Here are some trade confluences📝
✅Daily Order block identified
✅4H Order Block identified
✅1H Order Block identified
🔑 Remember, to participate in trading comes always with a degree of risk, therefore as professional risk managers it remains vital that we stick to our risk management plan as well as our trading strategies.
📈The rest, we leave to the balance of probabilities.
💡Fail to plan. Plan to fail.
🏆It has always been that simple.
❤️Good luck with your trading journey, I shall see you at the very top.
🎯Trade consistent, FRGNT X
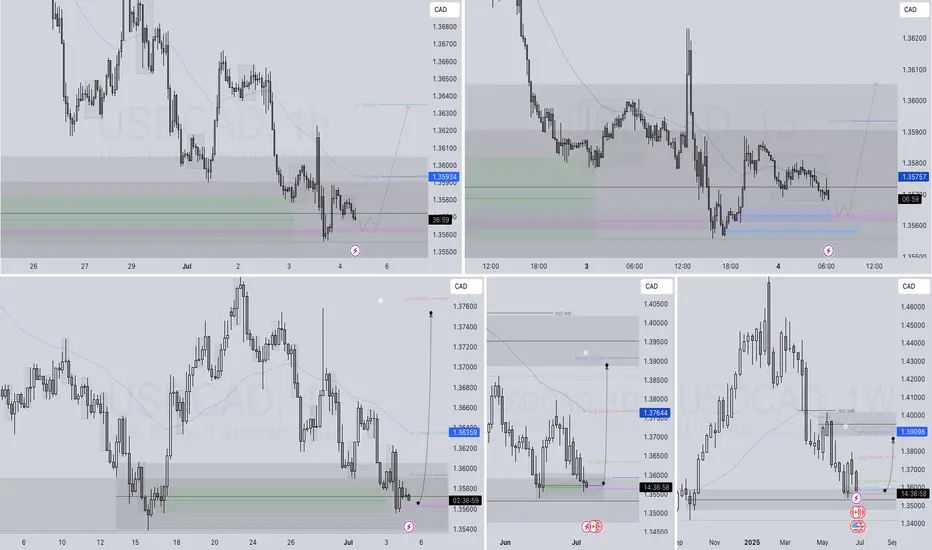
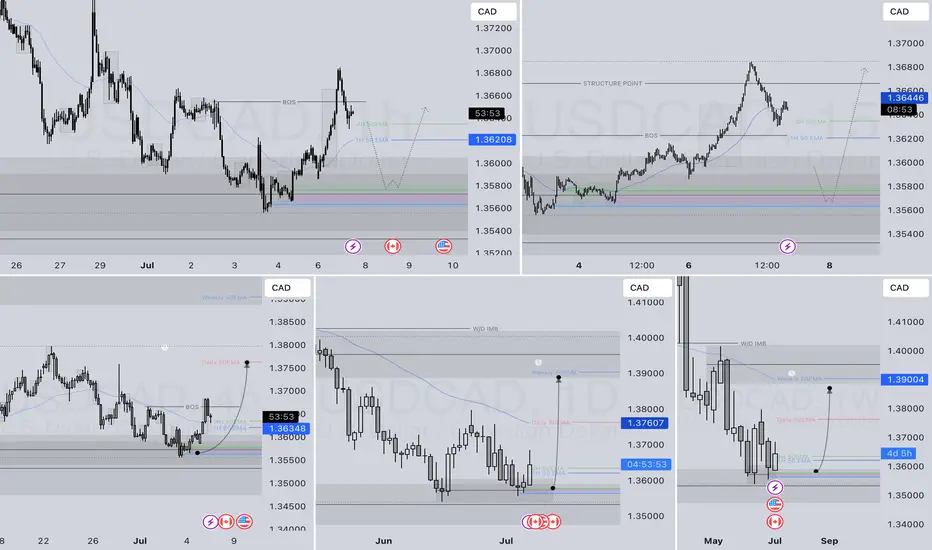
USDCAD LONG DAILY FORECAST Q3 W28 Y25USDCAD LONG DAILY FORECAST Q3 W28 Y25
Professional Risk Managers👋
Welcome back to another FRGNT chart update📈
Diving into some Forex setups using predominantly higher time frame order blocks alongside confirmation breaks of structure.
Let’s see what price action is telling us today! 👀
💡Here are some trade confluences📝
✅Daily Order block identified
✅4H Order Block identified
✅1H Order Block identified
🔑 Remember, to participate in trading comes always with a degree of risk, therefore as professional risk managers it remains vital that we stick to our risk management plan as well as our trading strategies.
📈The rest, we leave to the balance of probabilities.
💡Fail to plan. Plan to fail.
🏆It has always been that simple.
❤️Good luck with your trading journey, I shall see you at the very top.
🎯Trade consistent, FRGNT X
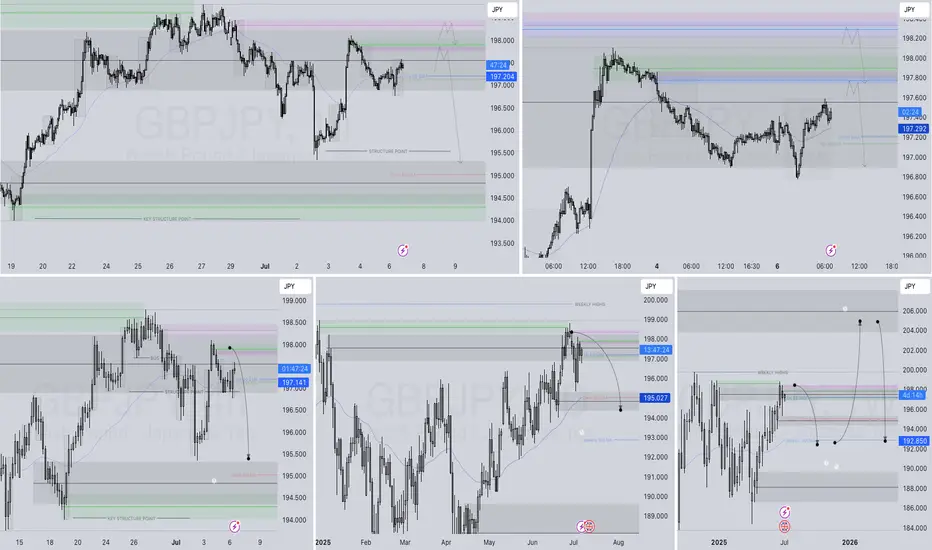
GBPJPY SHORT DAILY FORECAST Q3 D7 W28 Y25GBPJPY SHORT DAILY FORECAST Q3 D7 W28 Y25
Professional Risk Managers👋
Welcome back to another FRGNT chart update📈
Diving into some Forex setups using predominantly higher time frame order blocks alongside confirmation breaks of structure.
Let’s see what price action is telling us today! 👀
💡Here are some trade confluences📝
✅Daily Order block identified
✅4H Order Block identified
✅1H Order Block identified
🔑 Remember, to participate in trading comes always with a degree of risk, therefore as professional risk managers it remains vital that we stick to our risk management plan as well as our trading strategies.
📈The rest, we leave to the balance of probabilities.
💡Fail to plan. Plan to fail.
🏆It has always been that simple.
❤️Good luck with your trading journey, I shall see you at the very top.
🎯Trade consistent, FRGNT X
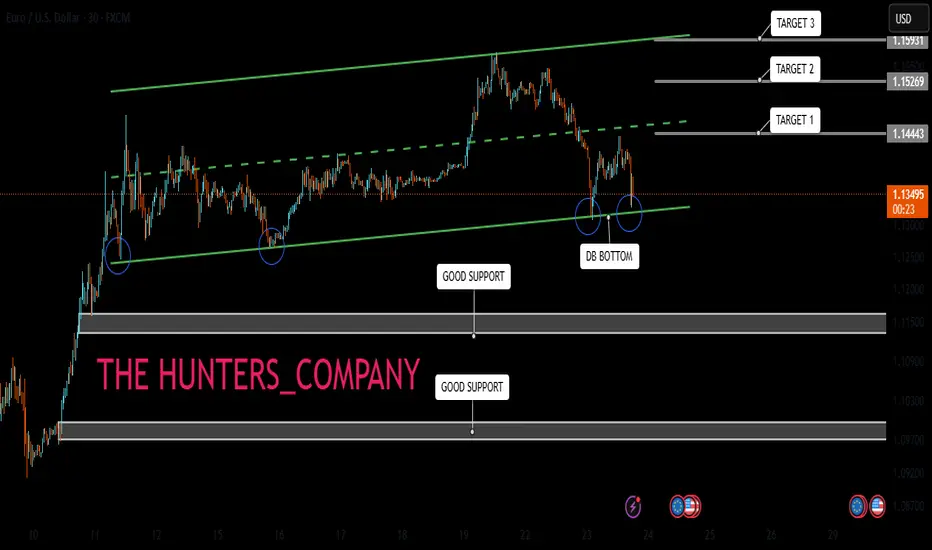
EUR/USD: UPDATEHello friends
Everything is clear on the chart for you, our probability is price growth until the specified areas.
In case of price decline, we have identified two support areas where you can buy.
Be sure to observe risk and capital management.
*Trade safely with us*
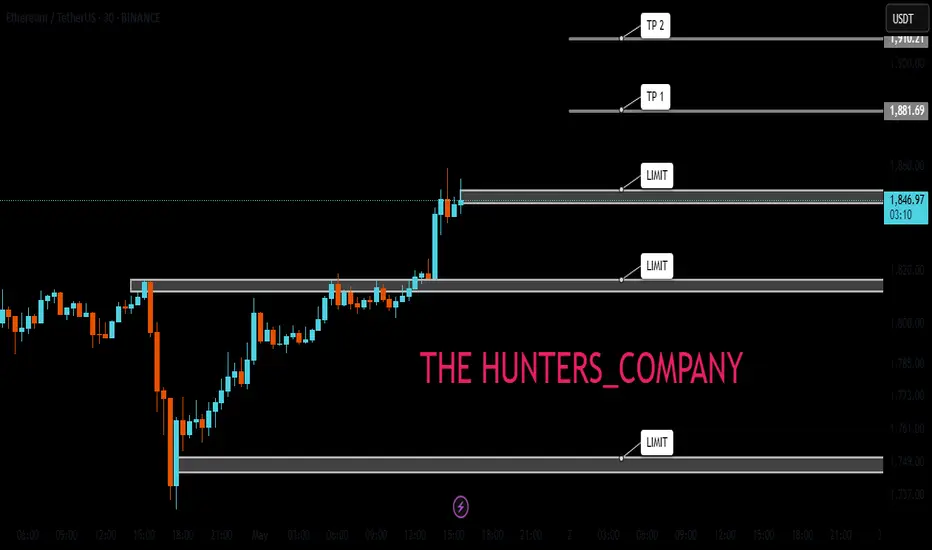
ETH : BUY...Hello friends
Due to the entry of buyers and the breakdown of the trading range, we can buy in the direction of the trend and with capital and risk management within the specified limits and move to the specified targets.
*Trade safely with us*
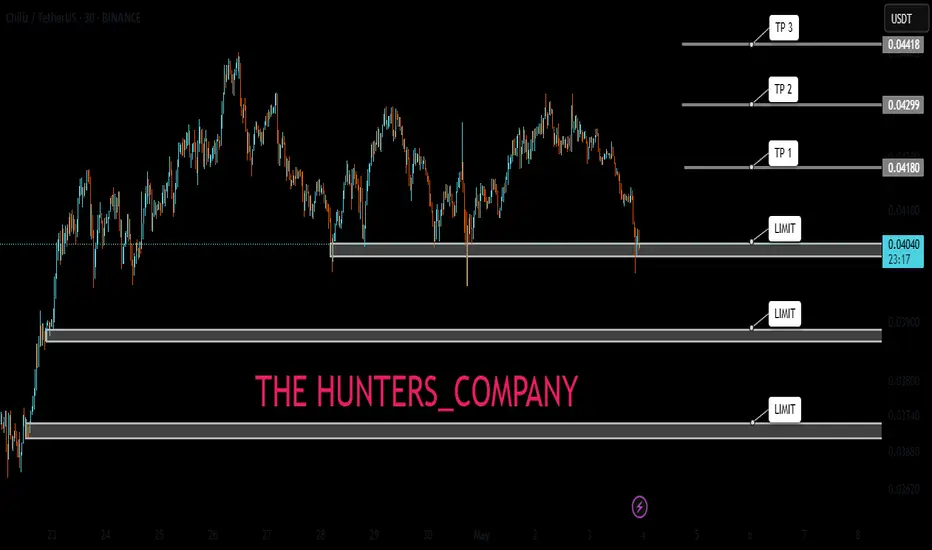
CHZ LIMIT FOR BUY(FREE)Hello friends
Due to the price drop, we can buy on the drop within the specified limits and move with it to the specified targets, of course with capital and risk management.
*Trade safely with us*
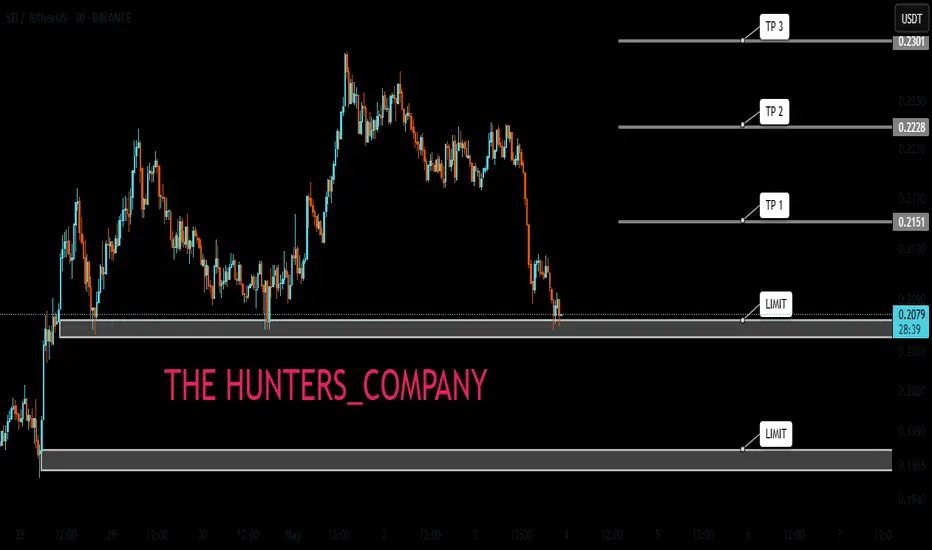
SEI LIMIT FOR BUYHello friends
Due to the price drop, we can buy on the drop within the specified limits and move with it to the specified targets, of course with capital and risk management.
*Trade safely with us*
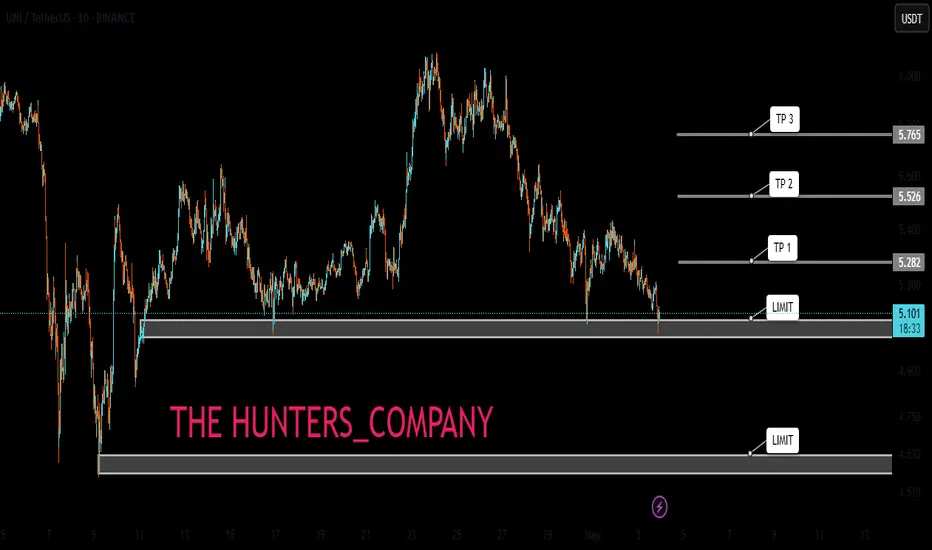
UNI:LIMIT FOR BUY(FREE)Hello friends
Due to the price drop, we can buy on the drop within the specified limits and move with it to the specified targets, of course with capital and risk management.
*Trade safely with us*
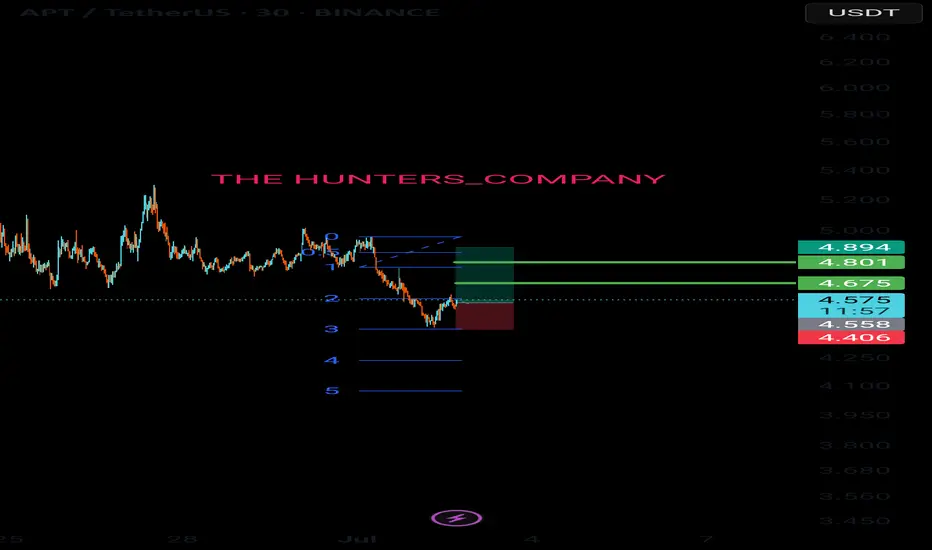
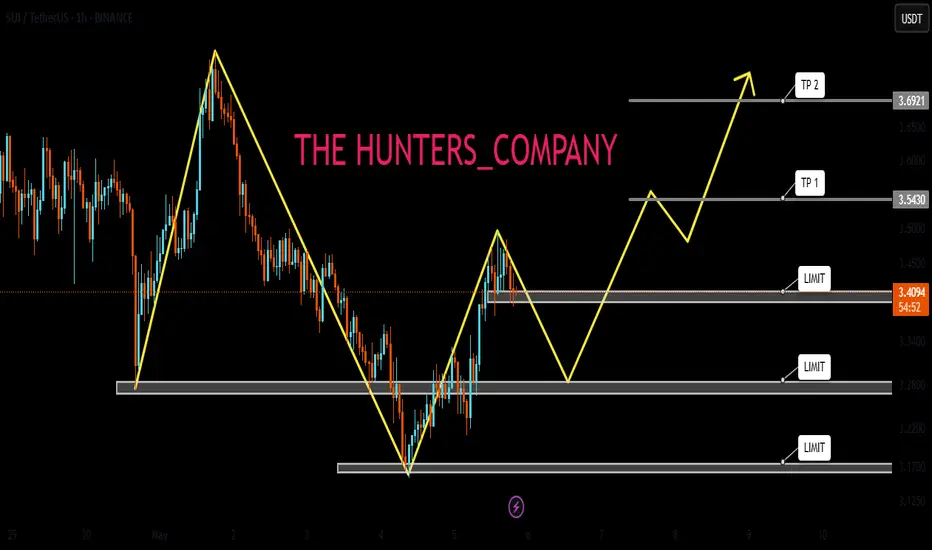
SUI SIGNAL...Hello friends
As you can see, buyers entered the price correction and a reversal pattern is being built...
Due to the buying pressure and the entry of buyers, we can buy within the specified ranges and move towards the set targets, of course with capital and risk management.
*Trade safely with us*
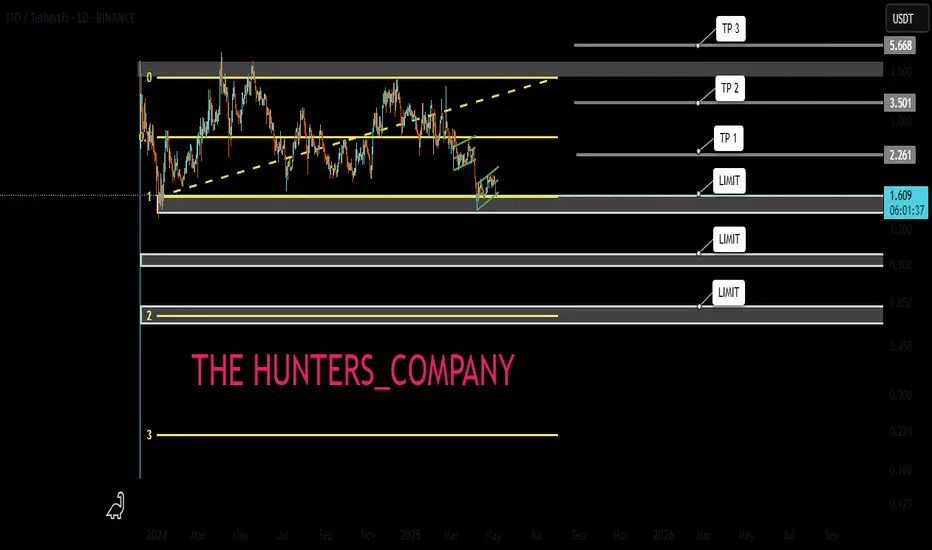
JTO : Price at a critical point: Falling or rising?Hello friends
Given the long-term range that this currency has made, the price has now reached the bottom of the range, which is very sensitive, and this currency also has a token release, which can be a warning.
In case of a drop, we have identified important supports for you, so that you can buy with risk and capital management.
*Trade safely with us*
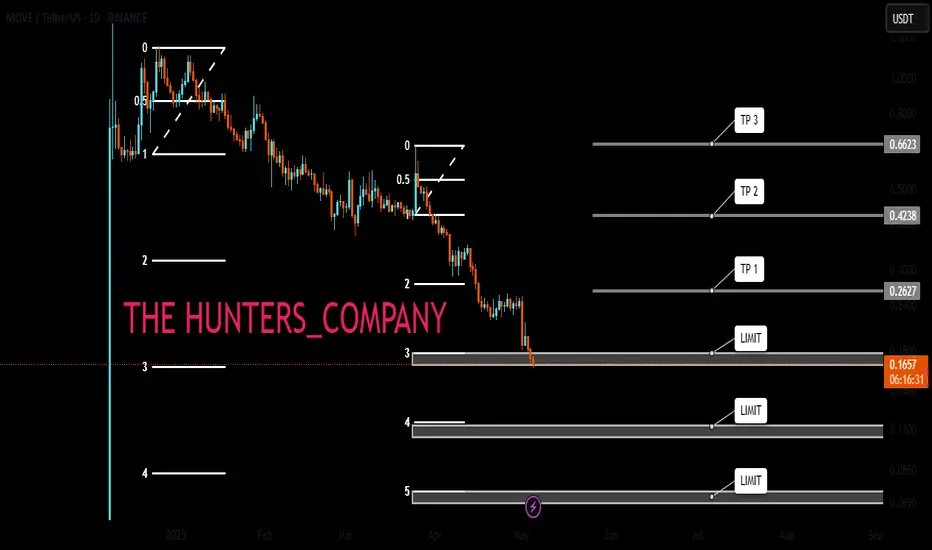
MOVE : Where to buy ?Hello friends
Given the upcoming token release, the price is expected to continue to fall, so be careful.
In case of a fall, we have identified important support levels for you, where you can buy with capital and risk management.
*Trade safely with us*
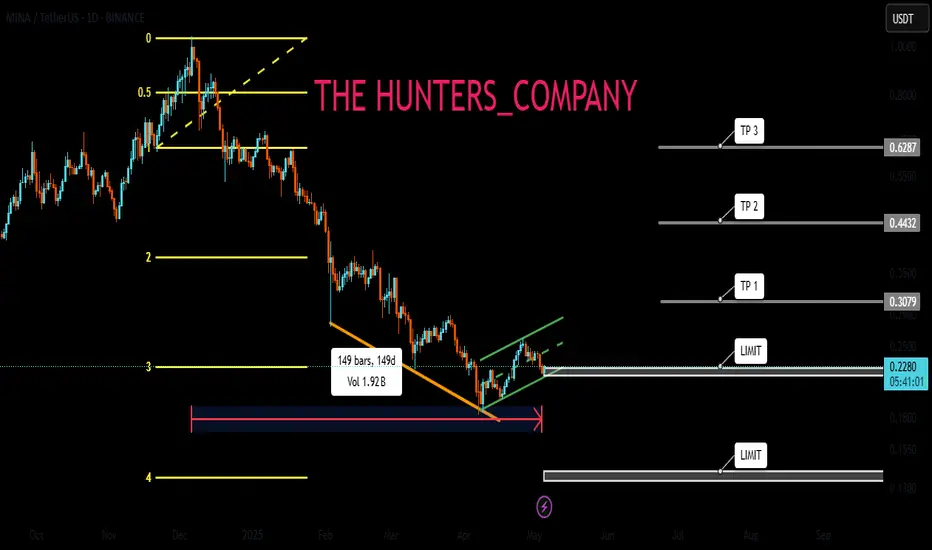
MINA : Is the shedding over ?Hello friends
Given the heavy fall of this and the prolonged price correction, you can now see that the price is supported within the specified support range, which is a good sign...
We have identified important support areas for you, where you can buy in steps and with risk and capital management.
We have also identified targets.
*Trade safely with us*
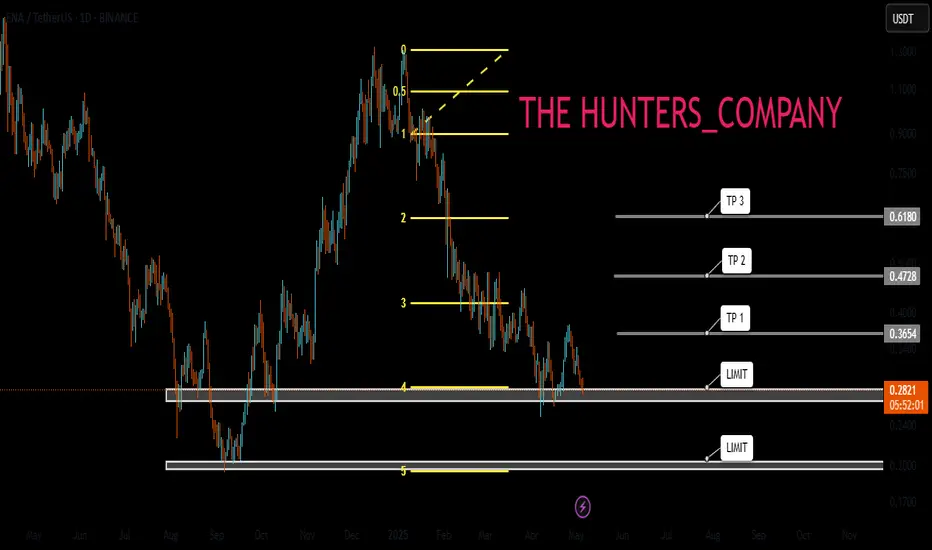
ENA : The largest token release...Hello dears
Given the long-term price decline that we have witnessed, it has now been announced that this currency is going to do a token release, which will naturally cause the price to fall, so be careful.
In case of a fall, we have identified important supports for you so that you can buy with risk and capital management.
The target has also been identified.
*Trade safely with us*
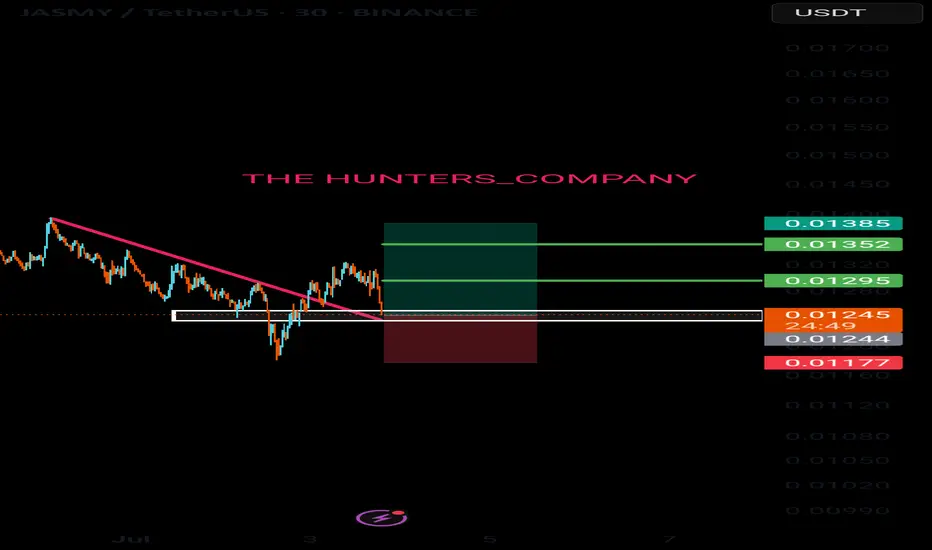
Will suffering be broken today?Hello friends
Given the good price rise, you can see that the price has entered a range, which indicates that it is gathering strength for its next move.
Now we can buy in steps with risk and capital management and move with it to the specified targets.
*Trade safely with us*

Free signal hello friends👋
✅️Due to the price reaching the important weekly back support, the price is expected to grow, so you can enter into the transaction with risk and capital management and move to the specified goals.
🔥Follow us for more signals🔥
*Trade safely with us*
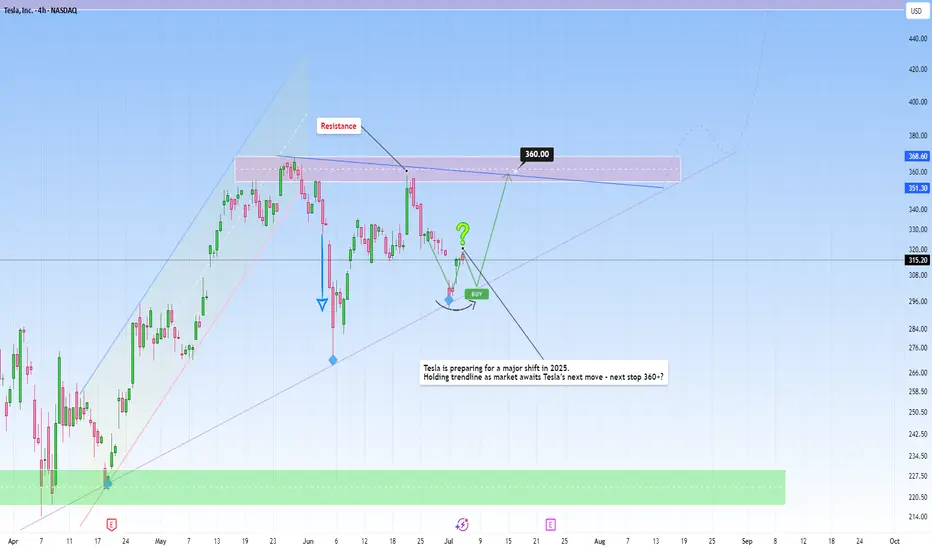
Big Bounce or Breakdown? Tesla at the edgeTesla is at crossroads right now, where the next move will define its near-term trajectory.
After an extended correction phase, TSLA is reaching a key zone around the $300 level, one that held price well during recent pullbacks.
Although recent tax news caused a decline in the price, belief in Tesla’s longer-term trajectory remains strong among many investors.
At the same time, many investors are carefully monitoring the support near $215 to $230, another important zone. This level has acted as a reliable level during past pullbacks, as it suggests the stock has a solid base, despite short-term ups and downs. For these investors, maintaining their positions through consolidation is a test of patience and belief in Tesla’s longer-term trajectory. If Tesla breaks below the $230 support zone, some investors may view this as an opportunity to take advantage once again.
Given the current setup, it’s best to be cautious and wait for confirmation before looking to get involved.
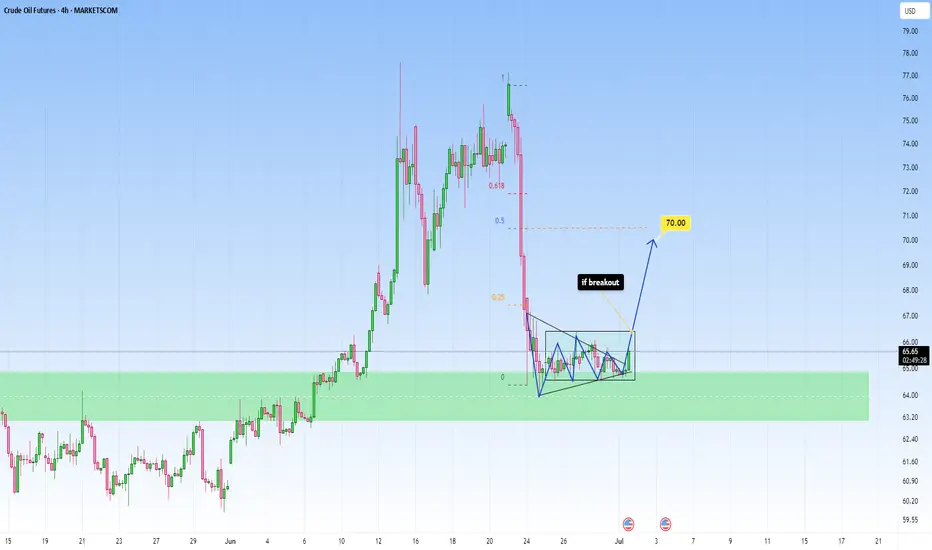
OIL fell sharply, opportunity for upside target of 70$OIL fell sharply and has now been in a contraction for a while, I am taking it into account for a potential breakout, as it shows tightening price action, which reflects market indecision.
Price action has now coiled into a symmetrical triangle, this is often a classic continuation or reversal pattern, and it’s building pressure for a potential breakout. So, if we do get a clean breakout above this pattern, with strong bullish candles, volume, or bullish divergence, that’s your confirmation cue.
This is totally achievable. It aligns beautifully with the 0.25 to 0.5 Fibonacci retracement zone from the recent swing high to low. It’s not just a psychological round number, it’s technically supported.
If the lower boundary of the triangle is broken with momentum, you’ve got to step back. No trade is better than a bad one. Watch how price interacts with the zone. If it loses it, you could be looking at a deeper leg down, potentially revisiting deeper support levels from prior bullish structure.
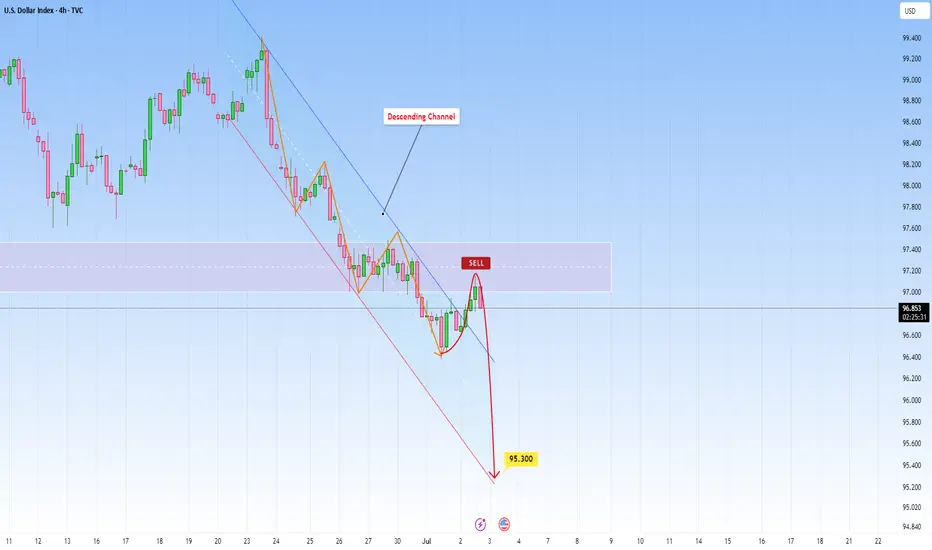
US DOLLAR: Sell opportunity following channel breakPrice on DXY recently broke above a sharp descending channel, but the move lacked presence. There was no real follow-through and certainly no conviction behind the candles. It felt hesitant, as this is a great indication for us to use.
Instead of accelerating upward, price now hovers just above the breakout, this kind of behavior suggests rather a random push than a shift in sentiment. Without the strength to sustain above structure, I think we will see the price come back to the channel's lower border.
And when breakouts fail, they often trap early longs, preparing for a more committed move in the opposite direction.
A rejection from this level could send price into the 0.85800 level.
USDCAD LONG DAILY FORECAST Q3 D4 W27 Y25USDCAD LONG DAILY FORECAST Q3 D4 W27 Y25
Professional Risk Managers👋
Welcome back to another FRGNT chart update📈
Diving into some Forex setups using predominantly higher time frame order blocks alongside confirmation breaks of structure.
Let’s see what price action is telling us today! 👀
💡Here are some trade confluences📝
✅Daily Order block identified
✅4H Order Block identified
✅1H Order Block identified
🔑 Remember, to participate in trading comes always with a degree of risk, therefore as professional risk managers it remains vital that we stick to our risk management plan as well as our trading strategies.
📈The rest, we leave to the balance of probabilities.
💡Fail to plan. Plan to fail.
🏆It has always been that simple.
❤️Good luck with your trading journey, I shall see you at the very top.
🎯Trade consistent, FRGNT X