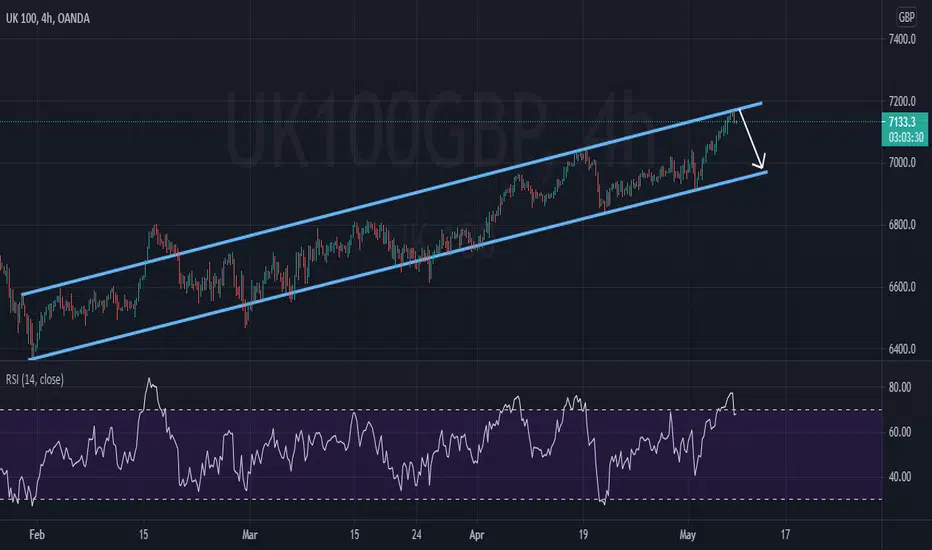
Short-Term SHORT on the cards! RSI overbought & on channel top.UK100 has touched the top of an uptrend channel and has already reversed towards the bottom of this channel around 7000. RSI is in the overbought region too to support this.
Good Luck!
Ftse100
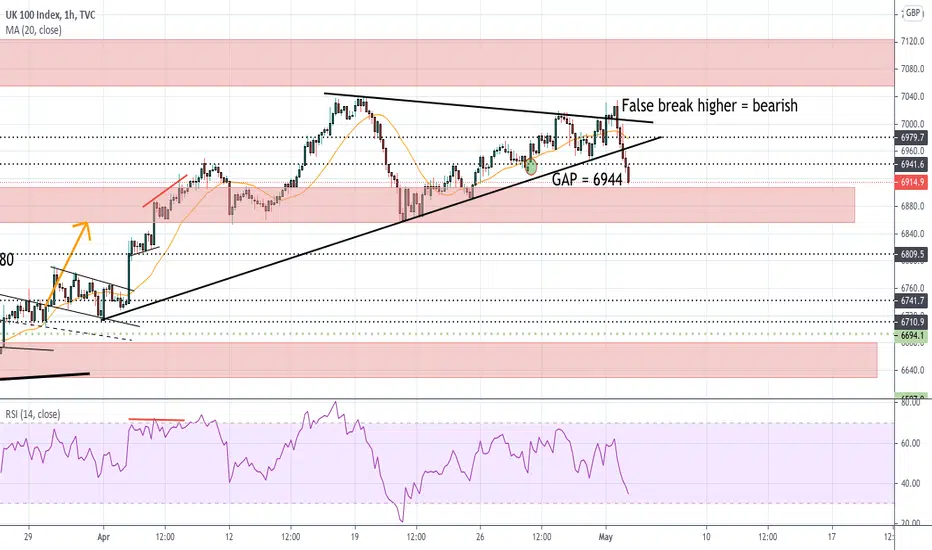
UKX Hourly - Bearish false break higherSuccessful gap close at 6944 following a bearish false break higher. Significant support at 6955, through which we could see 6695 again. I took profit on my shorts at the gap close, but will cautiously start to sell the rallies towards 6980, and add should we break support
UKX Hourly - Decent RR area for a short Re-testing upper resistance - good area for a short (based on assumption first break higher was false) Can continue to add to short if momentum to the downside picks up. SL - prior high (7035). Should we take out 7035, it becomes a false break lower and the picture will turn bullish

UKX Hourly - Bizarre spike lower quickly bought Spikes on no news in either direction always make me feel uncomfortable. Even when quickly reversed I find they tend to return to their initial reaction. Therefore shorting with stops at today's high. Watch the gap at 6944
Nasdaq Diaries May Market Review In this video, I share some of our sentiments on the direction we speculate the indices to take for the month of May.
Nasdaq100
Ftse100
Nikkei225
Dax30
If you wish to learn how to trade stocks or indices you may DM me for more information.
Comment, like and follow.
Thanks for the support
Namaste

UKX Hourly - Coiling.. waiting for break to confirm directionWaiting for a break to confirm direction
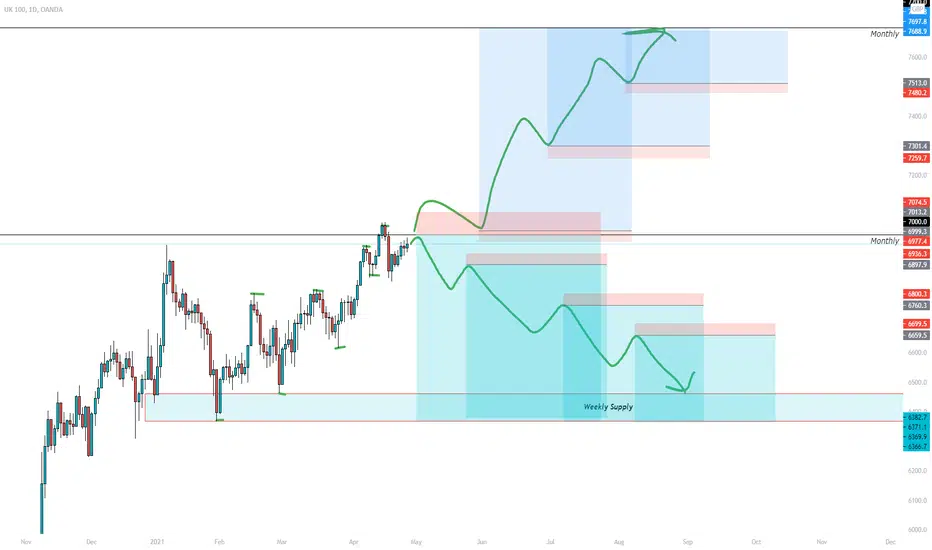
FTSE100 Possible sell and buy setups with entrys.Good evening all, I am overall forecasting a bull move coming in for the FTSE 100 shortly... this is due to price failing to maintain the HH HL price action.
HOWEVER....
We all know we trade what the market gives us which is why I always have multiple entry's for both bullish and bearish should price decide to go against my forecast. Now, every entry you see is based upon a key level, they are not just placed in random places...
Of course guys this goes without saying but this is just for educational purposes and copy this trade at YOUR OWN RISK.
Remember never risk more than 1% and aim for at least a 2:1 RR.
Good luck for the rest of the month guys and I am also open to hear you guys forecast for the week ahead.
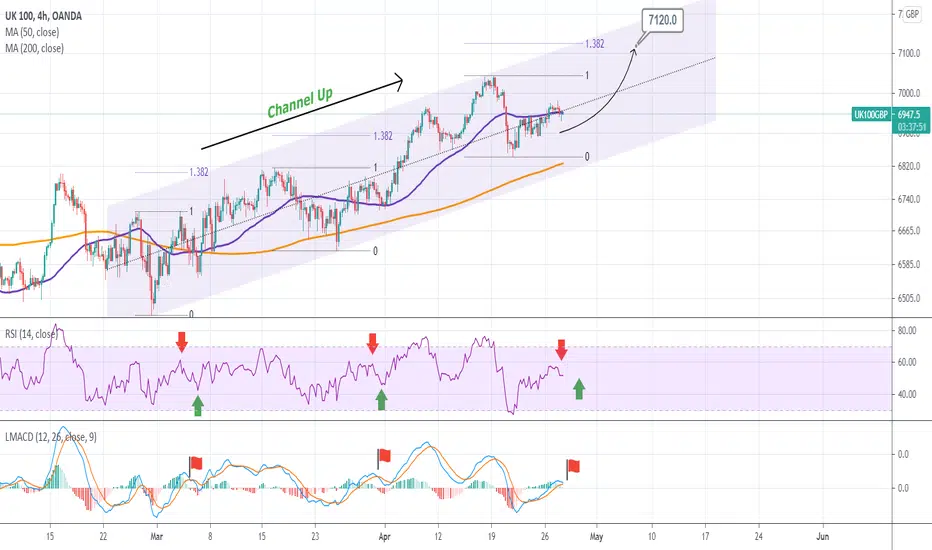
FTSE100 Buy SignalPattern: Channel Up on 4H.
Signal: Buy as the price is rising following a (near) Higher Low on the pattern.
Target: 7120 (the 1.382 Fibonacci extension).
** Please support this idea with your likes and comments, it is the best way to keep it relevant and support me. **
--------------------------------------------------------------------------------------------------------
!! Donations via TradingView coins also help me a great deal at posting more free trading content and signals here !!
🎉 👍 Shout-out to TradingShot's 💰 top TradingView Coin donor 💰 this week ==> z_hq
--------------------------------------------------------------------------------------------------------
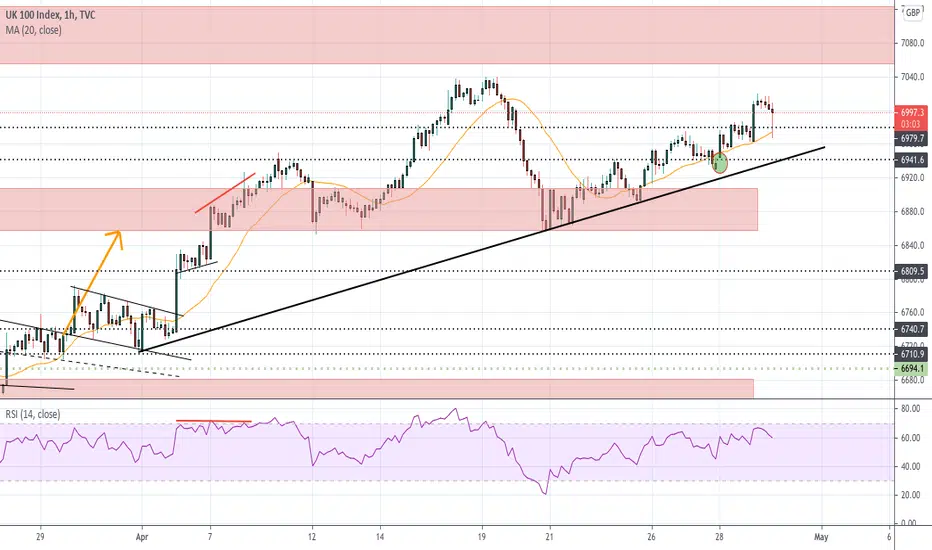
UKX Hourly - Higher high following successful bounce off supportHigher highs and higher lows are in place following a successful bounce off lateral support. Still favouring a long bias with a full target of 7050ish and SL of 6890. I am expecting some resistance around 6965 (NB NB) - I will be monitoring closely for any potential reversal. Through this crucial point, one can look to add to their longs, but a reversal here will see me swing to a short position. Updates to follow as we progress
FTSE100 Can Go Higher After Correcting from 7K - Important LevelTraders, UK100 (FTSE 100) has been one of the best indices to trade in recent weeks and months as it has given us several opportunities both long and short side. But the bias has always been towards the long for path few months. Now that it has hit 7000 level, it has started to show some correction and this can continue to fdew lower levels as shown in the chart but ultimately a breakout above 7K can lead us into the next FCP zone. A full video analysis is available on the channel. Find the link to the channel below.
Rules:
1. Never trade too much
2. Never trade without a confirmation
3. Never rely on signals, do your own analysis and research too
✅ If you found this idea useful, hit the like button, subscribe and share it in other trading forums.
✅ Follow me for future ideas, trade set ups and the updates of this analysis
✅ Don't hesitate to share your ideas, comments, opinions and questions.
Take care and trade well
-Vik
____________________________________________________
📌 DISCLAIMER
The content on this analysis is subject to change at any time without notice, and is provided for the sole purpose of education only.
Not a financial advice or signal. Please make your own independent investment decisions.
____________________________________________________

UKX Hourly - Decent RR for a bounce O/S RSI and lateral support = decent RR. Target = 6950 area with trailing stop

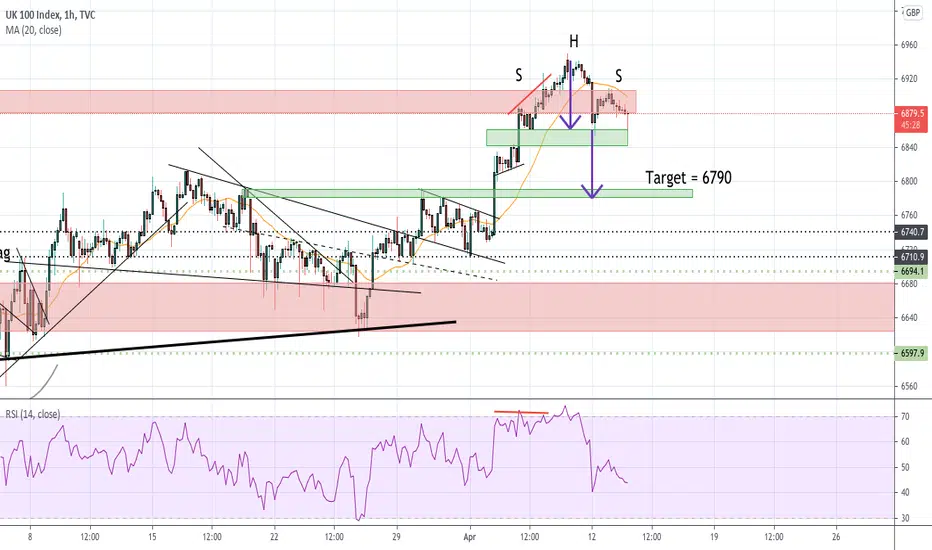
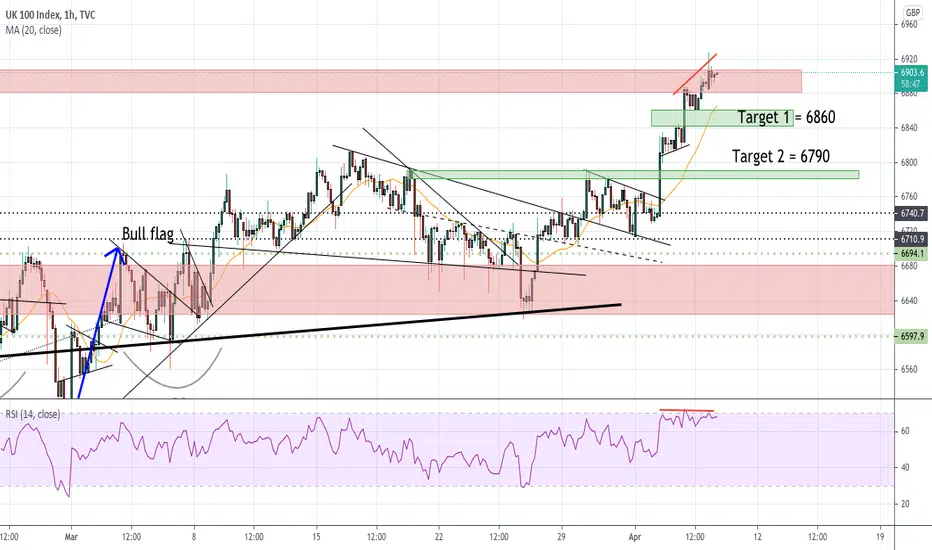
UKX Hourly - Bearish H&S confirmed below 6860Buyers stepped in again at 6860, but this level is less likely to hold next time round. H&S will be confirmed with an hourly close below 6860. I've been bearish last couple of days and am already short - target = 6790
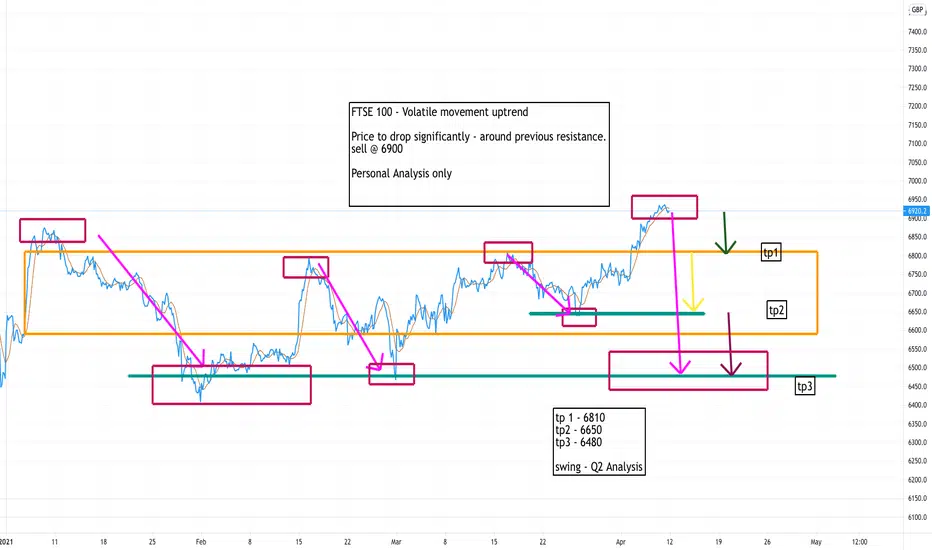
ftse q2 prediction Personal analysis
ftse 100 - Volatile movements uptrend potential to reverse.
short at 6900
tp 1 - 6810
tp2 - 6650
tp3 - 6480
swing - Q2 Analysis
Willows
2 Possible Longs FTSE100 UK100Longterm hold small lot size - holding for the next 2-3 weeks as the UK starts to reopen i see growth! As always move SL as you secure a good amount of profit.
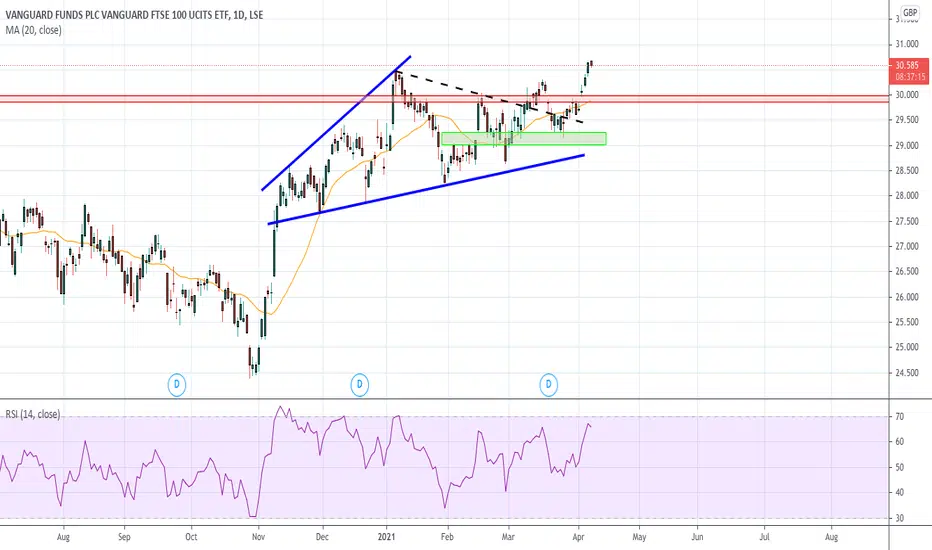
VUKE Daily - trimmed back to u/weight waiting for better levelsI had used the green accumulation zone to add to my positions - after a successful run I have taken profit on the majority of holdings leaving me net underweight. I am hoping for a dip back to the red zone where I will look to start re-entering.
$UKX Hourly - Decent RR for small short Reversed off overhead resistance & RSI overbought + divergence. Trend up, but worth a small tactical short at these levels. SL = 6930
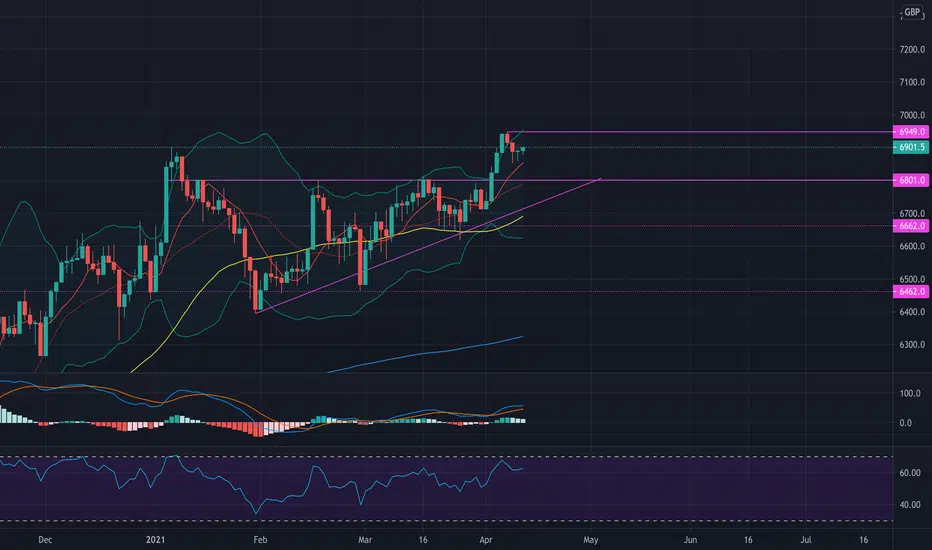
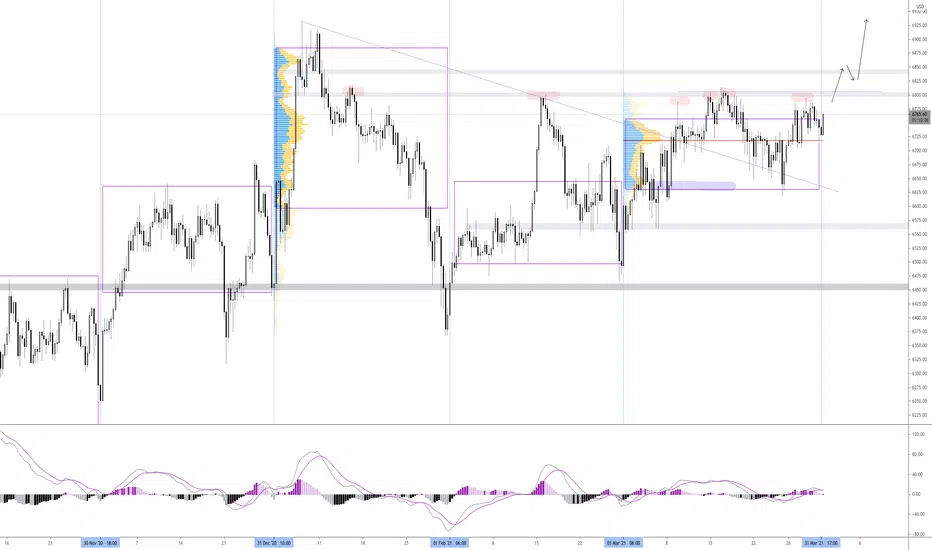
Will FTSE 100 finally breakout??!?!With a start of a new quarter..keep an eye on the FTSE 100.
Price has been consolidating since the start of the year, trading inside value for '21.
After selling off early in the year, price is back retesting 6800 yet again. A break above would be a very bullish signal, with continuation towards yearly highs a good possibility.
We are currently opening near last months VAH & POC, so should show its hand soon.
Watch and see how it plays out.
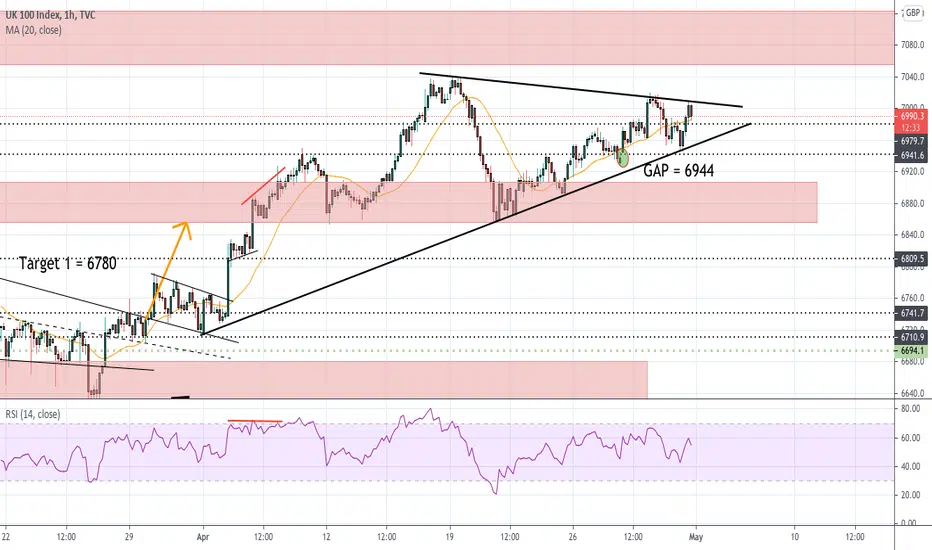
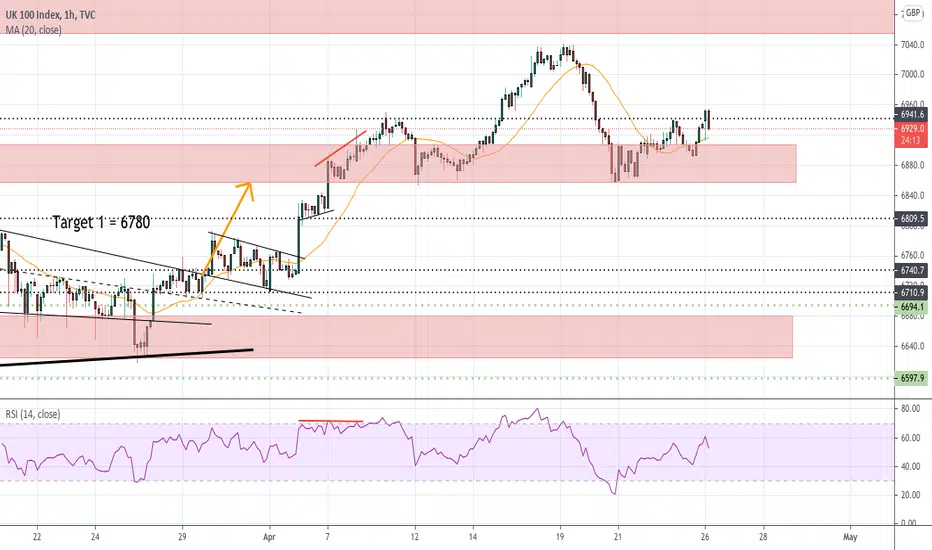
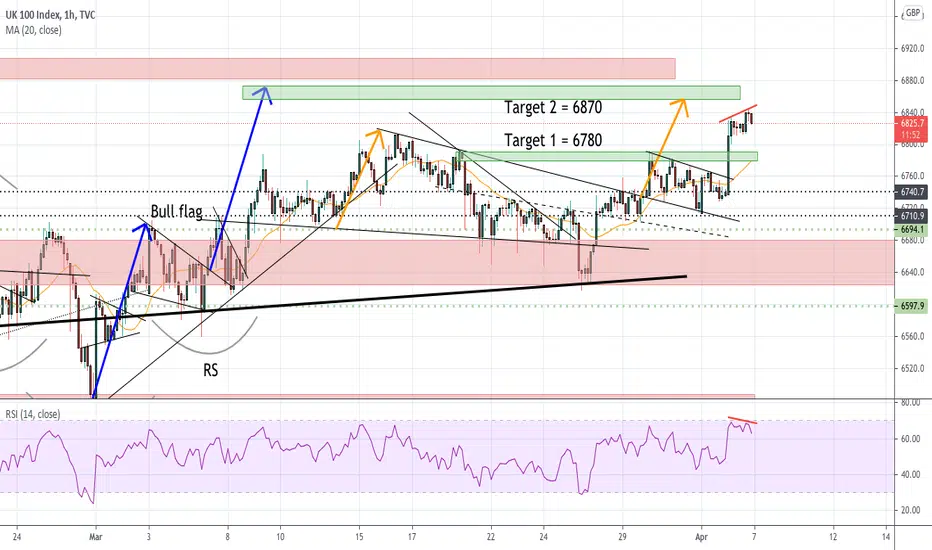
$UKX Hourly - Re-testing break out levelGood place to re-enter new longs after taking partial profit at target 1 (6780)

$UKX Hourly - Possible consolidation before final push higherMinor bearish RSI divergence has appeared on the hourly. Trend is still clearly up and full target of 6870 BUT momentum appears to be slowing. Taking some profit here on my longs and will look to add on a test of the green zone at 6780/6790.
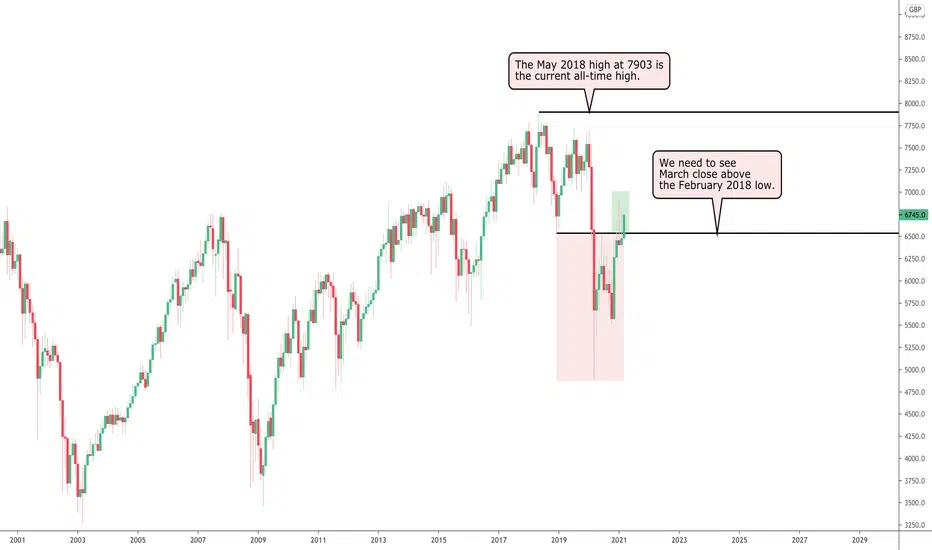
FTSE 100 Edging Towards 7000The FTSE 100 has failed to break and close above the February 2018 low at 6536 for a number of months now.
You can see the December 2020 candle and the candles for January and February 2021 traded above this level
but ended the month by closing below this level.
With one more trading day of the month left to go, we may well finally see that close above 6536 and if this
is achieved then we should continue to see bullish moves in UK stocks.
Although the move up has been rather sluggish, price has gained good ground following the 22% decline we
experienced in February and March 2020 at the peak of the global pandemic. In March 2020 price continued
down and found support around the 5000 round number before moving back to the upside.
With a bullish end to this month’s candle, the next level of resistance is 7000 and following that we have
the all-time high at 7903, which is the May 2018 high. We will be able to get a better perspective of price
action once the candle for March closes and decide on which opportunities we want to take positions in.
See below for more information on our trading techniques.
As always, keep it simple, keep it Sublime.
$UKX Hourly - First target reachedFirst target reached this morning on the gap closure at 6780. RSI starting to head to overbought territory. Hoping to see a bit of consolidation before next push higher

$UKX Hourly - Backtesting channel break We are currently testing Friday's channel break. Good RR levels to go long for those who currently don't have a position. Nice gap at 6780 I would like to see filled, as well as the full target of the bull flag and inverse H&S of 6870. We have seen some month end selling during the previous few months which is something to keep an eye on and more reason to keep stops tighter. On the other hand, this month may be different given it is tax year end in the UK. Summary: Long with a tight stop
