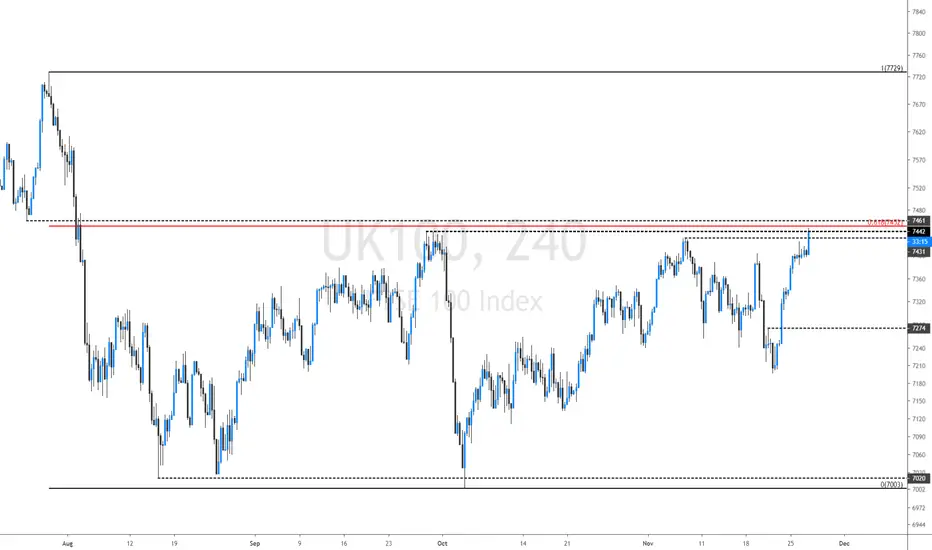
FTSE 100 - Can it clear the cluster of resistance?We look to Sell at 7445
Bespoke resistance is located at 7445
Positive overnight flows lead to an expectation of a firm open this morning
We have a 61.8% Fibonacci pullback level of 7432 from 7729 to 7003
Although the anticipated move lower is corrective, it does offer ample risk/reward today
Expect trading to remain mixed and volatile
Stop: 7485
Target 1: 7275
Target 2: 7205
Ftse100
Ferguson - Turning up the heatBuy Ferguson (FERG.L)
Ferguson PLC is a distributor of plumbing and heating products. The Company operates through seven business units: Blended Branches, Waterworks standalone, HVAC standalone, Industrial standalone, Fire and Fabrication, Facilities Supply standalone and B2C e-commerce.
Market Cap: £15.35Billion
Ferguson is trading in a bullish long term channel. The shares are trading just below all time high and there is no sign of the momentum slowing. The small corrective move lower in recent days has attracted buying interest and a move to new highs is expected.
Stop: 6545p
Target 1: 7200p
Target 2: 7600p
Target 3: 8000p
Interested in UK Stocks?
Join our free Telegram channel for up to date analysis on the best main market opportunities in the UK right now - t.me

BT - Dialling upBuy BT Group (BT.A.L)
BT Group plc is a communications services company. The Company is engaged in selling fixed-voice services, broadband, mobile and television products and services, as well as various communications services ranging from phone and broadband to managed networked information technology (IT) solutions and cyber security protection.
Market Cap: £18.96Billion
BT has broken out of a channel pattern on the daily chart. The breakout move has retraced 50% of the impulsive move higher and retested the broken channel. The shares appear to be stabilising around 185p, while the Conservatives remain in the lead in the opinion polls then the shares could continue higher in relief of avoiding the threat of part nationalisation from a Labour Government.
Stop: 181.6p
Target 1: 212p
Target 2: 230p
Target 3: 265p
Interested in UK Stocks?
Join our free Telegram channel for up to date analysis on the best main market opportunities in the UK right now - t.me

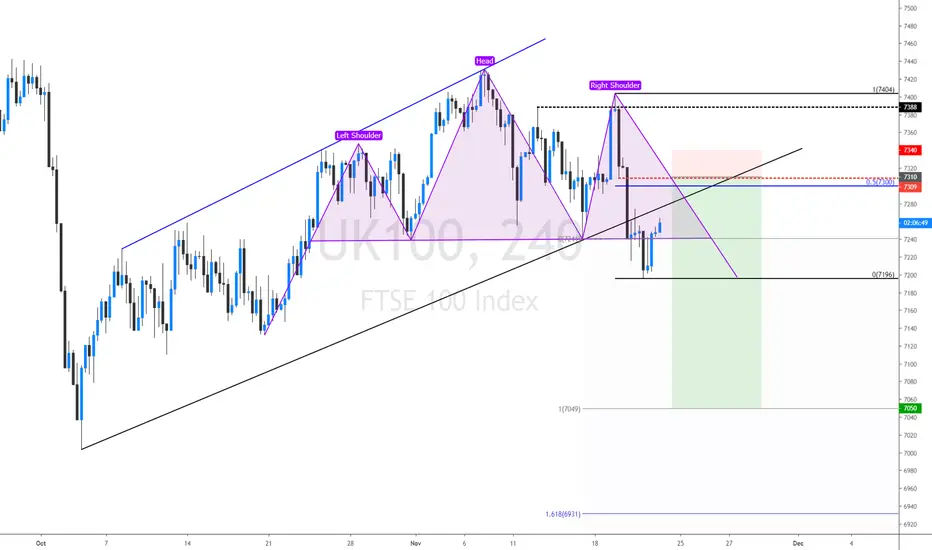
FTSE 100 - Possible sequence of lower highs.We look to Sell at 7380
Trading has been mixed and volatile.
The trend of lower highs is located at 7382.
Positive overnight flows lead to an expectation of a firm open this morning.
Preferred trade is to sell into rallies.
Expect trading to remain mixed and volatile.
Stop: 7415
Target 1:7275
Target 2: 7200

FTSE 100 - Selling ralliesTrade Idea
Broken out of the channel formation to the downside.
Continued downward momentum from 7404 resulted in the pair posting net daily losses yesterday.
Negative overnight flows lead to an expectation of a weaker open this morning.
Further downside is expected although we prefer to set shorts at our bespoke resistance levels at 7310, resulting in improved risk/reward.
Expect trading to remain mixed and volatile.
We look to Sell at 7310
Stop: 7355
Target 1; 7095
Target 2: 7005
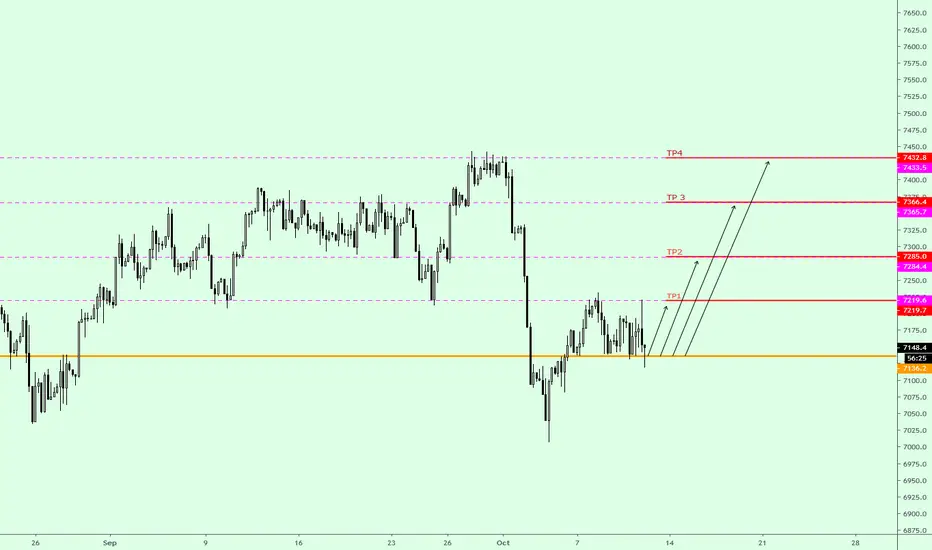
FTSE morning fallLast time FTSE do the same pattern fall fairly down , I suggest it will do the same pattern.

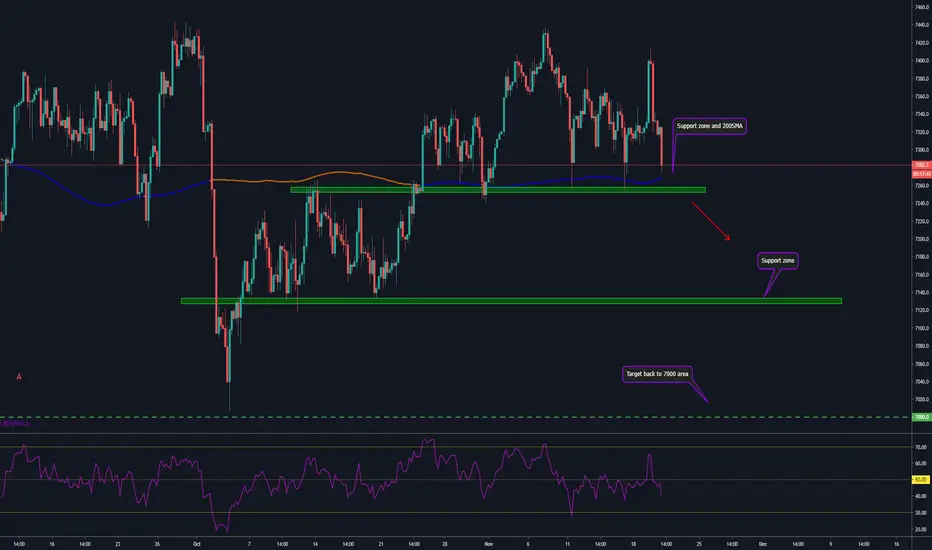
FTSE trade updateAfter yesterday's news from USA, that they back Hong Kong's bill, China said they will retaliate if it becomes a law. Tensions arise and we are back in risk off mood.
Now approaching big support soon and 200SMA. A break lower for a short. A bounce of support before continuation may offer earlier entry with better risk-reward.
Good Luck!
Bellway - Building momentumBuy Bellway (BWY.L)
Bellway plc is a major UK residential property developer based in Newcastle upon Tyne. It is listed on the London Stock Exchange and is a constituent of the FTSE 250 Index.
Market Cap: £3.9Billion
The medium-term trend is bullish on Bellway. The shares have corrected lower in recent weeks and appears to have found some support at 3125p. There was strong move higher in yesterday’s session and further upside towards resistance at 3710p is expected in the short term.
Stop: 3078p
Target 1: 3600p
Target 2: 3710p
Target 3: 3800p
Interested in UK Stocks?
Join our free Telegram channel for up to date analysis on the best main market opportunities in the UK right now - t.me

easyJet - Ready to take off again?Buy EasyJet (EZJ.L)
easyJet plc is a United Kingdom-based low-cost airline carrier. The Company operates as a low-cost European point-to-point short-haul airline. The Company operates through its route network segment. The Company operates on over 820 routes across more than 30 countries with its fleet of over 250 Airbus aircrafts.
Market Cap: £4.77Billion
Having completed a large inverse head and shoulders bottom in the middle of September the shares have been on a great run. The recent spike to highs of 1330p was met with some profit-taking. The correction lower has been quite shallow, and the price now appears to have broken higher from a pennant pattern. This is considered a continuation pattern and therefore the expectation is for further upside in the short to medium term.
Stop: 1171p
Target 1: 1383p
Target 2: 1505p
Target 3: 1600p
Interested in UK Stocks?
Join our free Telegram channel for up to date analysis on the best main market opportunities in the UK right now - t.me

United Utilities - Something in the water?Buy United Utilities (UU.L)
United Utilities Group plc, the United Kingdom's largest listed water company, was founded in 1995 as a result of the merger of North West Water and NORWEB. The group manages the regulated water and wastewater network in North West England, which includes Cumbria, Cheshire, Greater Manchester, Lancashire and Merseyside, which have a combined population of nearly seven million.
Market Cap: £5.8Billion
United Utilities has broken out of a bearish channel with an impulsive move higher. The correction lower in recent days has been limited and buyers appear to be emerging once again. A flag formation may be taking shape which would suggest a continuation higher over the short term. The ultimate target is for a move to 1065p, which is a previous high dating back to May 2017. It’s also a nice one for income investors with a dividend yield of 4.74%.
Stop: 816p
Target 1: 940p
Target 2: 1000p
Target 3: 1065p
Interested in UK Stocks?
Join our free Telegram channel for up to date analysis on the best main market opportunities in the UK right now - t.me

Rentokil - Time to catch some gains?Buy Rentokil Initial (RTO.L)
Rentokil Initial plc provides fully integrated facilities management and essential support services to government and commercial sector organization all sizes across all business sectors. The Company provides services in pest control, hygiene, workwear, facilities and plants.
Market Cap: £8.17Billion
Rentokil is trading in an exceptional long-term uptrend. The shares have once again bounced from the trend support line and this typically proceeds a move to new highs. If the trend is to continue, then its an ideal entry level. A break below 430p would invalidate the idea.
Stop: 430p
Target 1: 500p
Target 2: 530p
Target 3: 550p
Interested in UK Stocks?
Join our free Telegram channel for up to date analysis on the best main market opportunities in the UK right now - t.me

Hikma Pharmaceuticals - Injecting some bullish momentum.Buy Hikma Pharmaceuticals (HIK.L)
Hikma Pharmaceuticals PLC develops, manufactures, and markets pharmaceutical products. The Company offers branded and non-branded generic and in-licensed pharmaceutical products. Hikma Pharmaceuticals serves customers worldwide.
Market Cap: £4.79Billion
The long-term trend on Hikma remains bullish. The corrective move lower in recent weeks has found some support at the 38.2% Fibonacci level. The posting of a bullish engulfing candle while simultaneously breaking from a wedge pattern is bullish for short term sentiment. Further upside is expected from here, targeting the previous highs at 2345p from 15th March 2017.
Stop: 1920p
Target 1: 2210p
Target 2: 2345p
Target 3: 2400p
Interested in UK Stocks?
Join our free Telegram channel for up to date analysis on the best main market opportunities in the UK right now - t.me

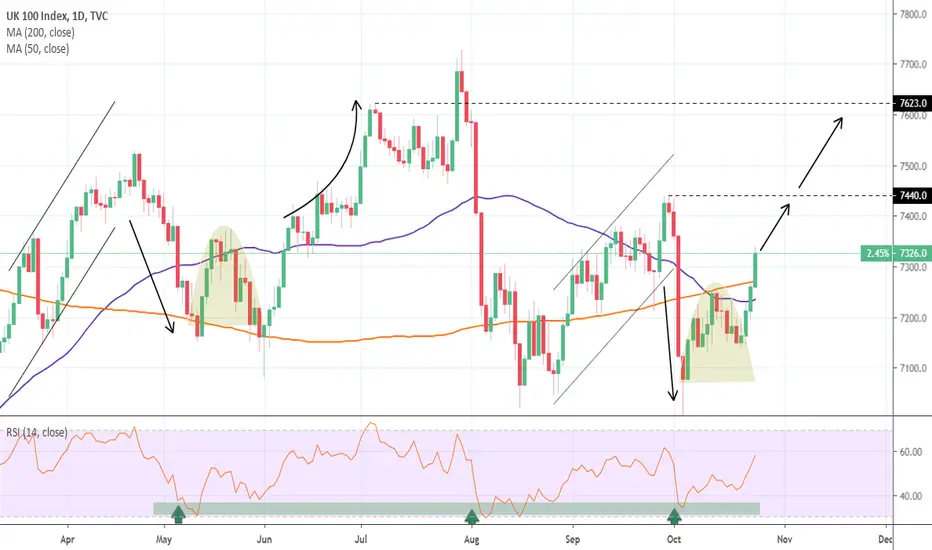
FTSE100: Double Buy Target.The index has broken above both the 1D MA50 and MA200 this week and 1D turned bullish (RSI = 57.795, MACD = 3.690, Highs/Lows = 85.3366) towards the 7,440 Resistance. It appears to be repeating the April - July sequence, currently being at the start of the final (and most aggressive) bullish leg. The obvious short term target is the 7,440 Resistance but in our opinion, and with the 1D RSI potential, if the 1D candle that breaks the Resistance closes above that level, we can extend the uptrend as high as 7,620.
** If you like our free content follow our profile (tradingview.sweetlogin.com) to get more daily ideas. **
Comments and likes are greatly appreciated.
Compass Group - Buying the dip to the long term trend line.Buy Compass Group (CPG.L)
Compass Group PLC provides food and support services. The Company's segments include North America, Europe, Rest of World and Central activities. The Europe segment includes Turkey and Russia. The Rest of World segment includes Japan. The Company delivers services in sectors, including business and industry; healthcare and seniors; education; defense, offshore and remote, and sports and leisure.
Market Cap: £31.19Billion
Compass is trading in a fantastic long-term uptrend and this is showing no signs of stopping. The latest correction appears to have found some buying support at the long-term trend line. We expect the shares to rally towards the upper end of the corrective channel before eventually breaking higher towards new highs.
Stop: 1890p
Target 1: 2050p
Target 2: 2145p
Target 3: 2250p
Interested in UK Stocks?
Join our free Telegram channel for up to date analysis on the best main market opportunities in the UK right now - t.me

AstraZeneca - Breaking from a wedgeBuy AstraZeneca (AZN.L)
AstraZeneca PLC (AstraZeneca) is a biopharmaceutical company. The Company focuses on discovery and development of products, which are then manufactured, marketed and sold. The Company focuses on three main therapy areas: Oncology, Cardiovascular & Metabolic Disease (CVMD) and Respiratory, while selectively pursuing therapies in Autoimmunity, Infection and Neuroscience.
Market Cap: £90.48Billion
AstraZeneca is breaking higher from a corrective wedge pattern on the daily chart. The long-term uptrend remains bullish and a move towards new highs is expected.
Stop: 6565p
Target 1: 7465p
Target 2: 7580p
Target 3: 8000p
Interested in UK Stocks?
Join our free Telegram channel for up to date analysis on the best main market opportunities in the UK right now - t.me

RBS - Set to correct lower?Sell RBS (RBS.L)
The Royal Bank of Scotland Group plc (RBS) is a banking and financial services company. The Company provides a range of products and services to personal, commercial, corporate and institutional customers, through its subsidiaries, The Royal Bank of Scotland plc and National Westminster Bank Plc (NatWest), as well as through other brands, including Ulster Bank and Coutts.
Market Cap: £29.13Billion
RBS appears overdone in the very short term. The shares have benefitted significantly form the rally in GBP over recent weeks with a 30%+ rally from the October lows. The shares have rallied into an unfilled gap at 247.4p, which was created on the 26th April 2019. This also corresponds with a 78.6% Fibonacci retracement level from the highs at 266.1p on the 17th April to the lows at 176.6p on 15th August 2019. The looks to be a reasonable level to take some short-term profit or initiate some speculative selling. The bearish looking candle on the daily chart adds further weight to the bearish argument.
Stop: 250.5p
Target 1: 232p
Target 2: 217p
Target 2: 197p
Interested in UK Stocks?
Join our free Telegram channel for up to date analysis on the best main market opportunities in the UK right now - t.me

NMC Health - One to watchBuy NMC Health (NMC.L)
NMC Health plc is a private healthcare services provider in the United Arab Emirates. The Company operates through two segments: healthcare and distribution & services. The healthcare segment is engaged in providing professional medical services, comprising diagnostic services, in and outpatient clinics, provision of all types of research and medical services in the field of gynecology, obstetrics and human reproduction and retailing of pharmaceutical goods. It also includes the provision of management services in respect of a hospital.
Market Cap: £5.68Billion
NMC Health appears to be forming a bottom pattern on the daily chart. A break above resistance at 3016p is required to complete the pattern, which as this stage is still in the ‘one to watch’ category. The completion of an inverse head and shoulders bottom pattern targets a move to 4325p over the short to medium term. Investors with a more speculative nature could buy at current levels to improve the upside potential. The idea would be invalidated on a move below 2420p.
Stop: 2420p
Target 1: 3015p
Target 2: 3760p
Target 2: 4325p
Interested in UK Stocks?
Join our free Telegram channel for up to date analysis on the best main market opportunities in the UK right now - t.me

Brexit Catalyst for Equity Trade?Before I get into the trade idea, I need to preface that I still believe that US equities will be going higher in the longer term. Not really for any fundamental reasons, but more so that the world is in a bad place and the US looks the best, albeit having a lot of problems. Martin Armstrong calls the US and the US Dollar the prettiest sister out of the three ugly sisters.
Also, there will be nowhere to go for yield. We know QE (or QE but not calling it QE is coming) and interest rates will be dropping to 0 because central banks are out of options. Check out my posts linked below where I talk about all these things...predictions are coming true and we are truly in the reset/crisis.
With rates at 0, we are at the 'paradigm shift' environment that Ray Dalio has spoken about. Bonds are now being traded not for yield but to sell to another bigger fool. Real Estate historically goes up once the first rate hike occurs. You do not take a mortgage out when you know rates will be dropping lower later.
Stocks will be the only place for yield and not only that, the liquidity in this type of macro environment will be appealing. You can get in and get out relatively quickly.
So onto the short TRADE idea. Markets are still being affected by geopolitical and other uncertainties. This will affect equities in the short term, but again, as a fund manager money has to be deployed. You cannot hold cash for a long time. This money will go to work and I predict it will go into stocks for the yield factor described above.
We found out today at time of writing this idea that Brexit will be delayed until January.
I have mentioned how Brexit will likely not happen. It will keep getting delayed and we may very well see a re-vote. There are 3 reasons why Brexit will likely not happen:
1) The British politicians who are part of the European Parliament lose their 6 figure jobs and pensions. Not in their best interest to leave.
2) There will be a European economic/debt crisis. The German taxpayer will not be able to bail out Europe all by themselves. The British tax payer will be required to help.
3) Most importantly, Brexit sets a precedent. European nations like Greece, Spain, Italy and Portugal may get inspired by a deal.
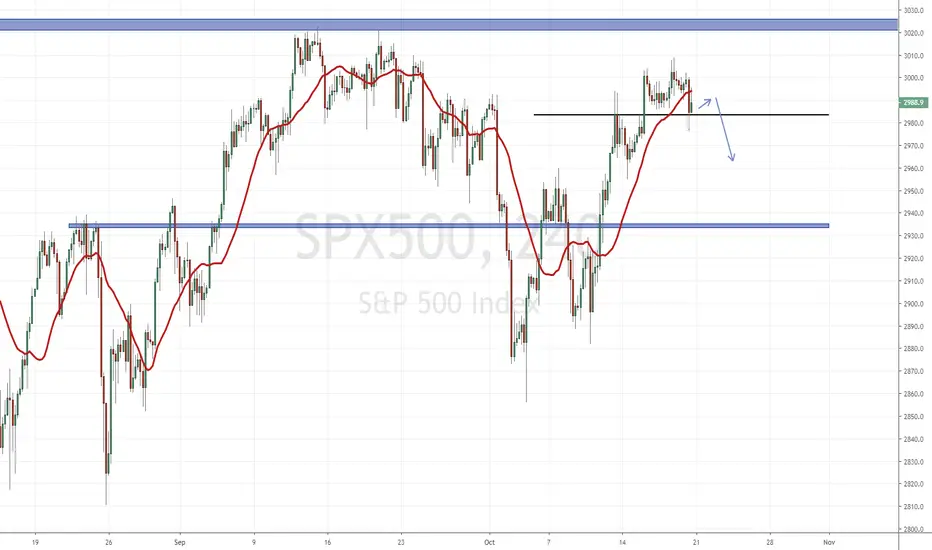
Anyhow, the charts are setting up nicely for a move lower. We have been in an uptrend, with higher highs and higher lows, and then price began to stall at a resistance/flip zone or in some cases near all time highs.
For the SPX, we are seeing an exhaustion it appears. Would ideally like to see a break below this flip zone with a pattern like a head and shoulders.
The Nasdaq already had the break. Would like to see a retest with a confirmed lower high and lower low. Nice strong break.
The Nikkei is showing signs of a trend exhaustion here. Need to see if we get the break.
The China 50 already had the break. Awaiting for another swing (lower high).
The German Dax is at a crucial resistance/flip zone that you can see on the daily chart. Showing signs of exhaustion and potential reversal here.
We should cover the FTSE as well, but honestly, no real good pattern/set up for me on the lower time frames. The Daily still has a crucial level below.
Persimmon - Looks set to re-build its share price.Technicals
Persimmon is holding at key support and showing signs of attracting value hunters. I also note the bullish divergence on the relative ratio (Persimmon share price / UKX). The price of sterling has been a drag on the shares and with GBP moving higher yesterday it could offer some relief to domestic stocks. Technically and fundamentally, Persimmon looks good value here.
Fundamentals
Persimmon currently ranks towards the top of our fundamental model with exceptional scores on value, profitability, momentum and quality metrics. The shares have underperformed the market over the past 1 to 3 months but we do not expect this to continue.
Pros
Ranks in the top 5 of our fundamental ranking model.
Canaccord Genuity reiterated ‘Buy’ advice on the 20th August with a price target of 2720p.
The business continues to produce steady cash flow and boasts a healthy dividend.
Cons
Sales have slowed in recent months.
Peel Hunt reiterated its hold rating on the 1st May 2019 with a price target of 2025p.
Complaints have been raised about the quality of Persimmon homes, this may act as a drag in the short term.
Stop: 1790p
Target: 2430p

Babcock - Potential bottom forming.Buy Babcock (BAB.L)
Babcock International Group PLC is a holding company. The Company provides engineering services. Its segments include Marine and Technology, Defence and Security, Support Services and International. The Marine and Technology segment delivers support to the United Kingdom Royal Navy's submarines, naval ships and infrastructure. It also offers solutions in engineering, equipment management, consultancy, information and knowledge management. The Defence and Security segment offers engineering and training support services.
Market Cap: £2.68Billion
Babcock appears to be in the process of forming a bottom pattern on the daily chart. A break above 576p is needed to confirm the bottom pattern. Buying now is a pre-emptive move but it offers fantastic risk/reward at the current levels. The company is likely to benefit substantially on a Brexit deal.
Stop: 490p
Target 1: 576p
Target 2: 740p
Target 2: 800p
Interested in UK Stocks?
Join our free Telegram channel for up to date analysis on the best main market opportunities in the UK right now - t.me

IG Group - Inverse head and shoulders bottomBuy IG Group (IGG.L)
IG Group Holdings plc is a United Kingdom-based company, which is engaged in online trading. The Company provides contracts for difference (CFDs) in over 17 countries globally. The Company's segments include UK, Australia, Europe and Rest of World. The UK segment consists of its operations in the United Kingdom and Ireland, and derives its revenue from financial spread bets, CFDs, binary options and execution only stockbroking. The Australian segment derives its revenue from CFDs and binary options. The Europe segment consists of its operations in France, Germany, Italy, Luxembourg, the Netherlands, Norway, Spain, Sweden and Switzerland, and derives its revenue from CFDs, binary options and execution only stockbroking.
Market Cap: £2.2Billion
IG has completed an inverse head and shoulders bottom pattern on the daily chart. The move higher stalled at 648 and has corrected lower towards the neckline of the pattern at around 580p. This also lines up with a couple of Fibonacci support levels. The bullish outside candle that has formed today suggests that further upside could be seen in the short term.
Stop: 555p
Target 1: 630p
Target 2: 733p
Interested in UK Stocks?
Join our free Telegram channel for up to date analysis on the best main market opportunities in the UK right now - t.me

Clean up with Reckitt BenckiserBuy Reckitt Benckiser (RB.L)
Reckitt Benckiser Group plc is a manufacturer and marketer of health, hygiene, post-natal and home products. The Company's segments include ENA and DvM. The ENA segment consists of Europe, Russia/Commonwealth of Independent States (CIS), Israel, North America, Australia and New Zealand. The DvM segment consists of North Africa, Middle East (excluding Israel) and Turkey, Africa, South Asia, North Asia, Latin America, Japan, Korea and the Association of Southeast Asian Nations (ASEAN). Health, Hygiene, Home and Portfolio Brands categories are split across the geographical segments of ENA and DVM. Its range of hygiene products includes disinfectant cleaners, automatic dishwashing detergents, pest control, depilatory products and acne treatments. The Company's portfolio of brands includes Durex, Mucinex, Scholl, Strepsils, Cillit Bang, Clearasil, Dettol, Harpic, Lysol, Mortein, Veet, Air Wick, Calgon, Vanish and Woolite.
Market Cap: £44Billion
Reckitt Benckiser has had an indifferent few months. So often it’s a mainstay of investors portfolios with its predictable growth and solid stream of income. In recent months the share price has been in consolidation mode and not really offered investors very much. In recent weeks a bullish channel has formed, and we are beginning to see investors return on spells of weakness. The latest move from the lower end of the channel could be the beginning of a fresh move higher towards resistance at 7175p
Stop: 5980p
Target 1: 6710p
Target 2: 7165p
Interested in UK Stocks?
Join our free Telegram channel for up to date analysis on the best main market opportunities in the UK right now - t.me
