FTSE100 UKX Long Trader / OpportunityFTSE100 Fell more than 7% from the recent highs from 7700 without any retracement. We can expect this whole move to retrace at least 38% from the bottom towards 7400.
We can go long on this if FTSE gets above 7200 after stock market open. Stops 6990 target 200pts
Ftse100

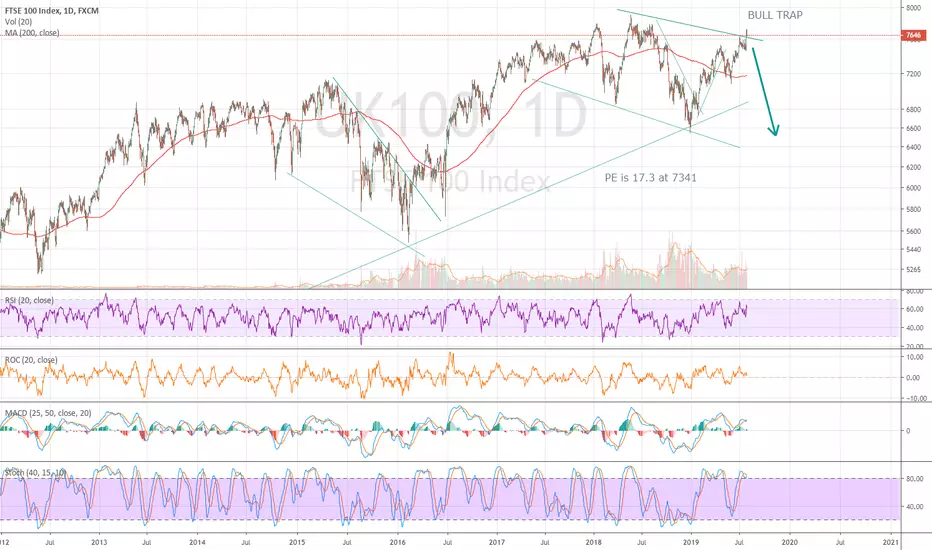
FTSE100 OVERVALUED - BULL TRAP - SHORT ITThe FTSE100 index is selling at a P/E of 17.2. This is quite high in a low interest rate, low growth scenario. The UK is in a mess, with Brexit problems, neighboring countries teetering on recession and Boris taking over the leadership. A DCF valuation of the FTSE100 using 3.2% growth, 8.6% discount rate it shows the index is 11% overvalued. I think the German DAX and US markets are going to tank soon, don't be fooled by the cut in interest rates in the US. The ECB can't really cut rates much more with low or negative rates already in Europe. Negative rates are a desperate attempt to inflate a sagging economy, European markets are ripe for a fall. The FTSE100 has jumped up a bit lately, this is a bull trap above the downward sloping trendline. The technicals are hinting at a coming fall. If you do short, I'd prefer to short the DAX as it has a lot foreign trade exposure with its auto industries. However, for those watching the FTSE100 index, a short now could be a winner.
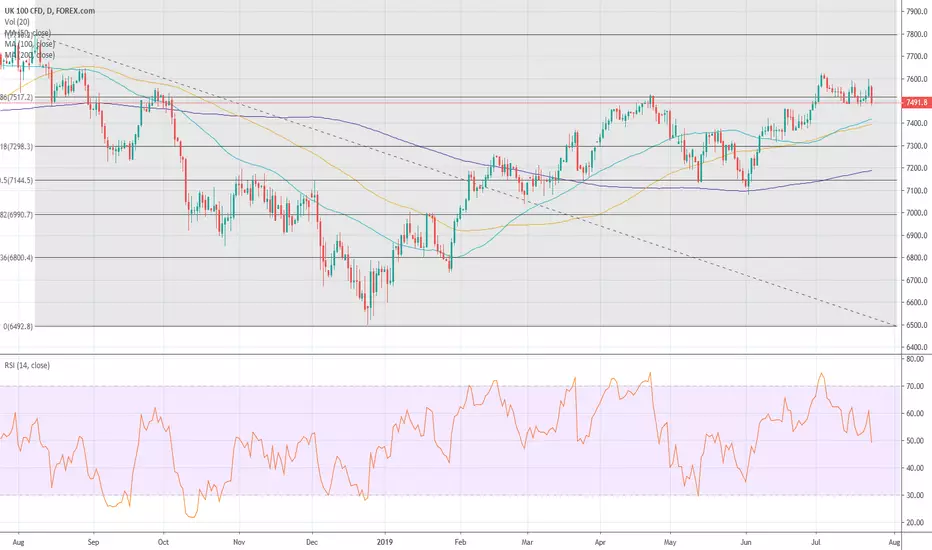
FTSE 100 - Still long aiming for all time highsOn our analysis on the 24.07 we indicated that we were long the FTSE100 due to pressure GBP/USD due to the uncertainty surrounding Brexit which would be positive for the FTSE100 as a large proportion of profits for FTSE 100 companies are made in dollars. Since then the FTSE 100 has risen by nearly 3% and with the expected US rate cut on Wednesday we anticipate the index to reach all time highs at around the 7796 Fibonacci level.

FTSE 100 - Long We are currently long the FTSE 100 which has dropped over the past day on the back of Boris Johnson's appointment and the subsequent strengthening of the pound. The pound strengthened as the market hopes that initial comments by Michel Barnier the European Union's Chief Negotiator would open the door to positive negotiations between the UK and the EU. However, we believe that with the UK set to leave the EU on the 31st of October there will be pressure on sterling in particularly GBP/USD which would be positive for the FTSE100 as a large proportion of profits for FTSE 100 companies are made in dollars. Therefore we are long and will look to add to our long position just above the 7298 Fibonacci level with a view towards starting to take profit above 7700.
UKX FTSE100 1hr rejection from 7600FTSE 100 has rejected 7600-7590 area in the 1hr time frame, 3 consecutive times suggesting that a correction is possible.
If FTSE100 breaks below 7550 (23% fib level) we can see a correction upto 60% Fib levels at 7440-7430 levels.
But FTSE needs to break below 7550 to trigger this trade.
Stops should be above the recent highs.

FTSE - Missed it again?The move lower got even closer to our entry point than it did yesterday (see related idea).
We may have missed the entry again. Still keen on buying dips (for now)!
FTSE - Stalled just in front of our entry level. Good enough?DAY TRADE - EXPIRES AT 9PM
We were looking for a dip to buy today but the market appears to have stalled in front of our entry level. Is this good enough reason to get long?
Overall we remain bullish.
Trade Idea
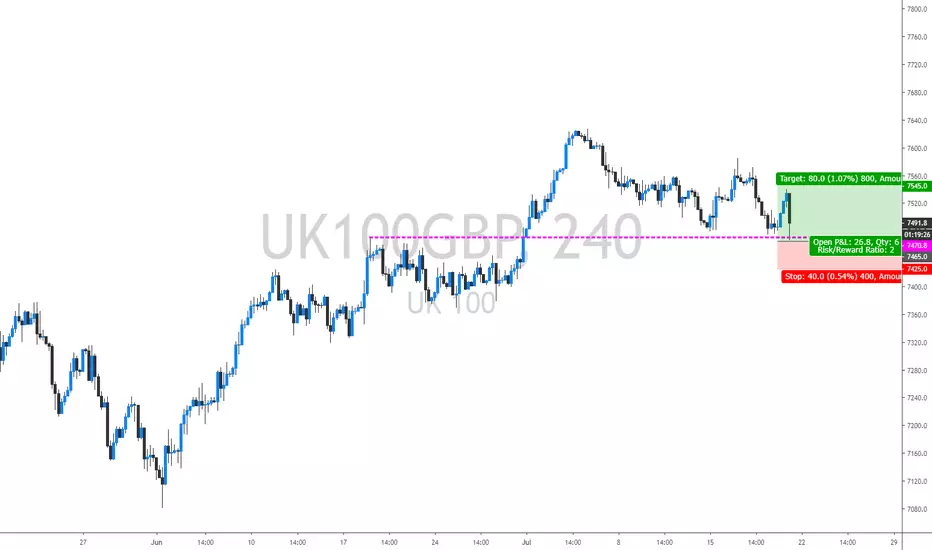
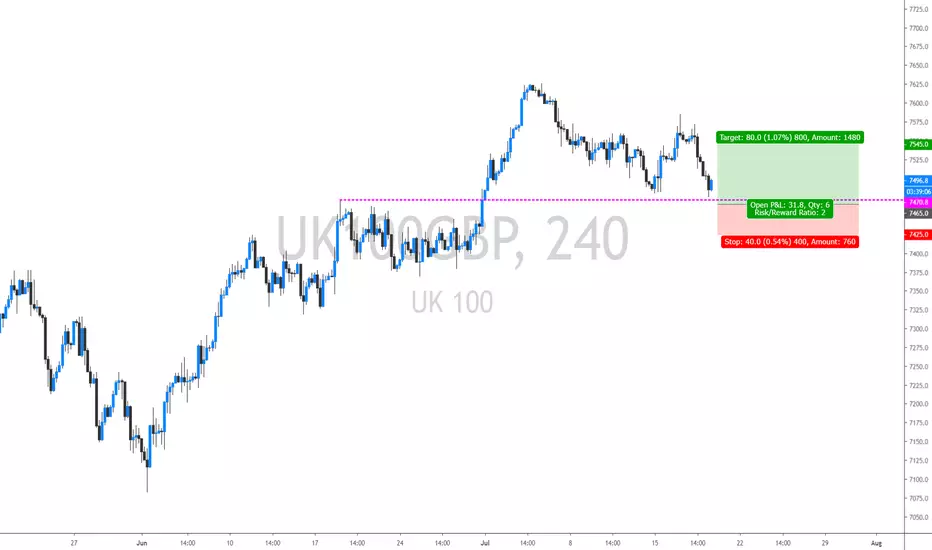
The overnight rally has been sold into and there is scope for further bearish pressure going into this morning.
Bespoke support is located at 7465.
Negative overnight flows lead to an expectation of a weaker open this morning.
As this corrective sequence continues we look to set longs on a dip at better risk/reward levels.
Further upside is expected although we prefer to set longs at our bespoke support levels at 7465, resulting in improved risk/reward.
We look to Buy at 7465
Stop: 7425
Target 1: 7545
Target 2: 7600
FTSE100 TO RALLY INTO DAILY HIGHSFTSE100 has recently tested a key demand zone and formed bullish price action.
We can expect this market to continue higher with targets being the daily highs.
The price is also supported by the 20 and 50 EMA pointing upwards with price rejecting
the key demand zone and the 20EMA.

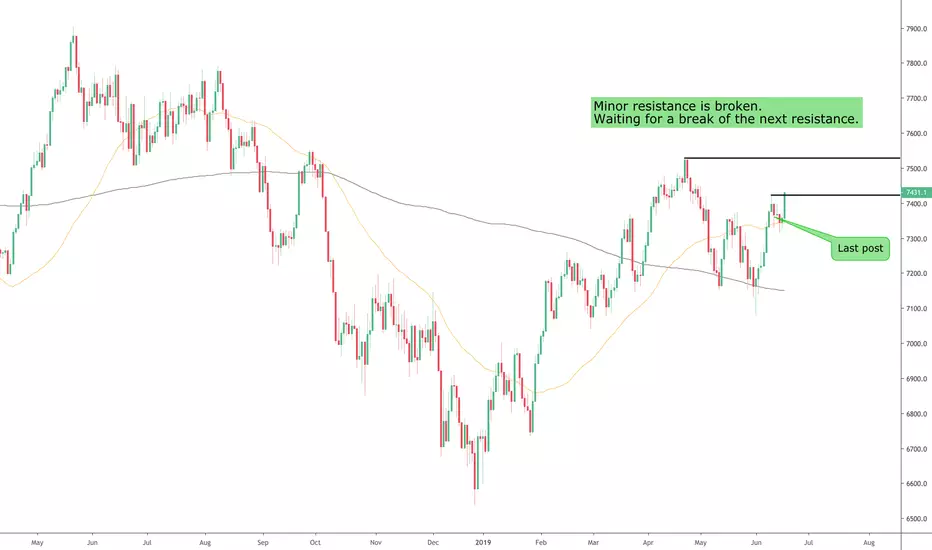
FTSE 100 Breaking Resistance Levels!Last post: June 18th 2019. See chart .
Review: Price had just broken a resistance level.
Update: Another resistance level was broken with a strong breakout.
Conclusion: Price looks strong and we eventually want to see a break of the previous all-time high.
Any comments or questions, do not hesitate to leave them below. Give us the thumbs up if you share our sentiments!
Sublime Trading

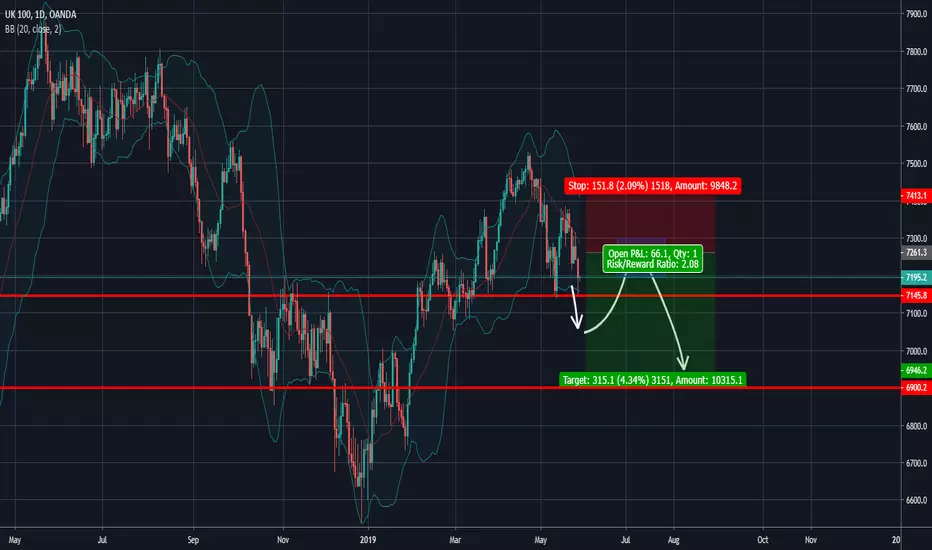
FTSE100 potential Break Down FTSE 100 has a potential break down below 7140 which could lead all the way down to 6900s.
For a entry, looking a entrancement back above 7200 with stops around 7400.
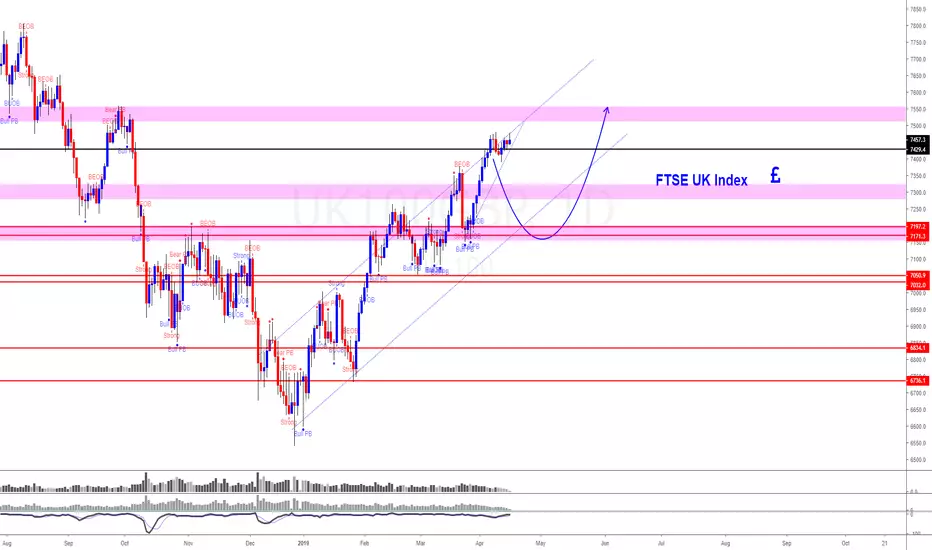
FTSE UK Stock Index ( 7,190 is a very strong support)Updated View On FTSE (16 Apr 2019)
Back Ground: The bullish "immediate" momentum has definitely slowed. There may be pullback along the way. Watch out the region of 7,190 regions as it may act as strong support.
Target(s): Neutral
SHTF: It will use 7170 to 7190 as strong support region.
DYODD, all the best and read the disclaimer too.
Feel Free to "Follow", press "LIKE" "Comment".
Thank You!
Legal Risk Disclosure:
Trading foreign exchange or CFD on margin carries a high level of risk, and may not be suitable for all investors.
The high degree of leverage can work against you as well as for you. Before deciding to trade foreign exchange you should carefully consider your investment objectives, level of experience and risk appetite.
The possibility exists that you could sustain a loss of some or all of your initial investment and therefore you should not invest money that you cannot afford to lose.
You should be aware of all the risks associated with foreign exchange trading, and seek advice from an independent financial advisor.
DISCLAIMER:
Any opinions, news, research, analyses, prices or other information discussed in this presentation or linked to from this presentation are provided as general market commentary and do not constitute investment advice.
Sonicr Mastery Team does not accept liability for any loss or damage, including without limitation to, any loss of profit, which may arise directly or indirectly from use of or reliance on such information.
FTSE 100 Breaking OutLast post: June 12th 2019. See chart .
Review: Price was around the daily 50 simple moving average.
Update: We have seen a nice move up today, breaking above a previous high.
Conclusion: The FTSE 100 is looking strong and we would like to see it break above the next resistance level.
Any comments or questions, do not hesitate to leave them below. Give us the thumbs up if you share our sentiments!
Sublime Trading
"Full View on FTSE 100 (Uk100)" Analysis by ThinkingAntsOk4H Chart Explanation:
- Price bounced on the Resistance Zone.
- Price broke the Ascending Trendline.
- Now, it has potential to move down towards the Support Zone at 7122,8.
However, our long term views are long!
Weekly Vision:
Daily Vision:


FTSE 100 Bounces Off SupportLast post: May 13th 2019. See chart .
Review: Price was heading towards the support level shown in the last post.
Update: Moves have been made to the upside.
Conclusion: Price is still in consolidation but has shown strength recently which we want to see continue and see further moves to the upside.
Any comments or questions, do not hesitate to leave them below. Give us the thumbs up if you share our sentiments!
Sublime Trading

