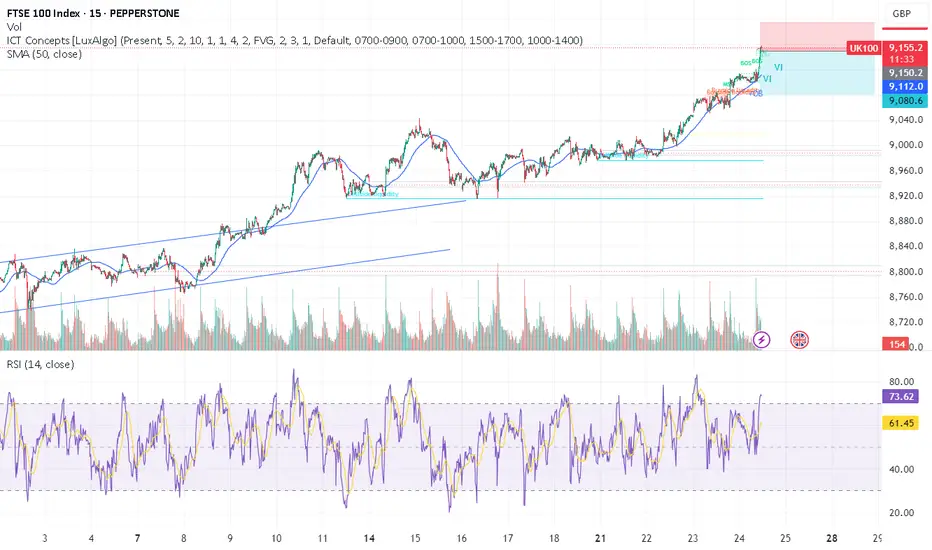
uk100 crazy pump - time to SHORTTeam, those who SHORT UK100, make sure stop loss at 9175
Target 1 at 9135-32
Target 2 at 9109-16
Last few months, UK100 has been aggressively cutting rate due to expose in recession. But now they are out of the wood.
The market has been over pricing and over value.
We expect the market to come down.
Ftse100short
UK100/FTSE100Team,
SHORT UK100/FTSE100 slowly at 8796-8826
TARGET at 8772-8746 ranges
DOUBLE UP at 8846-66 - target at 8802-12

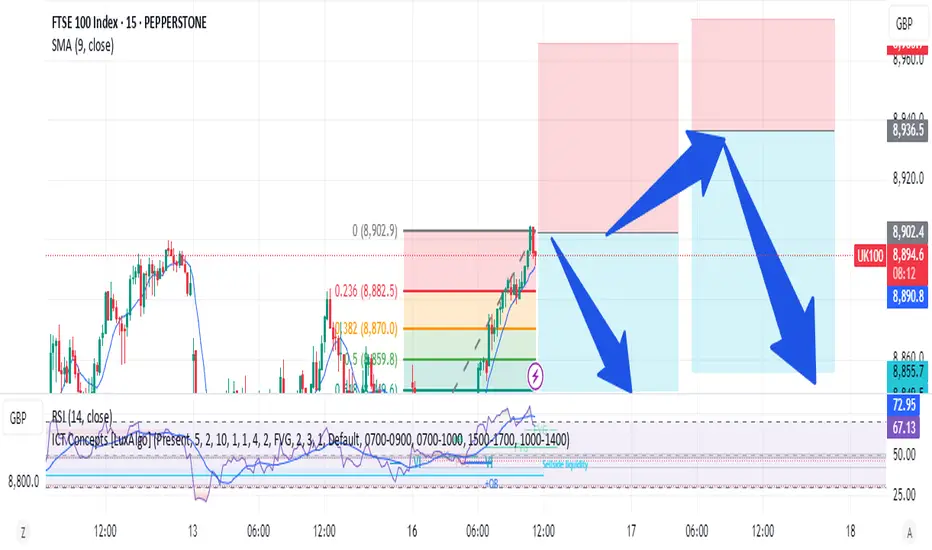
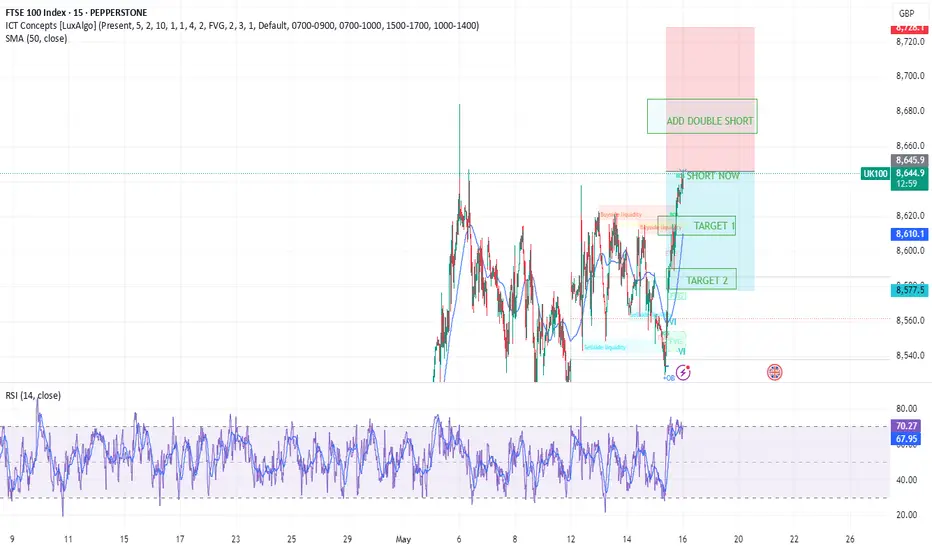
UK100/FTSE100 - SHORT THE HELL OUT OF UK - Team, last week we kill few times SHORTING ON UK100/FTSE100
Here is a million strategy from Active Trader Room
SHORT NOW at the current price 8992-96
DOUBLE SHORT at 8912-36
Target 1 at 8870-62
Target 2 at 8855-47
Please note: once it hit first target ,take 50% profit
the rule is always pocket first and reduce the risk.
LET'S MAKE ANOTHER MILLIONS THIS WEEK
UK100/FTSE100 - ANOTHER SECRET STRATEGY OF 95% WINNING RATIOTeam, this morning we booked UK100/FTSE100 again from our short position
As mentioned, it should drop low at 8817
We are now re-short the UK100/FTSE100 again at 8838-45 ranges
We should focus on the target at 8818-8807
or possible 87-92-86
However, we ALSO add more short at 8856-65
These will be target at 8832-28
Let's kill the UK100/FTSE100 together.
UK100/FTSE100 - FOLLOW THIS STRUCTURE, SURELY YOU MAKE PROFITTeam, last night for the first time I make LIVE trading on video.
Everyday i did LIVE trading but not recording
last night we have SHORT EURUSD, LONG USDCHF, LONG US30 LONG NAS AND SHORT GOLD - 5/5 perfectly hit target
Today I want to show you the structure how we can deal with UK100/FTSE100
SHORT UK at 8817-26 - double up at 8846-62
lets set this LIMIT ORDER IN
Target 1 at 8792-96
Target 2 at 8776-8755
Lets kill the market tonight!

UK100/FTSE100 - TIME TO MAKE MILLION ON UK100/FTSE100Team,
Time to make millions on UK100/FTSE100
short slowly at 8811-14
Double the short at 8818-35
Target at 8797-93
EASY MONEY, no stress
If you see my videos. Every day we print money, yesterday we long USDCHF, SHORT EURUSD - We hardly trade those, but when we do, we kill them. Both also closed out today.
We also shorted the UK100 yesterday, and the target hit closed today.
UK100/FTSE100 - time to short slowlyTeam, let's kill the UK100/FTSE100
last night, we got target hit both in 15 minutes during LIVE trading. Today we are going to short the UK slowly according to the strategy set out
Please note: Target 1 will be around 8778-8771
Once it hits, take 70% and bring a stop loss to BE
Target 2 - will unload the remaining 30% volume.
Please carefully look at the chart. There is a section where if the market goes against you, please double up at that section; that would allow us to make double the profit. However, when it pulls down to our original short, we can take those profits.
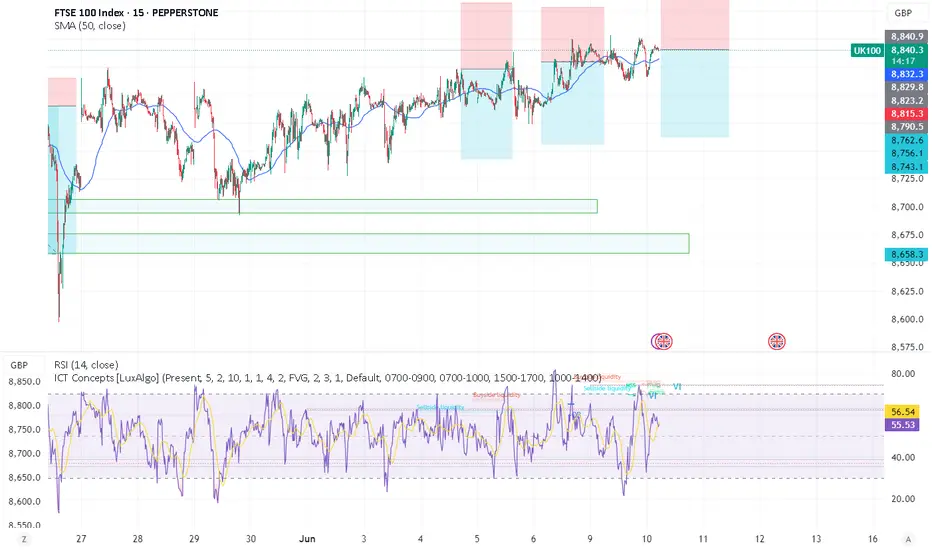
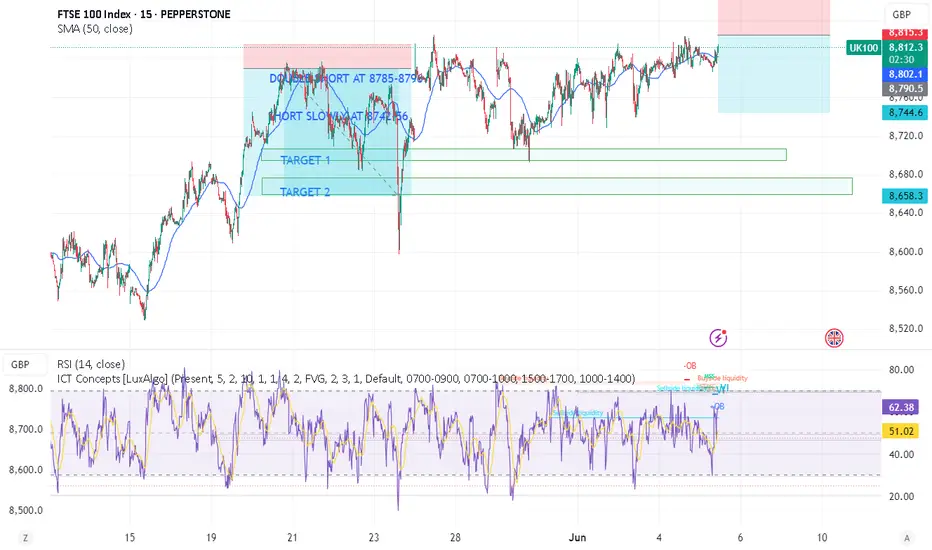
UK100 - STRATEGY TO MAKE MILLIONSTeam, you have been killing the UK100 last week,
YESTERDAY, we will the AUS200
every day is a winning for us. I am about to make a video of education on how to kill the market daily!
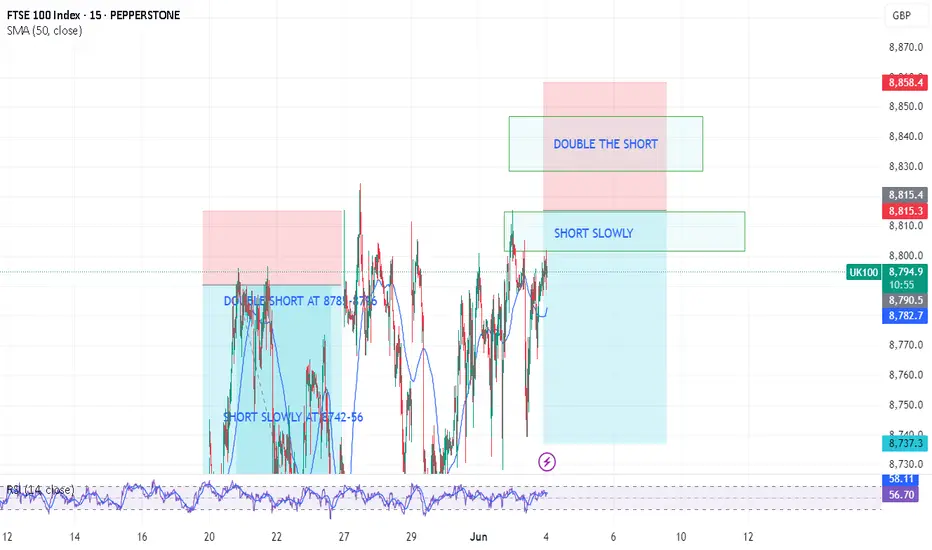
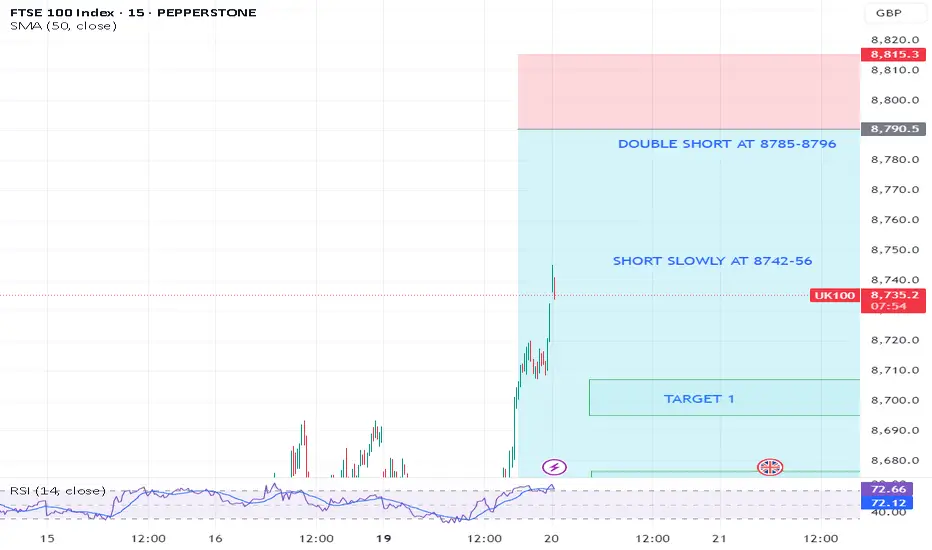
Today we are preparing to short UK at 8742-8756
DOUBLE UP the short at 8785-96
Target range 1 at 8705-15
Target range 2 at 8672-8658
Remember: be humble, be focused and always care about risk management. Now, let's kill the UK100 market together.
UK100 - FTSE100 - TIME TO MAKE MILLION ON SHORTHi Everyone,
I hope yesterday you enjoy 450-500 points on DOW/US30 when we have two long and two target hit
last 2-3 days we avoid the US30 because we wait for the good set up.
Same as UK we short last two day but we didn’t short yesterday.
Now you are going to kill the UK100 together
Please watch the CHART carefully as we want to EXTRA Short price at 8668-8682 ranges
DO not be afraid. I am PRO trader if you go to my profile and check out and click the video.
I show you how to make $5000 simple every week.
Also follow the 1st target at 6622-15. TAKE partial 30%-50% and BRING stop loss to BE
NOTE: once you took and it move back hit stop loss - SHORT AGAIN,
Second target at 8596-8582
Hope you enjoy the TRADE yesterday on US30, you can check trading view chart post yesterday!
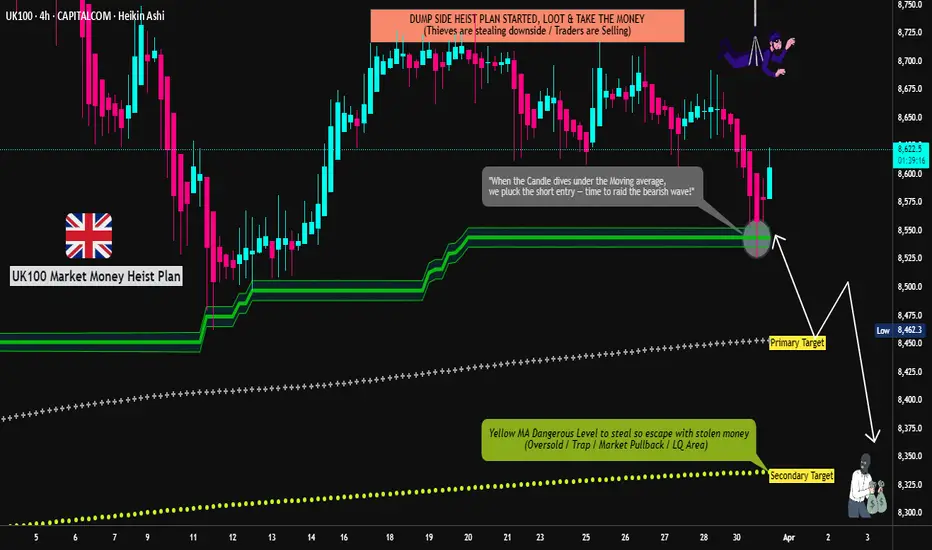
"UK100" Indices Market Bearish Heist Plan (Swing / Day Trade)🌟Hi! Hola! Ola! Bonjour! Hallo! Marhaba!🌟
Dear Money Makers & Thieves, 🤑 💰🐱👤🚀
Based on 🔥Thief Trading style technical and fundamental analysis🔥, here is our master plan to heist the "UK100" Indices CFD Market. Please adhere to the strategy I've outlined in the chart, which emphasizes short entry. Our aim is the high-risk Yellow Moving Average Zone. Risky level, oversold market, consolidation, trend reversal, trap at the level where traders and bullish thieves are getting stronger. 🏆💸Book Profits Be wealthy and safe trade.💪🏆🎉
Entry 📈 : "The heist is on! Wait for the breakout (8530) then make your move - Bearish profits await!" however I advise placing Sell Stop Orders below the breakout MA or Place Sell limit orders within a 15 or 30 minute timeframe. Entry from the most nearest or Swing high or low level should be in retest.
📌I strongly advise you to set an "alert (Alarm)" on your chart so you can see when the breakout entry occurs.
Stop Loss 🛑: Thief SL placed at (8670) Day / Swing Trade Basis Using the 4H period, the recent / swing high or low level.
SL is based on your risk of the trade, lot size and how many multiple orders you have to take.
Target 🎯:
Primary Target - 8460 (or) Escape Before the Target
Secondary Target - 8350 (or) Escape Before the Target
🧲Scalpers, take note 👀 : only scalp on the Short side. If you have a lot of money, you can go straight away; if not, you can join swing traders and carry out the robbery plan. Use trailing SL to safeguard your money 💰.
"UK100" Indices Market Heist Plan is currently experiencing a bearishness,., driven by several key factors.
📰🗞️Get & Read the Fundamental, Macro, COT Report, Geopolitical and News Analysis, Sentimental Outlook, Intermarket Analysis, Index-Specific Analysis, Positioning and future trend targets.. go ahead to check 👉👉👉🔗
⚠️Trading Alert : News Releases and Position Management 📰 🗞️ 🚫🚏
As a reminder, news releases can have a significant impact on market prices and volatility. To minimize potential losses and protect your running positions,
we recommend the following:
Avoid taking new trades during news releases
Use trailing stop-loss orders to protect your running positions and lock in profits
💖Supporting our robbery plan 💥Hit the Boost Button💥 will enable us to effortlessly make and steal money 💰💵. Boost the strength of our robbery team. Every day in this market make money with ease by using the Thief Trading Style.🏆💪🤝❤️🎉🚀
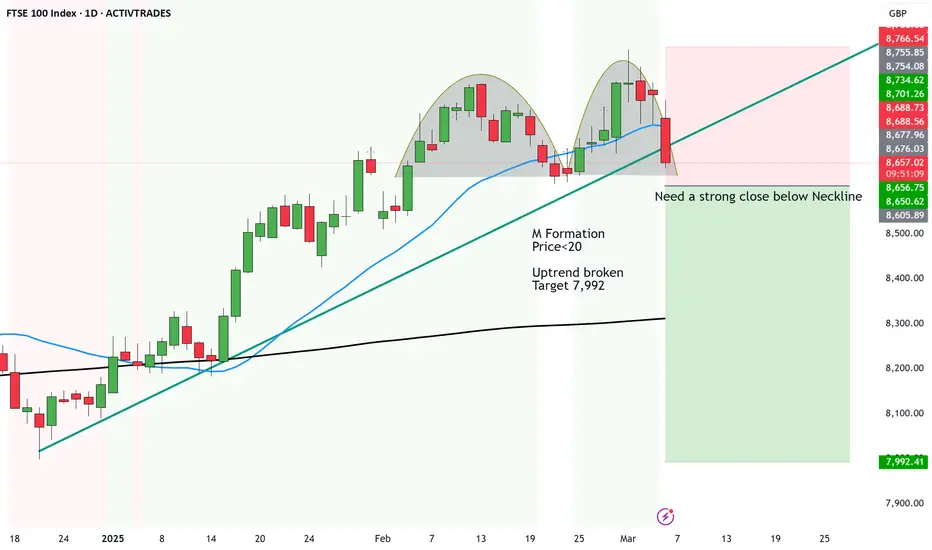
FTSE 100 setting itself for a 600 point Crash?As I did an analysis on downside to potentially come for the S&P500 yesterday, looks like the FTSE is following suit.
If they don't sort out these issues, we could see a 600 points crash for the FTSE...
Here are some reasons...
New U.S. Tariffs:
President Trump imposed a 25% tariff on imports from Mexico and Canada, and increased tariffs on Chinese goods to 20%, sparking fears of a global trade war.
Oil Price Drop:
OPEC+ announced plans to boost oil output in April, leading to a 3% decline in the oil and gas sector.
Weak UK Construction Data:
The UK construction sector faced its most significant downturn since 2020, with the PMI dropping to 44.6 in February, indicating contraction.
Corporate Disappointments: Companies are reporting worse than expected results which is resulting in a lack of confidence in investors.
Melrose – Weak revenue forecast
WPP – Revenue decline, flat 2025 outlook
Quilter – £76m compensation hit, loss reported
Glencore – Lowest profits in 4 years
Shell – Weaker-than-expected annual profits
JD Sports – Multiple profit warnings, stock drop
And the technicals speak for themselves.
We see an M Formation, with the price reaching the neckline. If it breaks below, we could first see the price head to 200MA along with a further crash to 7,992.
We are seeing a pattern with these indices and either this will play out or something drastic will shock the world and will go back to all time highs.
Right now, it's not looking good.
We are at it again!I am short UK 100 with the following:
Entry: 7822.83
Stop Loss: 8150
Take Profit 7300
R/R of 1.6 which is slightly higher than my usual 2 taking ATH into consideration.
Timeline is 30 days or when TP/Stop is hit respectively.

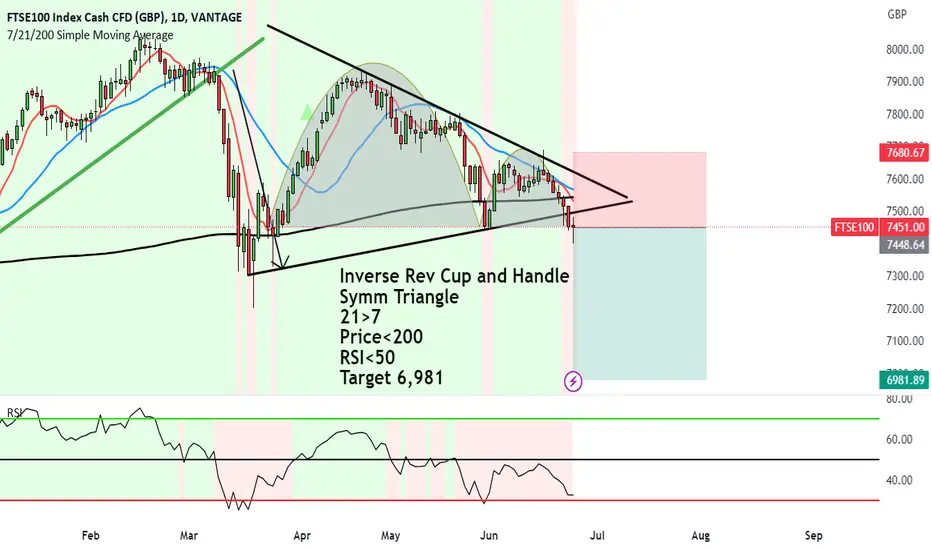
FTSE just broke below two Bearish Patterns -Target 6,981Inverse Rev Cup and Handle has formed on the daily.
And a Symmetrical Triangle too.
Now the Symm Triangle is normally a continuation pattern. But because of the state of the markets world wide, they are bringing down the main indices like FTSE 100.
These are bearish signals along with these indicators.
21>7
Price<200 (Red zone)
RSI<50 (Red zone) and lower highs.
Target 6,981
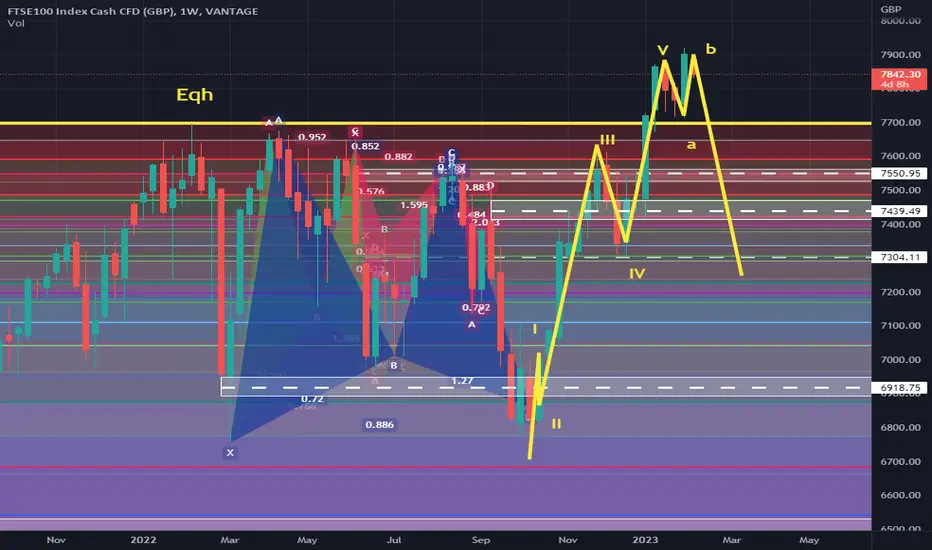
UK100 CrashHello we are part of a new community called lucky trading club in tradingview so let's begin our second analysis.
UK100, ftse100 will crash, we have a eqh on 7700 with a lot of liquidity it was already taken last friday on 7900, also we have 5 waves of elliot and harmonic pattern in the range of 7700-7900
We still in uk100 ATH when all institution begin to sell gradually and uk economy still in acute crisis because inflation and decrease of pbi.
In ressume a lot of confluences to take this short position.
Type of trade: Swing.
Entry: 7840-7900
Our targets
Target 1: 7700
Target 2: 7580
Target 3: 7400
Target 4: 7200
Max x20
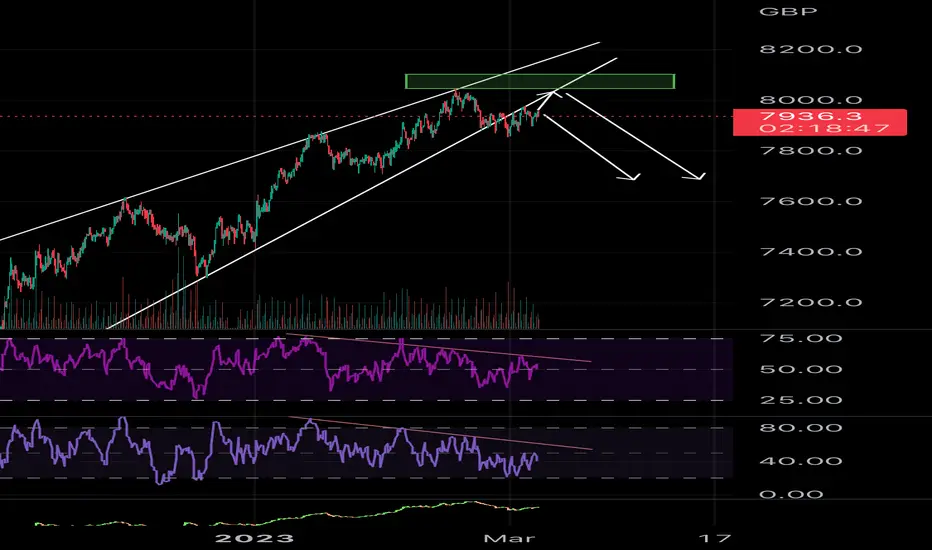
FTSE BULLISH EXHAUSTION?I am currently looking to sell this index.
It is no surprise to anyone who reads my ideas ,not many:p, that I am of the option that whilst the latest inflation data coming from the UK has ticked lower, I believe it will again raise its head to bite the UK on its ar$e.
I guess more importantly, I think the inflation data coming out of the US over the coming months will be hot and with that the dollar will rally once again. Although not quite as it did in 2022. This will result in a significant exportation of inflation around the world which will further increase the prices of food, energy and fuel; pretty much everything that is priced in USD. Ultimately hurting the economies which the companies comprising the FTSE rely on. Aside from big pharma and petrochemicals.
Moreover, if you look at the chart above, the FTSE has been in a decent rally since October of last year which culminated in an all-time high milestone of 8000. The rally to date has been moving in an ascending triangle (WHITE) which coincided nicely with relatively strong divergences between the move up to 8000 and the indicators shown (RED).
This is often a good indication of weakness in a prevailing trend and may potentially signal bullish exhaustion. The price broke this triangle structure on 28/02/23 with a failed rally back to support which indicates that we may be looking at a decent move to the downside in the coming weeks and months. As such, I’m now looking to enter a sell trade from here-on.
My POI for this move is anywhere between 8950 and 8130 (current price to top of structure)
As always I will be scaling in my positions as (or if) the price moves higher, which I expect it will until Powell comes out and admits that last months 25bps hike was a mistake.
It’s important to note that the UK economy and this index are not overly correlated because whilst the companies making up the FTSE may be HQ’d in the UK, their market audiences are more global. Please bear in mind that this is not a full breakdown or analysis for an entry, it is just my current thoughts on this market and a very basic o view of why I’m looking to short this index. Please always do your own analysis and always trade with caution.
FTSE 100 Stock Index trading near top end of the price channelSqueezed
UK retail sales fell hard in September, higher cost of living hitting the pockets of consumers
UK recent economic data highlights
The drop in UK retail sales indicates that consumer spending slowed in September; actual -1.4% vs -0.3% forecast
Highlights little signs UK household spending to pick up soon as higher prices push consumers to become more careful about spending
FTSE 100 Stock Index trading near top end of the downward price channel
UK100 Index: current price remains vulnerable towards the downside, although price has traded slightly stronger since touching the 52-week low at 6,713 last week momentum indicators seem to suggest further price weakness ahead for the index
Scenario
(a) Price fails to consolidate above it’s 10-day very short term moving average around (6,900) which exposes a re-test of last weeks low near 6,713, and if the 52-week low fails to hold a further extension lower towards 6,400 (2.618% lower extension from the August highs - September lows)
(b) Price breaks out of the downward price channel (chart 1) and makes a move toward the upper 7,180 resistance

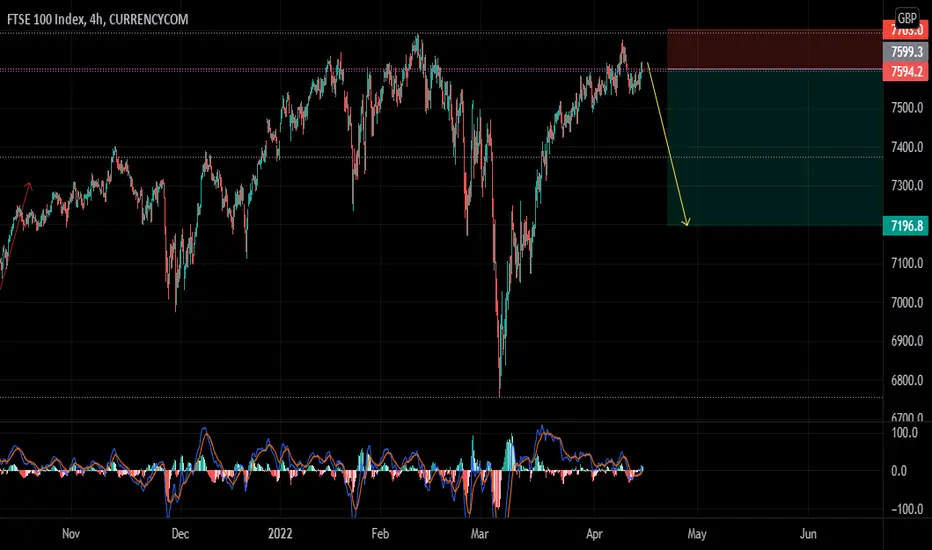
SHORT FTSE 100Short FTSE 100 @ 7450
TP: 6900
SL: Around 7700
The UK has many problems involving the PM, energy, cost of living crisis, recession, inflation and a devaluing currency. Normally GBP weakness was beneficial for the equity index however, the correlation has broken down. THE BOE has admitted that we face 5Q's of recession ahead and I cannot see how that is positive for stocks. I have therefore sold into this rally and will look for sub 7k lvl to TP.
This trade could take a few months but I am happy to sell into this rally.
Good luck! ;)

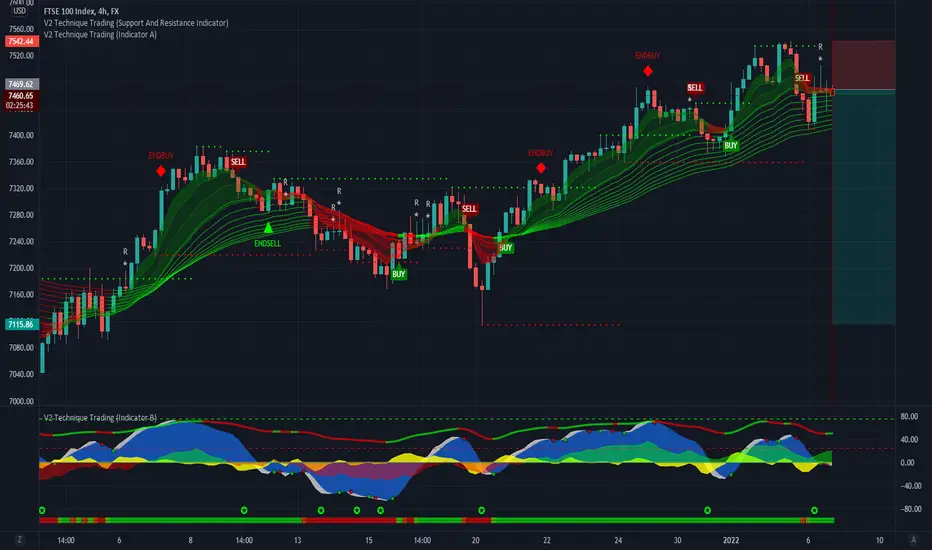
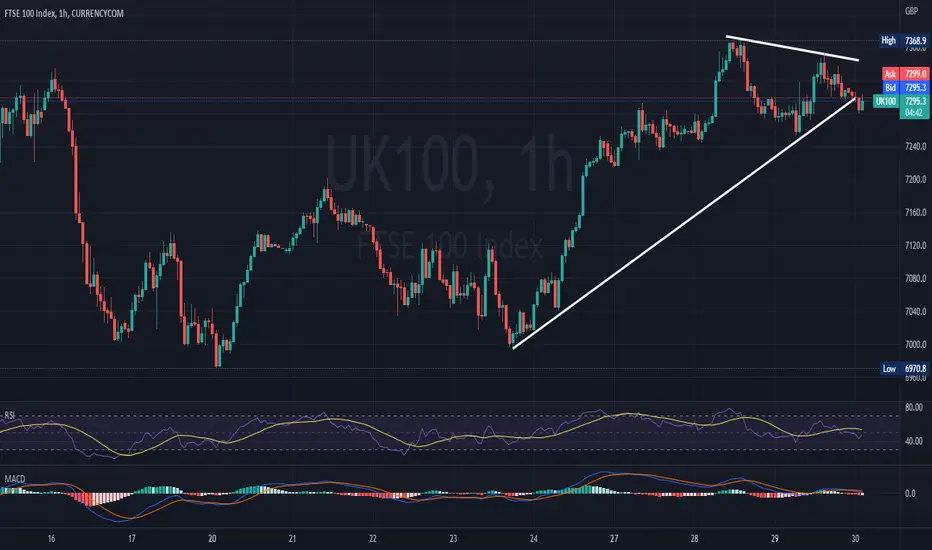
UK100 BEARISH PATTERNUK100 CFD had broken the support of the triangle pattern that was formed on the 1H graph. The histogram of MACD indicator is still below the zero line, also confirming a bearish outlook for the instrument.
If the price of the instrument continues its current movement, it might reach levels below 7040. On the other hand, if price reverses, it will most probably test the resistance of the triangle at 7350.
Risk Disclosure: Trading Foreign Exchange (Forex) and Contracts of Difference (CFD's) carries a high level of risk. By registering and signing up, any client affirms their understanding of their own personal accountability for all transactions performed within their account and recognizes the risks associated with trading on such markets and on such sites. Furthermore, one understands that the company carries zero influence over transactions, markets, and trading signals, therefore, cannot be held liable nor guarantee any profits or losses.
UK100 (FTSE100) Short Hellooooooo PIPIN TRADERS. This is one of the trades I will be looking at for the next few days before I post another update/analysis on this index, RISK TO REWARD 1:4
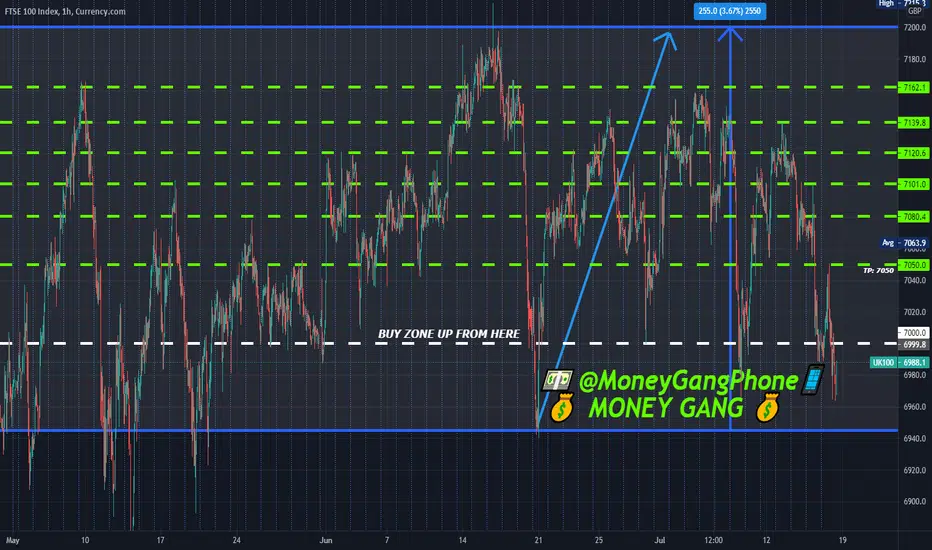
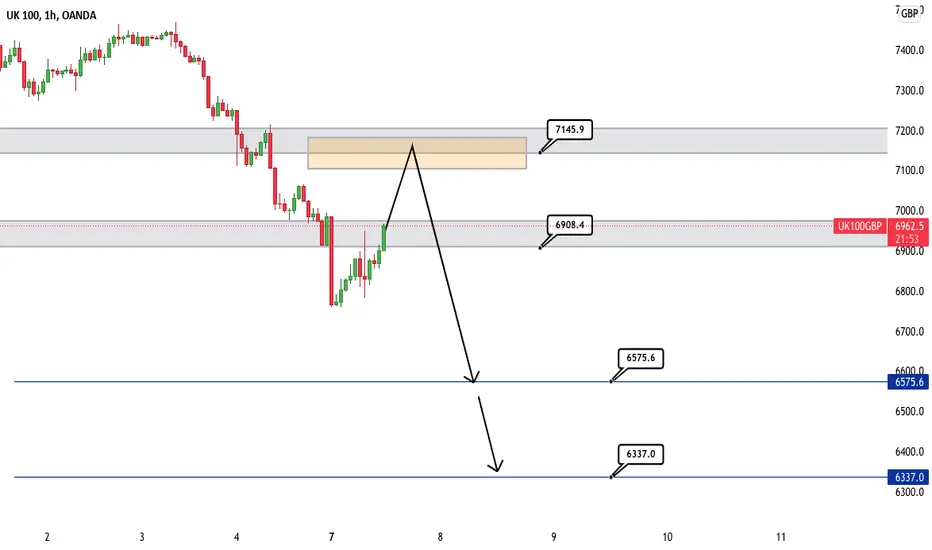
UK100 Golden area of sell Ftse100 is currently retracing after a very big movement to the downside. This retracement can take us up to the golden area of 7145. Here we can sell to push prices back down to the support area of 6900, if broken can take us to areas of 6575-6337.
FTSE100 Short PositionWith current outset, im going for a short good RISK MANAGEMENT AS ALWAYS, following the various indicators.