FTTUSDT at the Edge! Breakdown or Massive Breakout?📌 Overview: A Rebirth from the Dead Zone
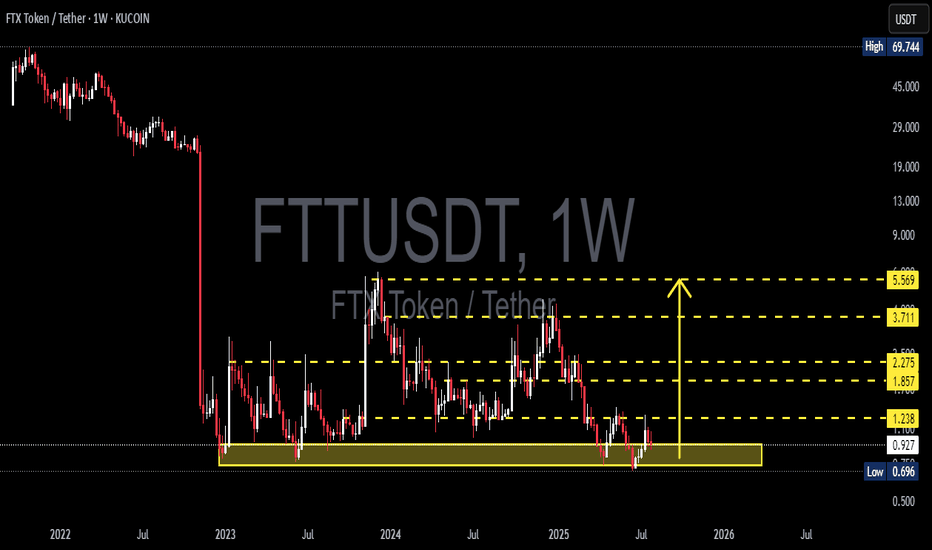
FTT/USDT is currently in one of its most technically compelling phases in the past two years. After suffering a catastrophic 98% crash following the collapse of the FTX ecosystem in 2022, price action now shows signs of long-term accumulation at a historically strong demand zone — potentially forming a solid base for a medium to long-term recovery.
The crucial support zone between $0.70 and $0.90 has been tested multiple times since late 2022 and has consistently held against extreme sell pressure. This suggests the presence of a strong historical demand area. Now that the price is once again reacting bullishly from this zone, the door is opening for a potential technical rebound.
---
🧠 Forming Pattern: Accumulation & Bottoming Structure
1. Base Accumulation Range:
A long period of sideways movement after the major crash.
Indicates exhaustion of selling pressure and possible stealth accumulation by smart money.
2. Potential Double Bottom or Rounded Bottom:
If this rebound holds, a double bottom could be confirmed with a breakout above $1.238.
A rounded bottom formation could signal a major reversal rally if backed by volume and catalysts.
---
🟢 Bullish Scenario (Reversal in Progress):
If buyers hold the current support and push through resistance levels:
🔓 Break above $1.238 = key reversal confirmation.
🚀 Potential bullish targets:
$1.857 – Previous minor resistance.
$2.275 – Former breakout zone.
$3.711 – Key structural level with historical liquidity.
$5.569 – Major psychological and technical target.
Strong confirmation if the breakout is supported by volume and a full-bodied weekly candle.
---
🔴 Bearish Scenario (Further Downside):
If price fails to hold the support zone:
📉 A breakdown below $0.696 would invalidate the bullish setup and could lead to:
New price discovery below $0.50
A potential “death spiral” if sell volume increases rapidly.
This scenario is extreme and would heavily depend on broader market sentiment and the future of the FTX recovery process.
---
🧭 Key Levels & Technical Insights:
Element Details
Strong Demand Zone $0.70 – $0.90 (multi-tested since 2022)
Bullish Trigger Level Break & retest of $1.238 with volume
Reversal Targets $1.857, $2.275, $3.711, and $5.569
Bearish Breakdown Loss of $0.696 = potential for new lows
Early Momentum Current bounce suggests possible start of reversal
---
💡 Final Thoughts:
> "FTT is no longer in a panic phase — it’s in a decision phase: will it rise as a ‘Phoenix Token’ from the ashes of FTX, or fall back into obscurity?"
Given the technical setup and long-term structure, this could be one of the most pivotal moments for FTT. Traders and investors should watch this level closely — the next major move is likely to begin from this very zone.
#FTTUSDT #FTTAnalysis #CryptoReversal #AltcoinWatch #TechnicalAnalysis #SupportResistance #BullishSetup #BearishScenario #DoubleBottom
Fttusdsignal
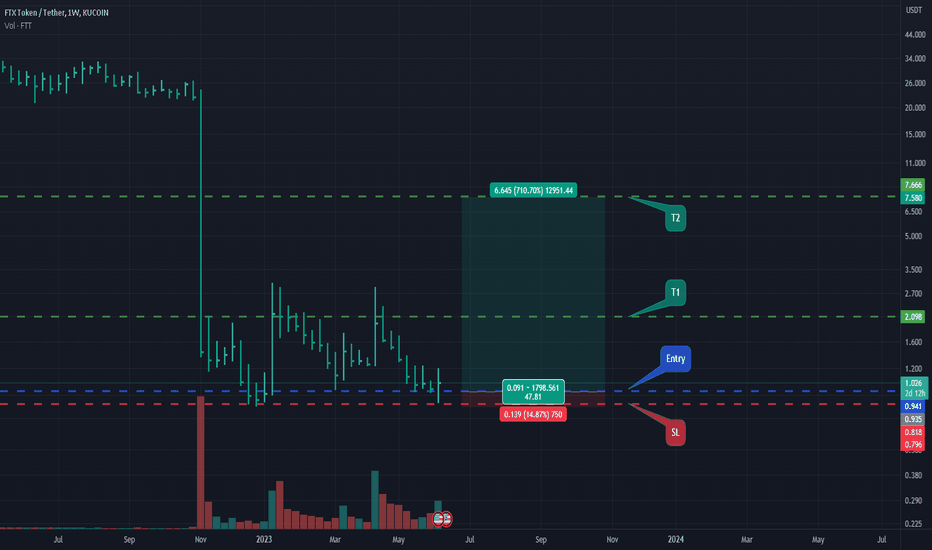
Hi, I see A very good Swing trade opportunityHi, I see A very good Swing trade opportunity
Risk Reward is very good
Some of you will say FTT is doomed, will I am a chart analyst, and there is a very good sign of accumulation in the chart.
The SL is around the corner (-15%) with almost 700% possible gain , so it worth the risk.
good luck every one
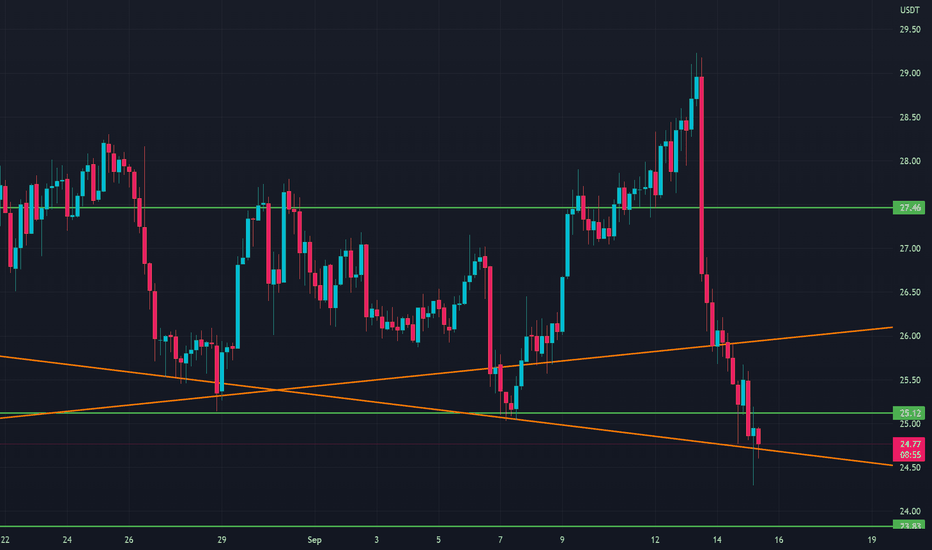
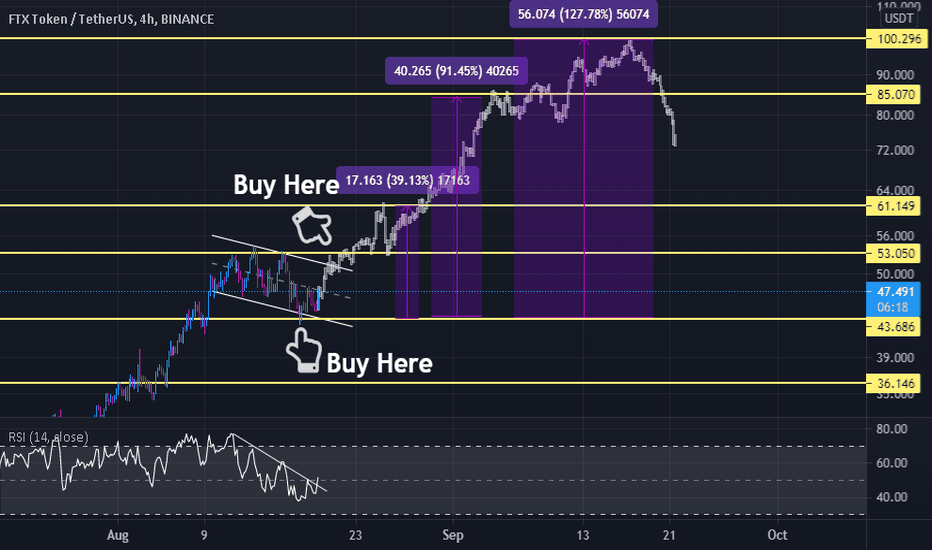
FTT USD experimental playWith the whole ETH merge situation i dont want to take big risks for te next 2-3 days but i cant pass on this FTT idea.
First of all, i'm buying HALF of my position here at 24.77 and i will set an order for the other half at 23.85.
this will give me an average enry price of
24.31.
i will have 3 take profit points
24.95 2.75%
25.90 5.9%
27.45 11%
and i will use 2x leverage because it is a little dangerous.
now,if things don't go our way
if 4hour candle closes below 22.80
i will cut my losses.that is a 6.1% loss which is unusual for me to risk that much but i dont see that scenario coming to life.
MAX 2X leverage with normal position size.
If take profit one is reached,stop loss will go to my entry price.
i will update here for every move i make.
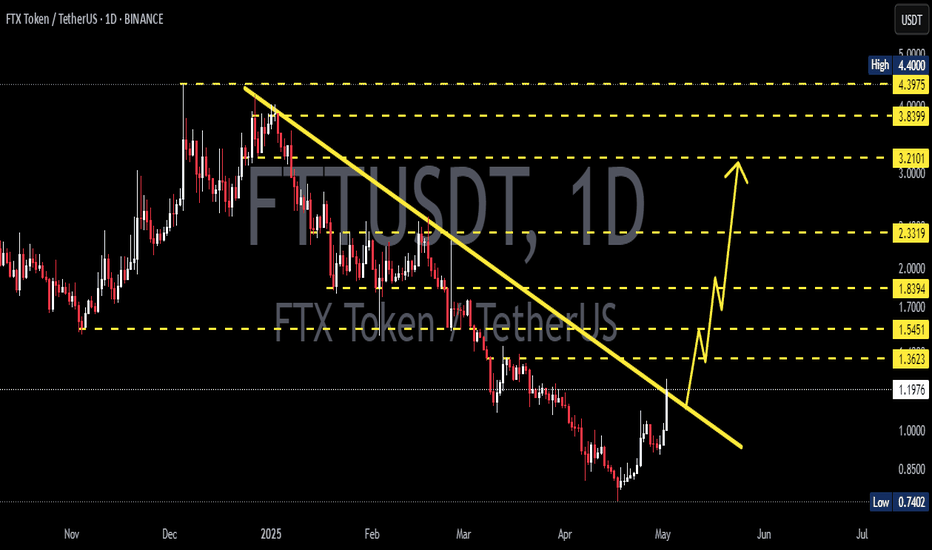
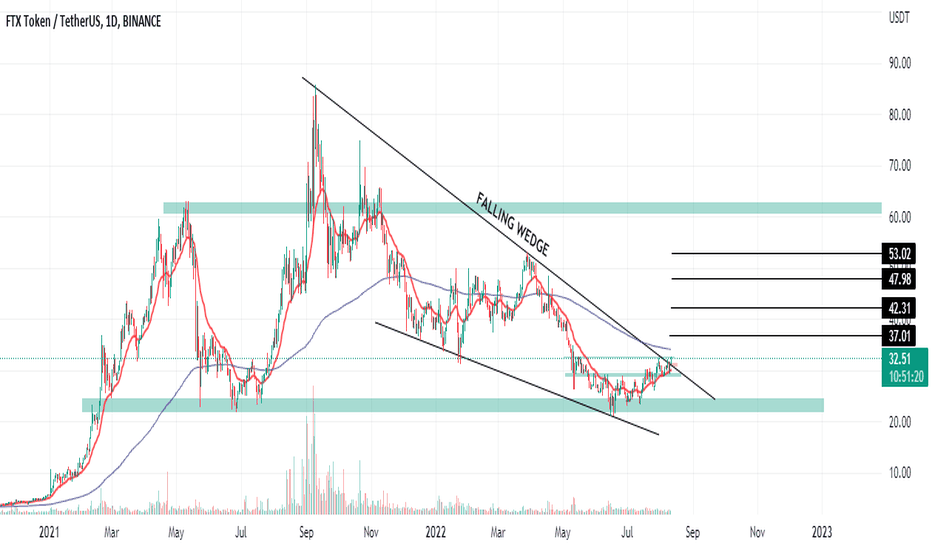
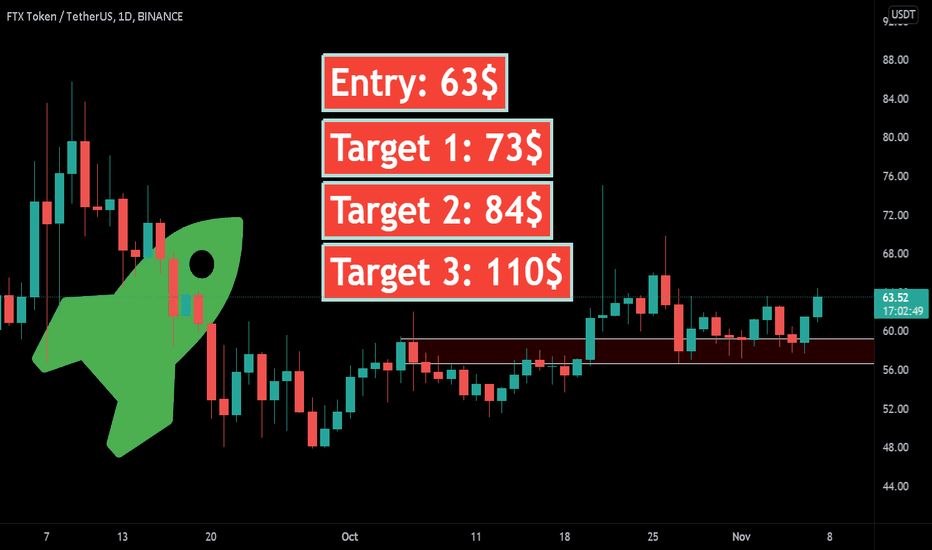
FTT/USDT BUYING SETUPFTT Breakout Major falling wedge pattern wait for daily close for confirm valid breakout or false break. if we see in 4h timeframe now FTT on strong resistance potential rejected back to retest on 4h demand before back to trying breakout the resistance . in 4h demand at the time support the trendline
Entry : 31.4 - 29.2 - 27
Target : 37 - 42.31 - 47.98 - 53
Stop : 25.6
Which Altcoin is most profitable now??Hello friends...
i'm checking lot's of altcoins to introduce best ones to you.
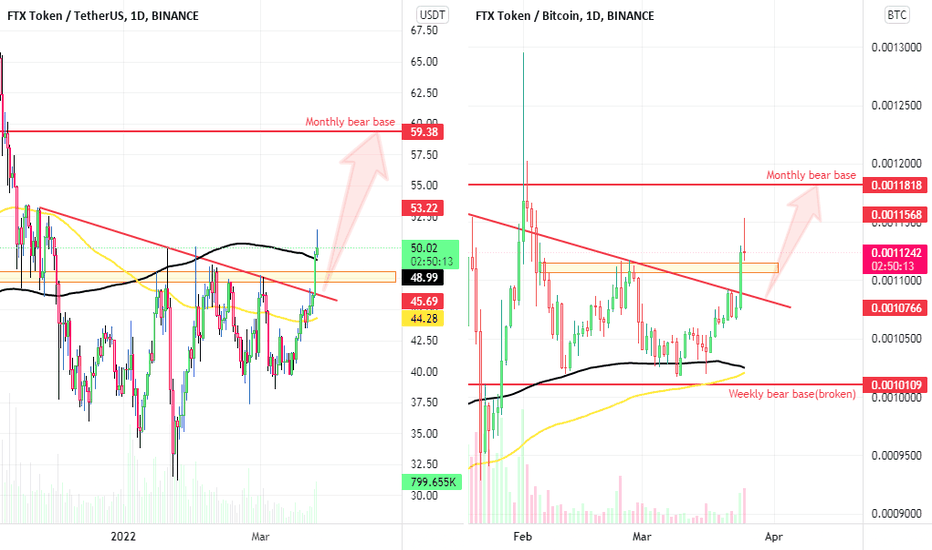
i think FTT is one of the best Altcoins that you can buy for a good profit.
it is bullish in btc pair and broke out weekly bear base and is very close to break monthly bear base. if you want to know how much this is important, i have to tell you only less than 10 Altcoins have this situation.
it has best supports as static levels, Dinamic levels, Ma, Ema and Sma. good news is there is no heavy resistance for it. i will set a buy order in support zones.
let's make a great profit...
if you have any questions, please ask me in comments...
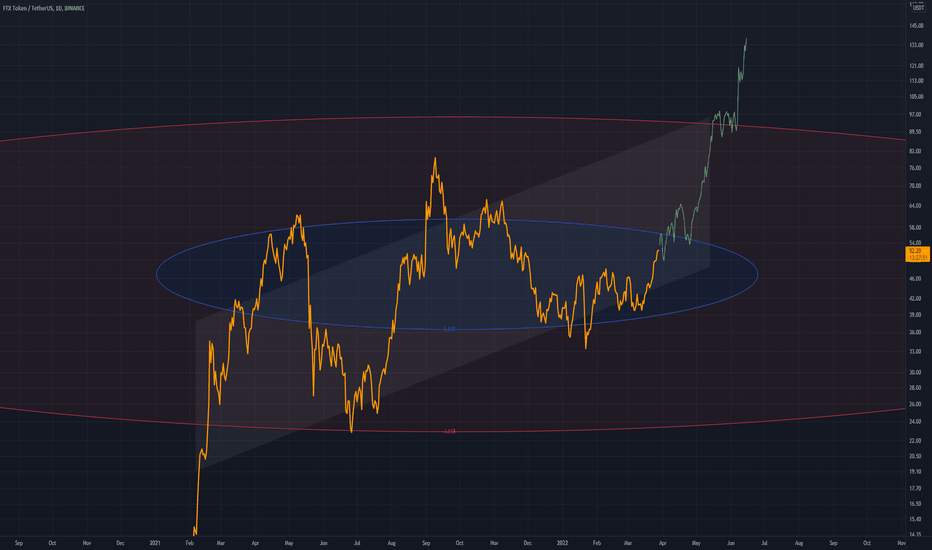
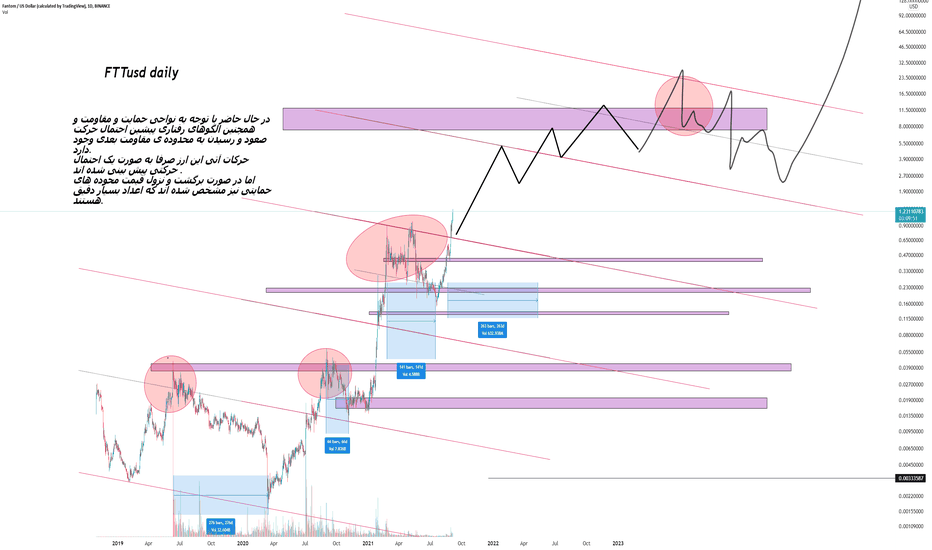
fttusd daily scaleAt present, according to the areas of support and resistance, as well as previous behavioral patterns, there is a possibility of moving up and reaching the next resistance range.
Future movements of this currency are predicted only as a moving probability.
However, in the event of a return and a drop in the price of the support areas, it is also clear that the numbers are very accurate.
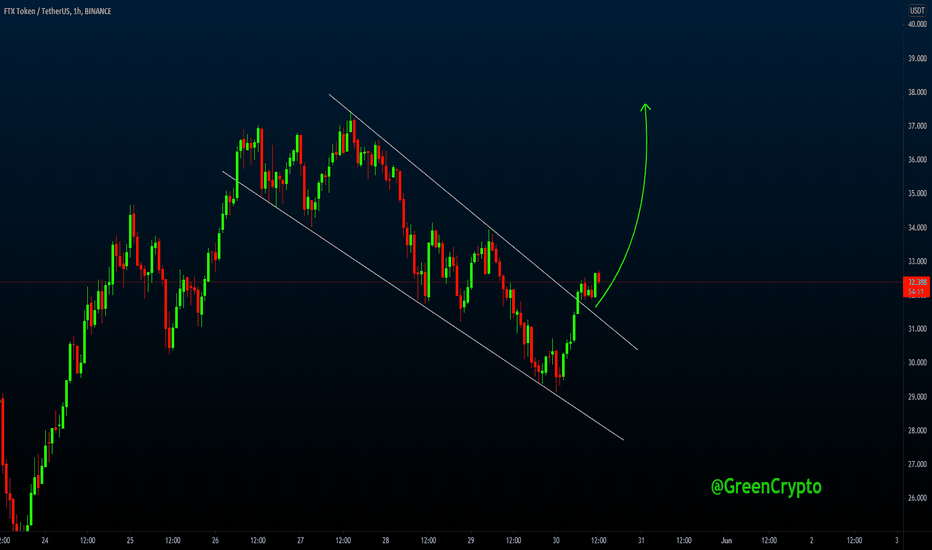
FTTUSDT(1H CHART) Channel BreakoutFTTUSDT(1H CHART) Technical Analysis Update
Channel Breakout
FTT/USDT currently trading at $32.3
Buy-level: Above $32
Stop loss: Below $29.5
Target 1: $34
Target 2: $37
Target 3: $39
Max Leverage: 2X
ALWAYS KEEP STOP LOSS...
Follow Our Tradingview Account for More Technical Analysis Updates, | Like, Share and Comment Your thoughts.
