FTTUSDT at the Edge! Breakdown or Massive Breakout?📌 Overview: A Rebirth from the Dead Zone
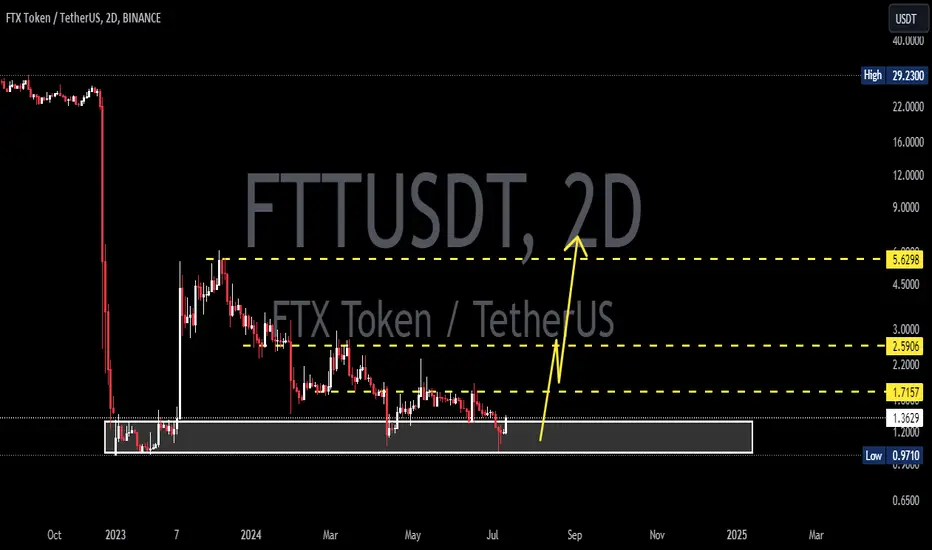
FTT/USDT is currently in one of its most technically compelling phases in the past two years. After suffering a catastrophic 98% crash following the collapse of the FTX ecosystem in 2022, price action now shows signs of long-term accumulation at a historically strong demand zone — potentially forming a solid base for a medium to long-term recovery.
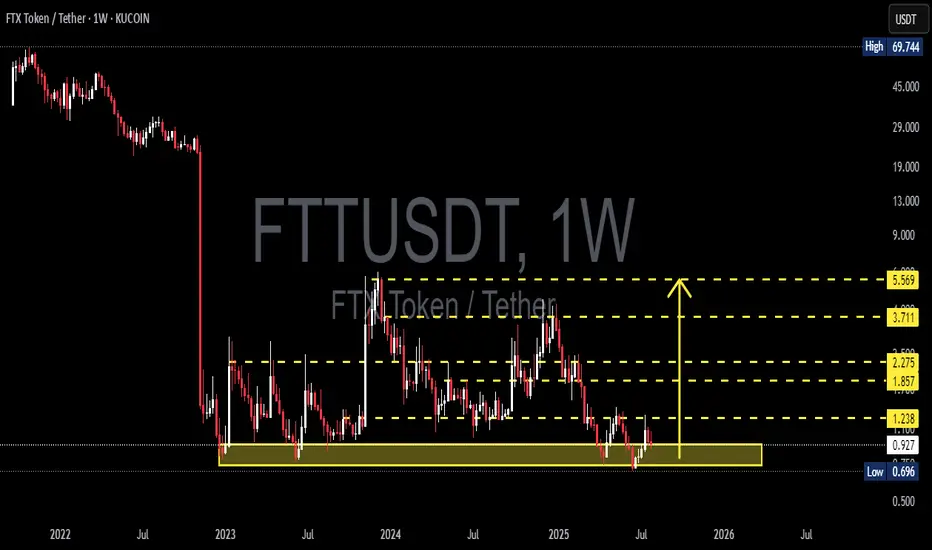
The crucial support zone between $0.70 and $0.90 has been tested multiple times since late 2022 and has consistently held against extreme sell pressure. This suggests the presence of a strong historical demand area. Now that the price is once again reacting bullishly from this zone, the door is opening for a potential technical rebound.
---
🧠 Forming Pattern: Accumulation & Bottoming Structure
1. Base Accumulation Range:
A long period of sideways movement after the major crash.
Indicates exhaustion of selling pressure and possible stealth accumulation by smart money.
2. Potential Double Bottom or Rounded Bottom:
If this rebound holds, a double bottom could be confirmed with a breakout above $1.238.
A rounded bottom formation could signal a major reversal rally if backed by volume and catalysts.
---
🟢 Bullish Scenario (Reversal in Progress):
If buyers hold the current support and push through resistance levels:
🔓 Break above $1.238 = key reversal confirmation.
🚀 Potential bullish targets:
$1.857 – Previous minor resistance.
$2.275 – Former breakout zone.
$3.711 – Key structural level with historical liquidity.
$5.569 – Major psychological and technical target.
Strong confirmation if the breakout is supported by volume and a full-bodied weekly candle.
---
🔴 Bearish Scenario (Further Downside):
If price fails to hold the support zone:
📉 A breakdown below $0.696 would invalidate the bullish setup and could lead to:
New price discovery below $0.50
A potential “death spiral” if sell volume increases rapidly.
This scenario is extreme and would heavily depend on broader market sentiment and the future of the FTX recovery process.
---
🧭 Key Levels & Technical Insights:
Element Details
Strong Demand Zone $0.70 – $0.90 (multi-tested since 2022)
Bullish Trigger Level Break & retest of $1.238 with volume
Reversal Targets $1.857, $2.275, $3.711, and $5.569
Bearish Breakdown Loss of $0.696 = potential for new lows
Early Momentum Current bounce suggests possible start of reversal
---
💡 Final Thoughts:
> "FTT is no longer in a panic phase — it’s in a decision phase: will it rise as a ‘Phoenix Token’ from the ashes of FTX, or fall back into obscurity?"
Given the technical setup and long-term structure, this could be one of the most pivotal moments for FTT. Traders and investors should watch this level closely — the next major move is likely to begin from this very zone.
#FTTUSDT #FTTAnalysis #CryptoReversal #AltcoinWatch #TechnicalAnalysis #SupportResistance #BullishSetup #BearishScenario #DoubleBottom
Fttusdtlong
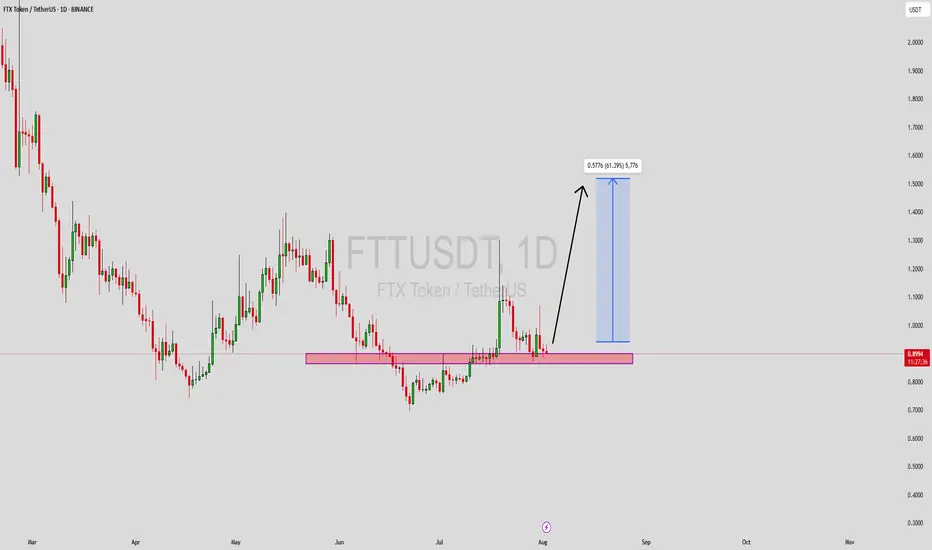
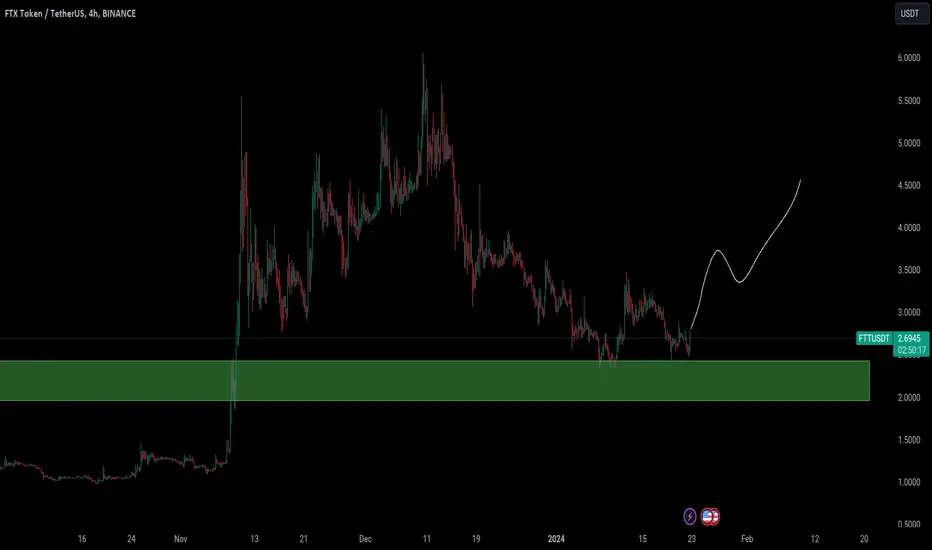
FTTUSDT Forming Bullish MomentumFTTUSDT is showing renewed strength with a clean breakout setup, supported by good volume and strong technical structure. The current chart reveals a clear horizontal support zone that has been tested multiple times and held firmly, indicating buyers are stepping in with confidence. After the recent consolidation, the price appears ready to move higher, potentially offering a 40% to 50% upside in the near term. This setup attracts attention from technical traders looking for confirmation through volume spikes and bullish candlestick formations.
What makes this chart setup even more compelling is the emerging bullish momentum following the reclaim of a key support area. The market has seen a steady accumulation phase, and the subsequent price action shows strength above the highlighted zone, suggesting a possible retest and continuation to the upside. With investor sentiment improving around FTX Token (FTT) and increasing market activity, the possibility of a significant rally becomes more likely, especially if price closes firmly above recent resistance levels.
Investors are taking interest in this project again despite past uncertainties, as the price action begins to signal recovery potential. The projected target from this setup points toward a measured move that aligns well with a 40%+ gain, assuming the broader market remains favorable. It's a promising opportunity for mid-term traders watching for bullish continuations backed by strong volume and sentiment.
If this breakout sustains, FTTUSDT could regain traction as a high-risk, high-reward play. Watching how the price behaves around the current support and near-term resistance will be critical for short-term traders aiming to capitalize on this potential upside.
✅ Show your support by hitting the like button and
✅ Leaving a comment below! (What is You opinion about this Coin)
Your feedback and engagement keep me inspired to share more insightful market analysis with you!
FTTUSDT 1D AnalysisFTT ~ 1D Analysis
#FTT Buy gradually from here if you still have a Conviction on this coin with a short -term target of at least 15%+ from here.
FTTUSDT 1WFTT ~ 1W Analysis
#FTT Buy gradually from here with a short -term target of at least 20%+.
FTT/USDT: Preparing for a Potential BreakoutFTT/USDT: Preparing for a Potential Breakout
FTT/USDT is forming an interesting setup as it approaches a critical resistance level. The price has been consolidating tightly, indicating that a breakout could be on the horizon. This could provide a good opportunity for those watching closely.
Key observations:
- FTT/USDT is testing a major resistance zone, which has previously acted as a barrier. If the price breaks above this level, it could lead to a significant bullish move.
- Momentum is building, as indicated by improving RSI and MACD trends.
- A noticeable increase in trading volume will likely confirm the breakout and show strong buyer interest.
How to approach this setup:
- Wait for a 4-hour or daily candle to close above the resistance to confirm the breakout.
- Look for a potential retest of the broken resistance as support before entering to minimize risk.
- Monitor volume; a breakout with low volume may not sustain.
- Set a stop-loss below the breakout level to manage risk effectively.
Potential targets:
- First target: .
- Second target: .
Always remember to follow your trading plan, manage your risk, and stay cautious of fake breakouts. This analysis is for educational purposes only and not financial advice. Always do your own research.

FTTUSDT 2DFTT ~ 2D
#FTT It seems very clear this is an accumulation area. buy in stages. with a short term target of at least 20%++
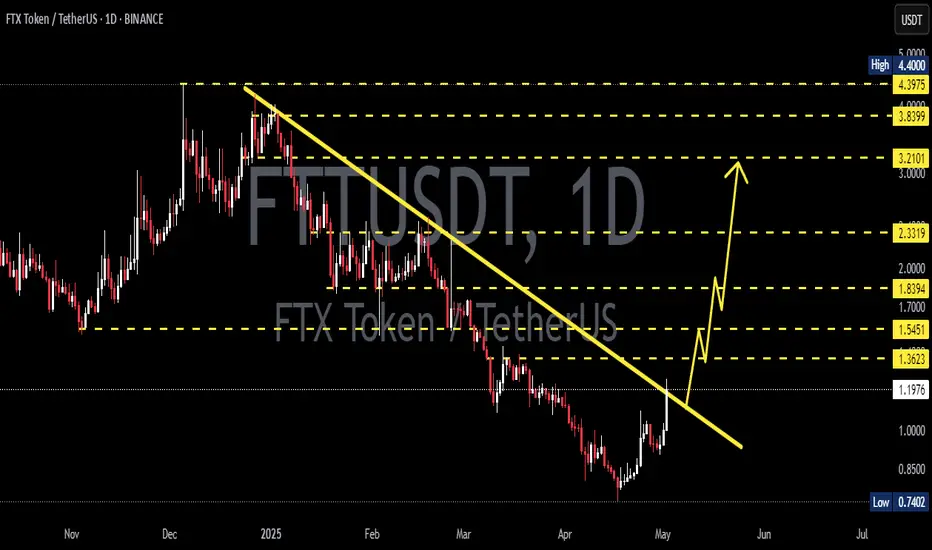
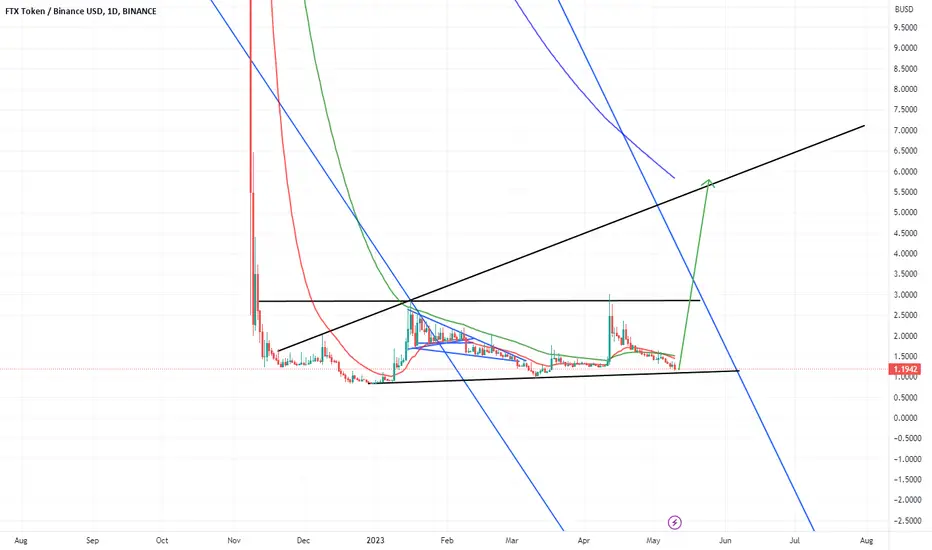
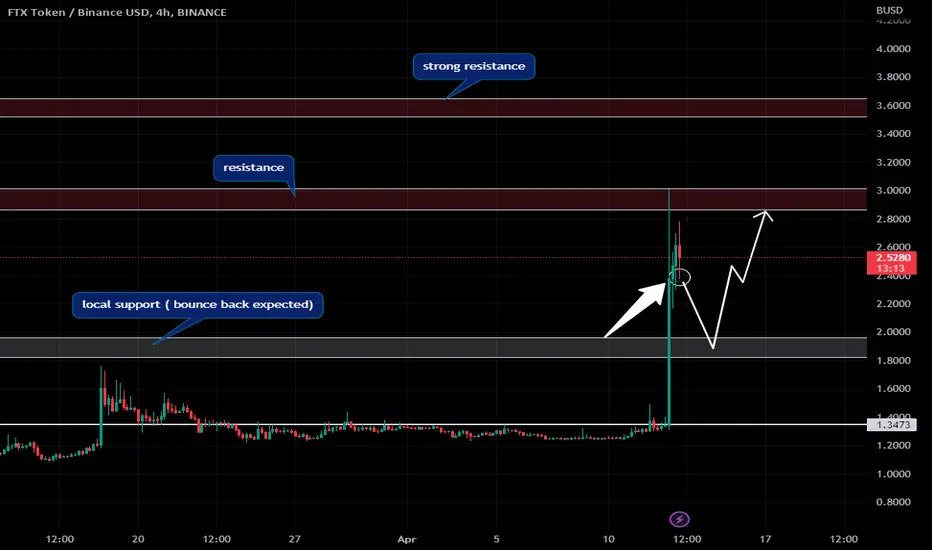
FTT Great setupWe can see a great setup on FTX Token. A classic break+retest setup of the main trendline, and i think we could see a rally till $2.8 in the next few weeks/months, that is a good 2x. Invalidation below local bottom

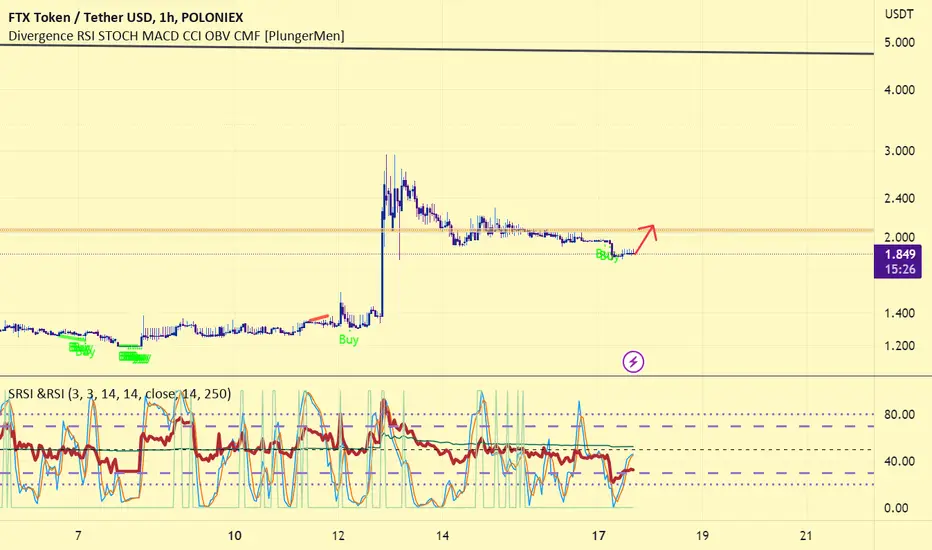
FTT: trade in renge📊Analysis by AhmadArz:
🔍Entry: 1.84
🛑Stop Loss: 1.72
🎯Take Profit: 1.95-2.05
🔗"Uncover new opportunities in the world of cryptocurrencies with AhmadArz.
💡Join us on TradingView and expand your investment knowledge with our five years of experience in financial markets."
🚀Please boost and💬 comment to share your thoughts with us!

Dont worry FTT moves like this First it drops
then ( Green Phase ): Move higher and higher to cover some last candles of drop (But this high will not touch halfway of dip)
Then ( RED phase ): those high are now going to become lows with same resistance and support levels
And when price action reaches the same level that we bottom of previous drop; another Drop starts 😉

FTT Support is holdingThe support zone i drawed for FTX Token is holding perfectly. I want to some some strength now, and a break above 3.30 USD could be a confirmation of a good pump. In the long term, i think this year we could see the price to pump well
$FTT 💰
FTX Coin try to pump weeks ago and now price is ranging.
We expecting bullish move in case we close above $5.57 in Daily TF
Will #FTT Be back ?

#FTT #FTX TokenAfter the recent pump, it is being corrected in the resistance range of $5, which has now formed a contraction pattern, which according to the momentum and upward guard, if it exits from the top and pullback to the trend, it can reach the range of $9 in the first step, and if Break to the $20 range and continue its growth.

FTX Token the rise of the phoenixFTT is pumping and showing good strength. After breaking a bull flag, is now sitting of h4 support and playing above daily support (3.68). If it will keep pumping, we can triple in price really fast, also considering BNB uncertainty

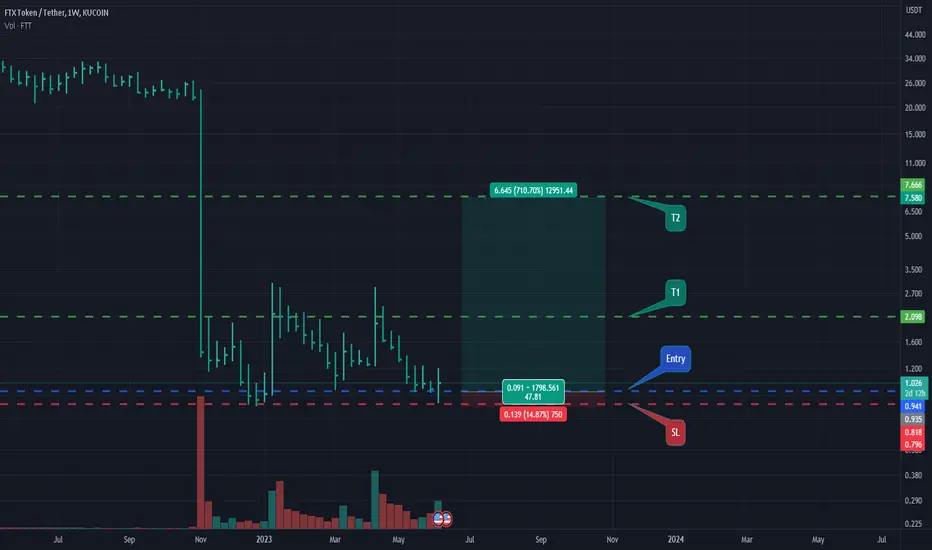
Hi, I see A very good Swing trade opportunityHi, I see A very good Swing trade opportunity
Risk Reward is very good
Some of you will say FTT is doomed, will I am a chart analyst, and there is a very good sign of accumulation in the chart.
The SL is around the corner (-15%) with almost 700% possible gain , so it worth the risk.
good luck every one
Awaiting regrowth FTTKUCOIN:FTTUSDT
With the investigations done in terms of time analysis, we determined two dates for the rise (green color) and two dates for the price drop (red color) in the chart.
We expect the price to start increasing when it reaches our target date.
Part of the chart is repeated from the past

FTTFtx relaunch in next 30 days. FTT will rise again and go to 5$.
They have on their hands almost all the debts that they owe.
Nobody expects such an outcome. Everyone thinks this is the end. But everyone is wrong.
Binance pretends that the token is on the verge of delisting) Binance is one of the largest holders of the token. And most of all are interested in restarting of FTX.
FTT an easy quick mini profitHere' s a mini opportunity for a mini move from FTT token. Momentum seems ready for a short time period. I don' t expect a huge pump but this may be profitable if BTC does not dump further. Pricing below 1.78 is the invalidation and SL of this scenario. Good luck!
Not financial advice.
FTTBUSD TOKEN PUMP 127% , NEXT MOVEFTT coin almost pump upto 127% in last 24 hours... and touch its resitance area at 3$.
failed to break its resistance area at 3$.
now possible we see again bounce back in ftt coin price from 2$-1.80$.
if you buy ftt coin few days ago around 1.20$ then book your profits and waite for correction.
if according to latest news ftx exchange relounch in Q2. then we see huge pump in ftt coin price in next 1-2 month.
i will invest 5-8% of my portfolio in ftt coin according to shared analysis.
if you want then invest at your own risk.
do your own resaerch before follow me.
follow me for latest updates about crypto.
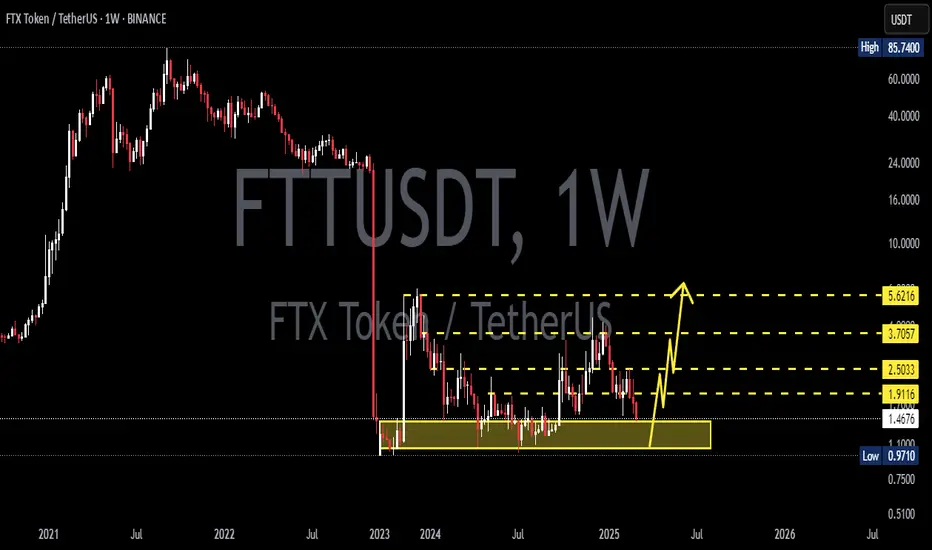
FTT - Are resumption purchases real?After all the news and events, the price of the asset has returned to its original accumulation. Maybe we will see a local rebound in the price range of 1-4, a re-accumulation and an exit with an excellent momentum after a long trading session.
If you liked the idea, please like it. That's the best "Thank you!" for the author 😊
P.S. Always do your own analysis before a trade. Put a stop loss. Fix profits in installments. Withdraw profits in fiat and make yourself and your loved ones happy.

FTT long or short Read this 🔥🔥🔥Binance CEO Promises to Help FTX Exchange with Liquidity and Hints of No Purchase.
On this positive news, the entire cryptocurrency market bounced up, and BNB adds +20% in 15 minutes and now market is red what should I do now

FTX Token (FTT) formed bullish BAT for upto 16.50% pumpHi dear friends, hope you are well and welcome to the new trade setup of FTX Token ( FTT )
Previously we had a nice trade of FTT:
Now on a 4-hr time frame, FTT has formed a bullish BAT pattern.
Note: Above idea is for educational purpose only. It is advised to diversify and strictly follow the stop loss, and don't get stuck with trade

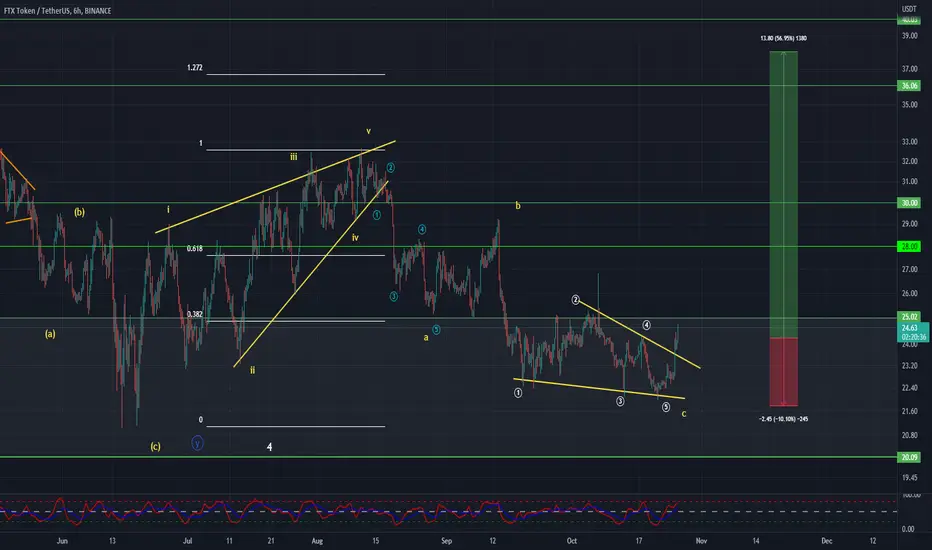
FTTUSDT Analysis (midterm setup)Hello friends.
Please support my work by clicking the LIKE button👍(If you liked). Also i will appreciate for ur activity. Thank you!
Everything on the chart.
Entry: market and lower
Target: 30 and ~35
after first target reached move ur stop to breakeven
Stop: ~21.7 (depending of ur risk). ALWAYS follow ur RM .
Risk/Reward: 1 to 5.5
risk is justified
Good luck everyone!
Follow me on TRADINGView, if you don't want to miss my next analysis or signals.
It's not financial advice.
Dont Forget, always make your own research before to trade my ideas!
Open to any questions and suggestions.
FTT/USDT - LONG ---> DOUBLE BOTTOM ----- Welcome, dear followers! -----
- Here is my trading methodology. I trade with a normal system and analysis of resistance and support, as well as price reversal patterns.
- For the record, I do not place a stop loss within my trades. So that I only risk 1.5% of my total capital in order to support the loss due to a price reversal against me.
- If a price reversed against my expectation and touched the drawn line r3, then I transferred targets to the entry point and waited for the price to close at it with a loss equal to almost zero.
- Today's deal is shown in the chart, and here are the entry and exit points below.
-- Support me with numbers and follow up on my account for other deals in the future. Thank you for coming to this part.
---------------------------------------------------------
⚡️⚡️ FTT/USDT ⚡️⚡️
Exchange: Binance Futures
Trade Type: Breakout (Long)
Leverage: Cross (1.0X)
Entry Orders:
1) 25.836 - 100.0% (84.3296 USDT)
Take-Profit Orders:
1) 27.194 - 70.0%
2) 28.471 - 25.0%
3) 30.623 - 5.0%
Trailing Configuration:
Stop: Breakeven -
Trigger: Target (1)
