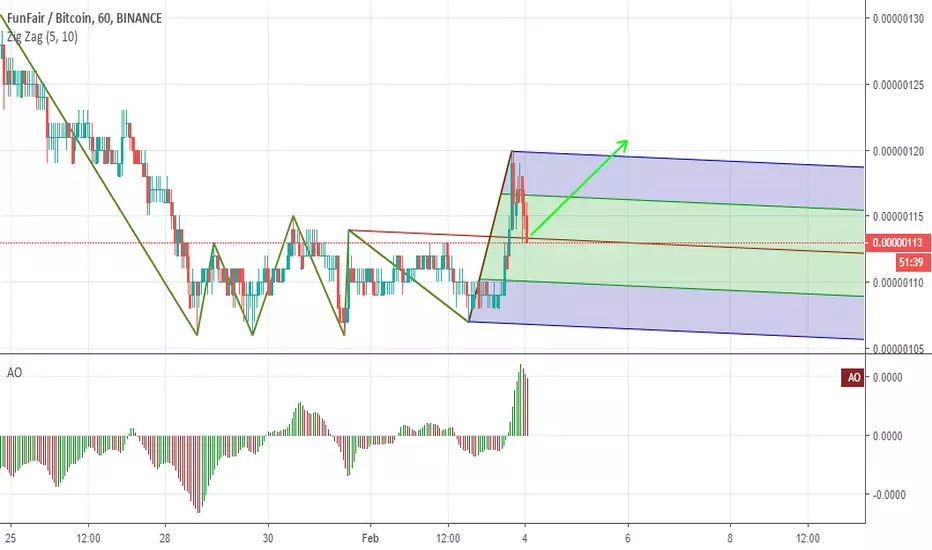
FUNBTC 1HR 1 more up maybe???W2 retrace almost .786 therefor w4 will retrace a lot less.
stop loss .110 sat
******just a guy who is playing*****
FUN

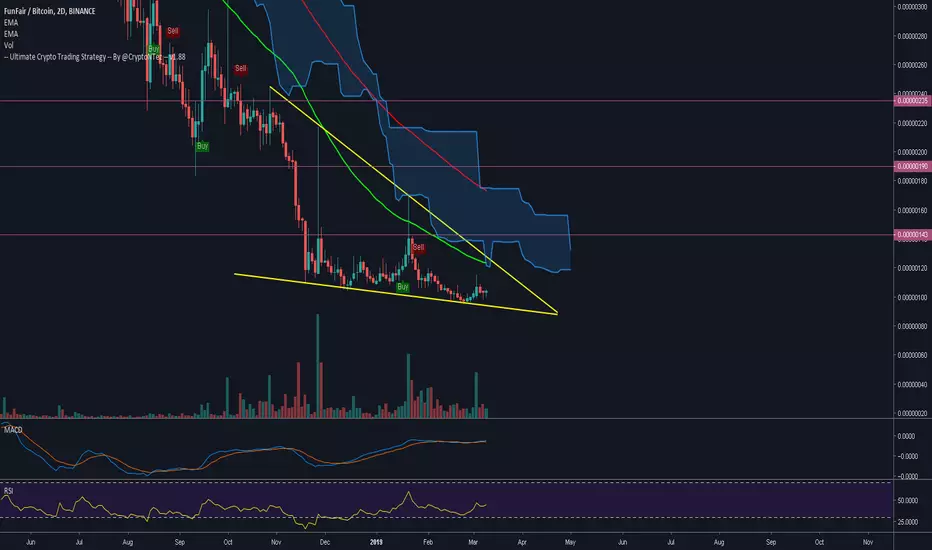
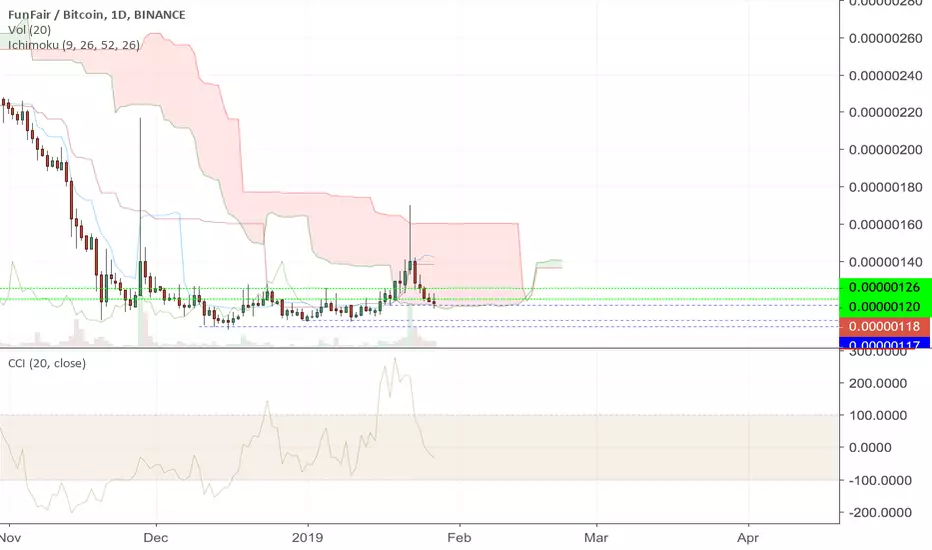
Falling wedge /Symmetrical triangle in the coming weeks.$FUN Nothing to do here for now, but a falling wedge/ symmetrical triangle could be forming in the upcoming weeks.
EMA50 is a great resistance that rejected price several times on the 1D chart.
For now just wait and set alerts for when it happens. #FUN

Are you having FUN yet?FUN
FUN is absolutely heating up. We visited a new all time low at 95 sats and have torn past 100 since. I am looking for 140-150 range to sell.

Funfair FUN it looks like not want to push down more than 95ish.
worth to give it a try.
Buy 100ish.
Sell 130ish.
Stop under 95.
Watchout cuz this coin seems to have some whales on it and can be easily pushed up and down, like many times in the past.
Keep an eye on BTC as always.
Happy Tr4Ding !
FUN/ETH. Something Fun May Happened Soon!Bottom is here. FunFair 2019 Roadmap has been updated. A few signals could shown soon a potential reversal. Let's see if buyers are around!
Note: This is not a prediction but only my own analysis following time spending in TA's researches (I'm student). There are no trading advice here, except >>> don’t invest more than you can afford to lose.

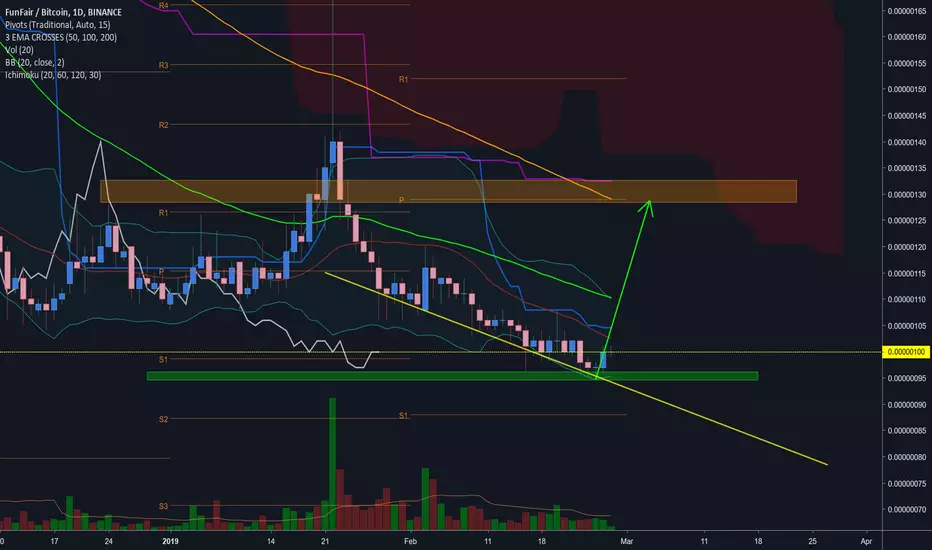
FUN Peeking Out 1DSeems like FUN is breaking out of the trend resistance, this move could go as far as 10% price increase.

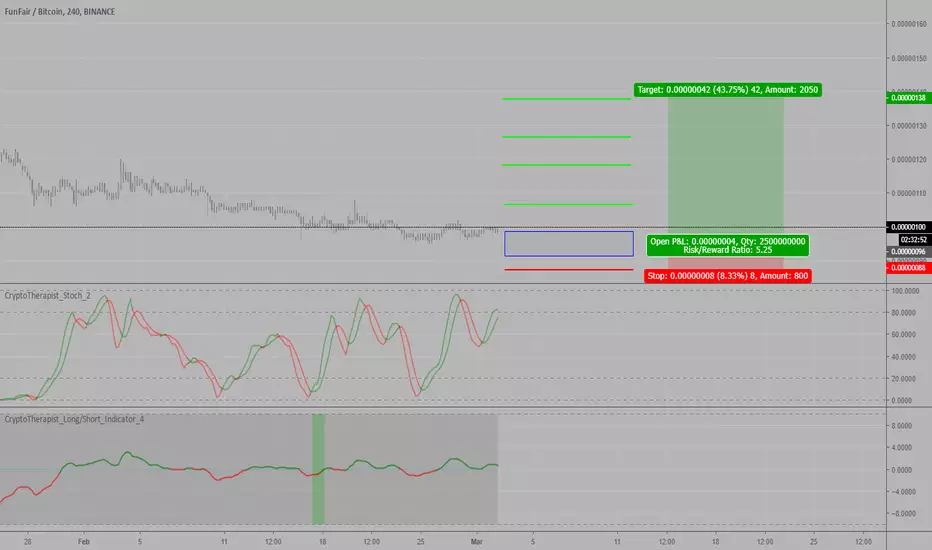
FUN-BTC Long Trade PlanCommodity : FUNFAIR
Trade Type : LONG
Trading Against : BITCOIN
Entries : Double-UP Entries throughout the Buy Zone
Profit Taking : 25% at each TP point
Profit Locking : Move SL to break even once TP1 is hit, to TP1 once TP2 hits, to TP2 once TP3 hits and so on
Duration - 1 Week
Investment in trade : 10% of the total Trading Balance.
Prospective Profit : 11% to 43%
Prospective Loss : 8%
RRR : SL to TP1 is 1.38, SL to TP2 is 2.75, SL to TP3 is 3.75 and SL to TP4 is 5.25
Buy Zone/TPs/SL price points are marked in the chart as follows
Greens - Profit Targets (TPs)
Blue - Buy Zone (Entries)
Red - Stop Loss (SL)
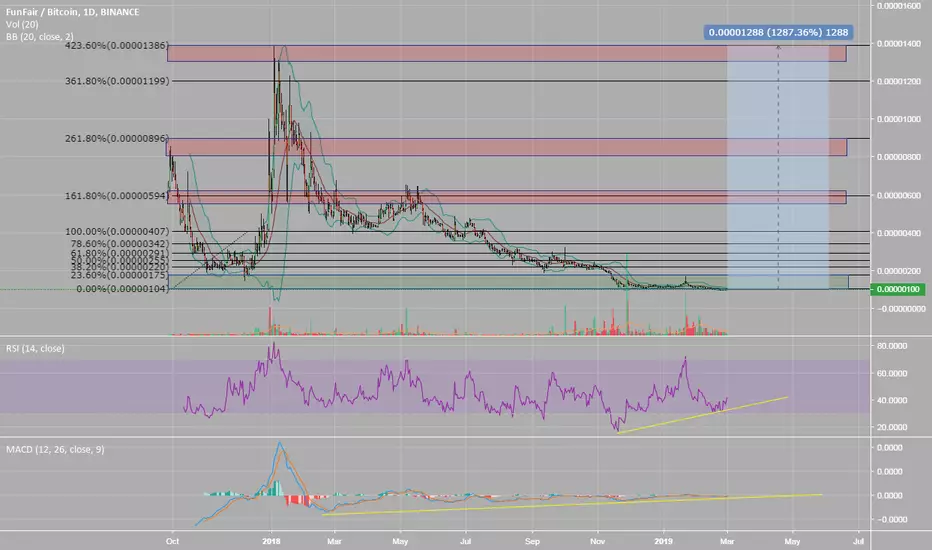
FunFair ($FUN) - up to 1287% PPT! Long term trade.$FUN is definitely in a buy zone right now. It's a good time to accumulate.
It shows bullish divergence on daily MACD and RSI.
Green and below - buy. Red - sell.
It's not a financial advice.
Trade carefully and good luck!
Avoid for now!$FUN (requested), Hot potato asset. Ascending triangle broke to the downside(ouch). For now, You should avoid this asset, falling at ATL (falling knife), without any signal of reversal. Neither any events on calendar that can turn it to the other side. #FUN

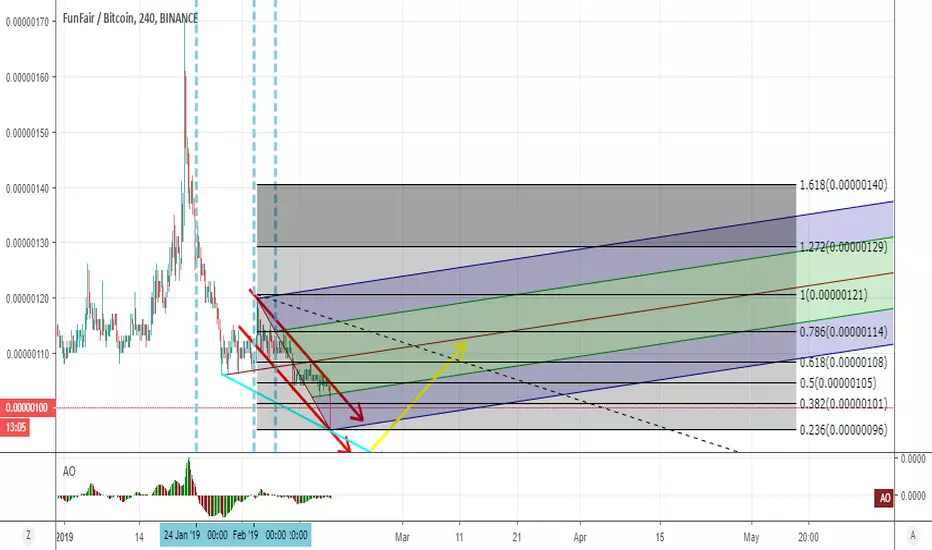
Daily Bullish Signal $FUN #FUN (18 Feb 2019)RED ARROW indicates the EXPECTED Time and Targets
Level Stoploss point up to maximize profit and reduce risk
I'm working all the time, even in Bearish Market

FUNbuy : 92~100
target1 : 96
target 2: 111
target 3 : 121
target 4 : 140
target 5 : 192
stop : under 90
FunFair Completes Its Retrace (Round 2 Profits +400% PP)We have an active trade for FunFair (FUNBTC) which already generated nice profits, 25%+, and is back within buy in range, ready to generate more profits again.
After the last wave, the price fully retraced and after reaching support it jumped in a nice way.
The volume is building up, not yet good enough. But a break above EMA10, assures us that profits will come.
Here is our trade, so you too can join and participate:
Remember that patience is key, if you want to be a winner in this game.
Namaste.

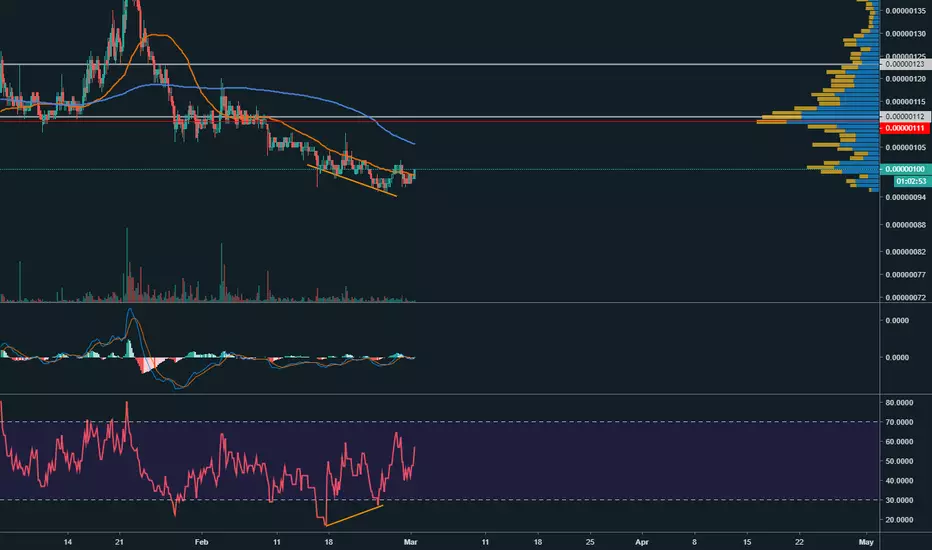
FUN RSI divergencethere is positive RSI divergence and it might become double bottom formation.
I will sell my coins if a candle close under 112 satoshi on 4h chart.

FUN is not done. Could it soon run?A test of the lower supports cannot be excluded if it falls out of the kumo again...
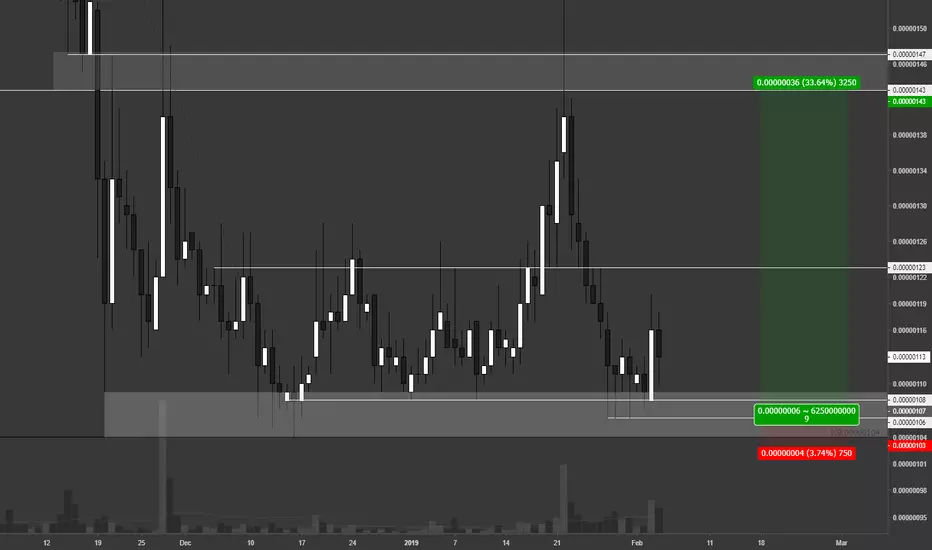
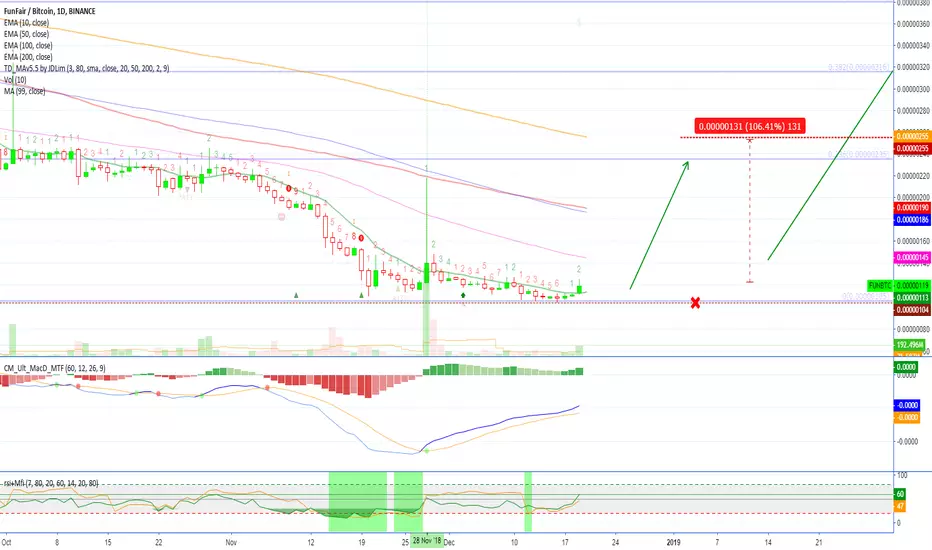
[FUNBTC][100% PP] FunFair Looking BullishWe have a bullish chart for FunFair (FUNBTC).
Hit LIKE, to start reading these signals and open a trade.
FunFair Analysis by Alan Masters
We have a bullish RSI and the MACD which is staring to curve up strong.
Very strong reversal signal on the 28th November.
So it is normal to have a break above EMA10 with strong volume after that.
Can move in a matter of days.
These are early signals but they all point to an upcoming breakout to the up side.
Signals can be invalidated, as the chart changes with every passing hour.
Continue reading for trade set up.
FunFair Trade Idea - AMT
Buy in: 110 - 125
Targets:
(1) 145
(2) 190
(3) 230
(4) 300
Stop loss: Close daily below 98.
Capital allocation: <10%.
I CAN GO HIGHER
Limits don't exist to those that want to achieve.
Great effort and mental focus is needed for the plan to work.
Intelligence isn't as necessary as commitment, faith, respect, honor and trust.
The part that is physical needs to be entertaining for your soul.
After long years of going comes a day for rest.
A can go higher...
Thanks to the training I do everyday!
Namaste.
That will be FUN!
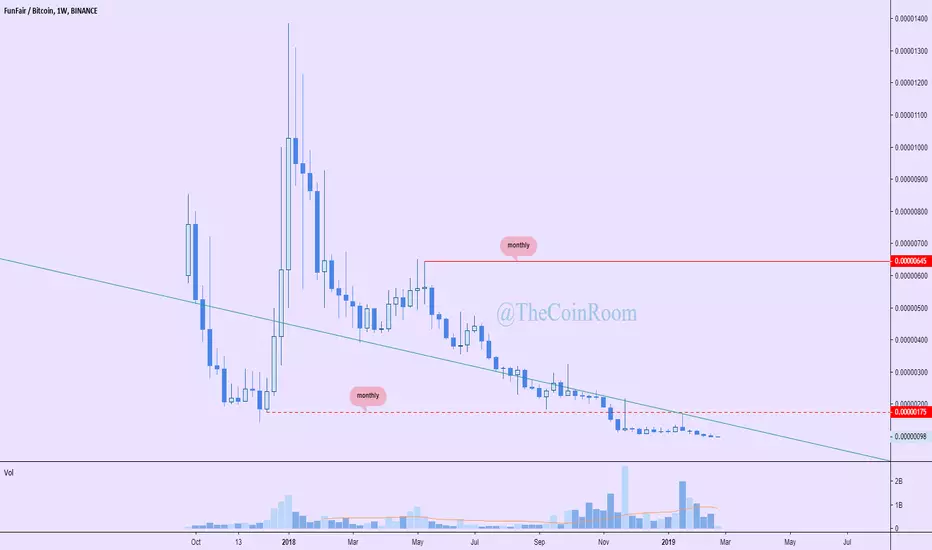
That one is a golden opportunity! Week timeframe shows it all. Same as with XLM, if we go up, it will be huge. This narrow accumulation area shows that future move will be very big and I'm targeting for +300% profit.

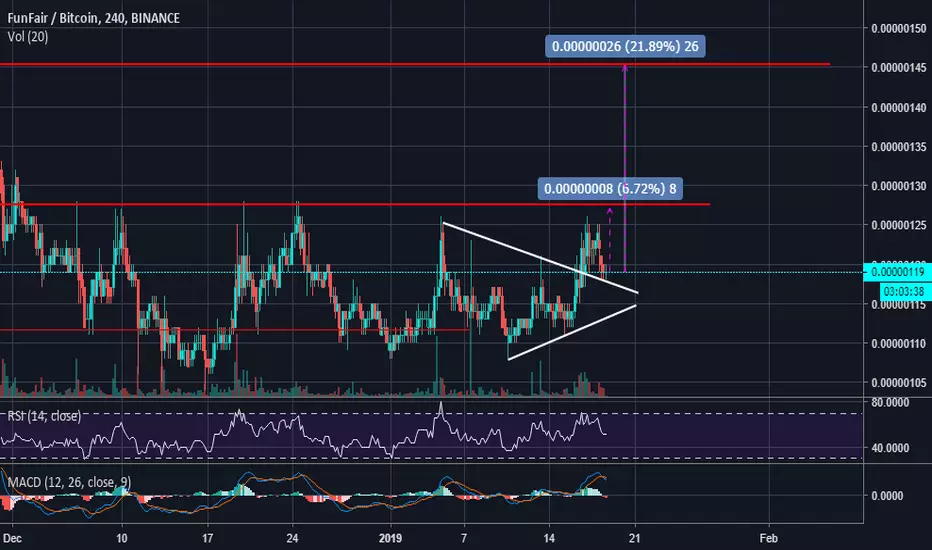
Break-out attempt ongoing on FUNBTC?Previously every time CCI got so high, the price retreated. However, after several attempts to tackle the resistance, could this one power through and continue (either with a re-test or without)?
If so, I'm eyeing 100 - 300%
Note: I am not buying the break-out, since I already have a position from the bottom level accumulation - see my previous post:
bit.ly
Therefore, even if it turns-out to be a fake-out and price retreats, I intend to wait for the next attempt, unless the price starts sinking below pervious lows...
