FUN
familiar movement?i just write to note to history.
I don't think megabull could appear in 2019 as many analysts think.
Then can we see a familiar distraction tactic again?
p.s i think there is a bug with tradingview's scaling. when i publish "normal" scale the chart is going to empty space of dip. please set the chart scaling to AUTO

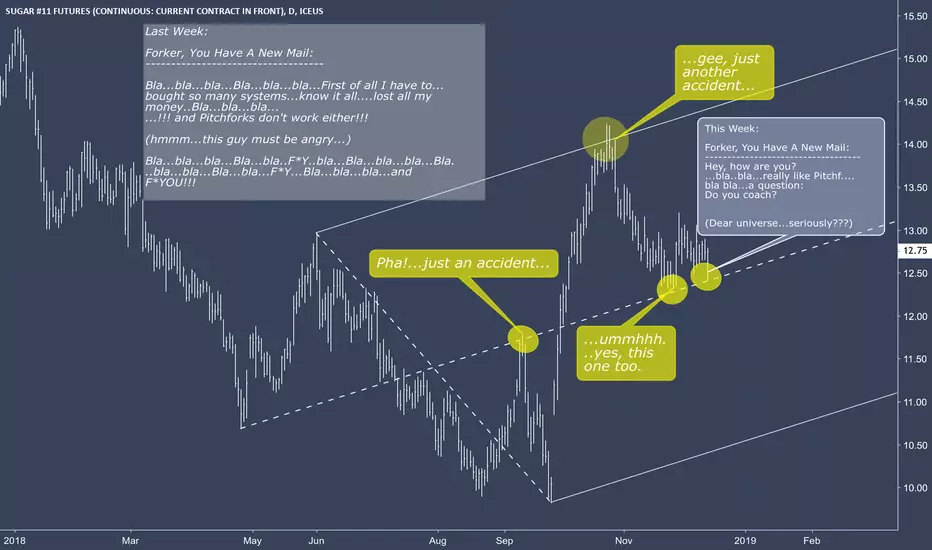
The mood chart for Bitcoin and the restThis started out as a joke about a week ago but I think it has proven to be a rather accurate description of the mood in cryptocoin markets and how many of you probably feel when looking at those convoluted charts with hundreds of indicators - all showing what happened, none telling the future.
NB! This chart can and will be used against you in coming days and maybe even months. Be aware of sudden changes.

ABSOLUTELY SCRUMPTIOUS Bitcoin Price and Time Analysis Hey guys! Happy mid-December and welcome to the start of another exciting week in crypto. I hope these times of wonderful volatility have been good to you all. I promised you guys a Bitcoin analysis a few days ago over on my highly successful ETH chart that I'll link below, but I didn't get round to it because I didn't really have anything to say which hadn't already been said by some of the other great analysts here on TV. Now we've seen a nice move upwards, I think I got something a little different for you guys.
If I can stop you getting distracted by the pretty colours for a moment, I have a quick explanation of why I'm analysing the chart in this way. Many people overlook that time plays as much into technical analysis as does the price. Look at any price chart and it's got 2 axis, not just price. The reason I'm telling you this is that the top of this bull flag is a major trendline from the past month. Of course time relates to this, otherwise it could have hit that level in the past and not been resistance, as those lines wouldn't have lined up! Follow that dotted line with your finger... Yes, you see, it hits it exactly and makes a triangle shape plotted by price and time. Because many people are looking at this trendline over a decent amount of time, I think we can take this one step further and factor in the time taken with our fibonacci lines.
Now, I love fibonacci and I noticed that this bull flag we've currently formed has a very curious shape, and how it's noticeably different for the different exchanges. But I noticed something very interesting on this bitfinex chart when you connect the lines to the top of this bull flag using the circle fibonacci tool.
What do you notice? Firstly, this chart looks absolutely beautiful and I want to eat it like a whole load of flavours of Christmas-y ice cream that have come to party over at Bitcoin's house. But secondly, the circles overlap with a lot of the key levels that many traders are currently talking about, and it might give us some insight to the timeframe if/when we reach them. I've highlighted these levels in yellow on the chart. One could imagine an Elliot wave type structure forming through these points at key levels that many traders are waiting for. This isn't to show that it must hit these exact levels, but just an idea to show a possibility of WHEN they might be hit. I didn't think I'd need to explain the levels simply because it seems like everyone is eyeing them for bitcoin at the moment and you need to give the time piece of the chart some love as well <3
Let's see where this gets us! I'll be studying this type of analysis in the future so stay tuned by following my page because I have much more to come. If you saw my ETH analysis you'll know that it's been going really well for these more radical kinds of analysis which nobody else is touching. So you should follow me on Tradingview and hit like if you want to see more. I'll be updating this chart often with some new input and to see how this develops because I think this is a very interesting and underused method.
Enjoy the holidays!
-Etch
ETH trade:
XLM trade:

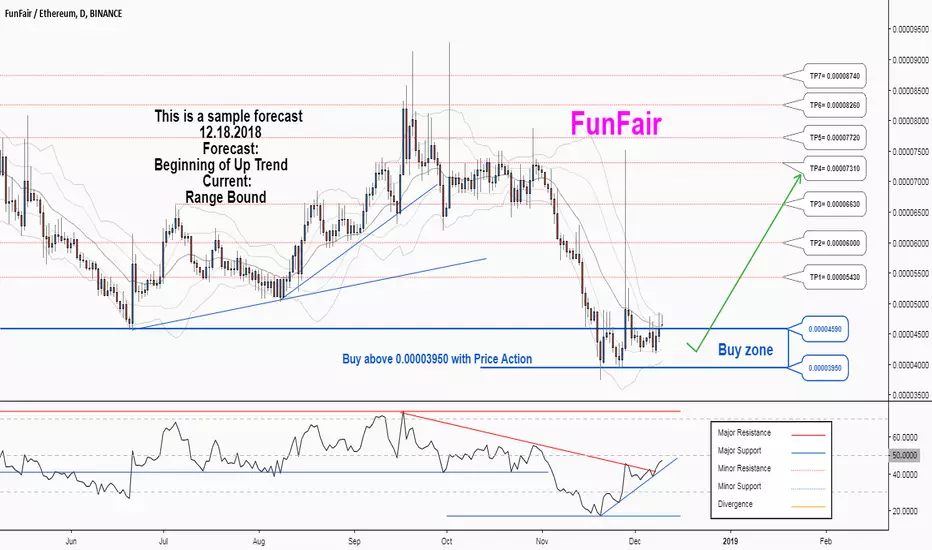
There is a possibility for the beginning of an uptrend in FUNETHTechnical analysis:
. FUNFAIR/ETHEREUM is in a range bound and the beginning of uptrend is expected.
. The price is above the 21-Day WEMA which acts as a dynamic support.
. The RSI is at 47.
. The RSI downtrend is broken, so the probability of the resumption of an uptrend is increased.
Trading suggestion:
. There is a possibility of temporary retracement to suggested support zone (0.00004590 to 0.00003950). if so, traders can set orders based on Price Action and expect to reach short-term targets.
Beginning of entry zone (0.00004590)
Ending of entry zone (0.00003950)
Entry signal:
Signal to enter the market occurs when the price comes to " Buy zone " then forms one of the reversal patterns, whether " Bullish Engulfing ", " Hammer " or " Valley " in other words,
NO entry signal when the price comes to the zone BUT after any of the reversal patterns is formed in the zone.
To learn more about " Entry signal " and the special version of our " Price Action " strategy FOLLOW our lessons:
Take Profits:
TP1= @ 0.00005430
TP2= @ 0.00006000
TP3= @ 0.00006630
TP4= @ 0.00007310
TP5= @ 0.00007720
TP6= @ 0.00008260
TP7= @ 0.00008740
TP8= @ 0.00011900
TP9= Free
Let's have some fun with Bitcoin ! #toomuchstupidtargetsoutthereHope this idea will inspire some of you !
Don't forget to hit the like/follow button if you feel like this post deserves it ;)
That's the best way to support me and help pushing this content to other users.
Kindly,
Phil

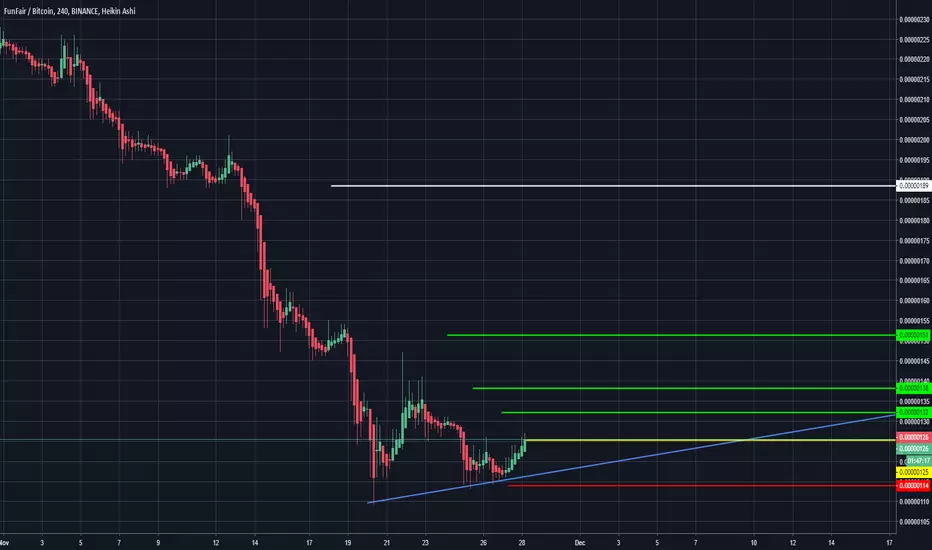
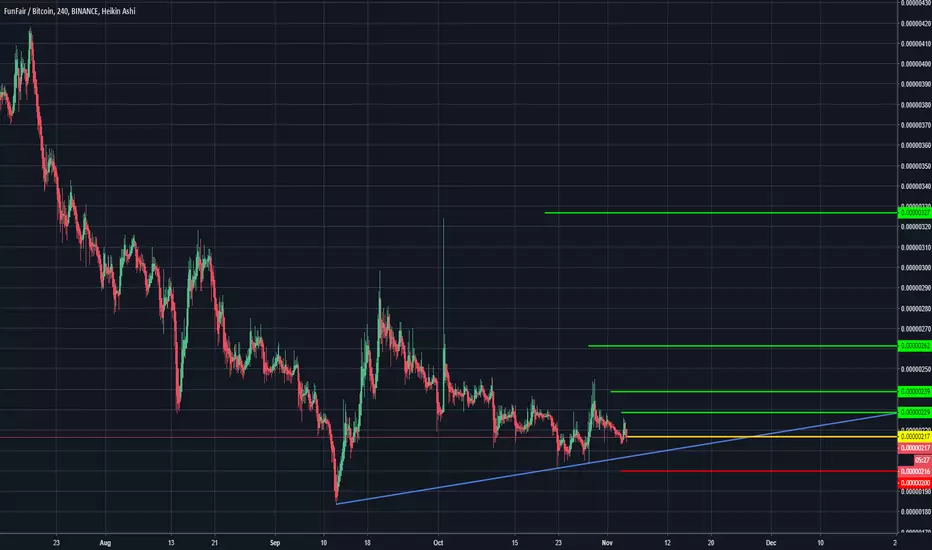
FUN Trading AdviceBuy Price: Yellow Line
TP: Green Lines
Moon: White Line
Support: Blue Line
SL: Red Line
Invest Suggestion: 5-10 Percent
Profit Expectations: 5, 10 or >20 Percent
Just hold and watch. Sell while you get some profit. Good Luck!
Looks Good? Leave a like, share and tell me in comments if my trading advices are working for you.
Thanks for visiting.
FUN Update - BottomedLooks like FUN had bottomed. Price will retouch the monthly low again followed by sideways price action and MOON!
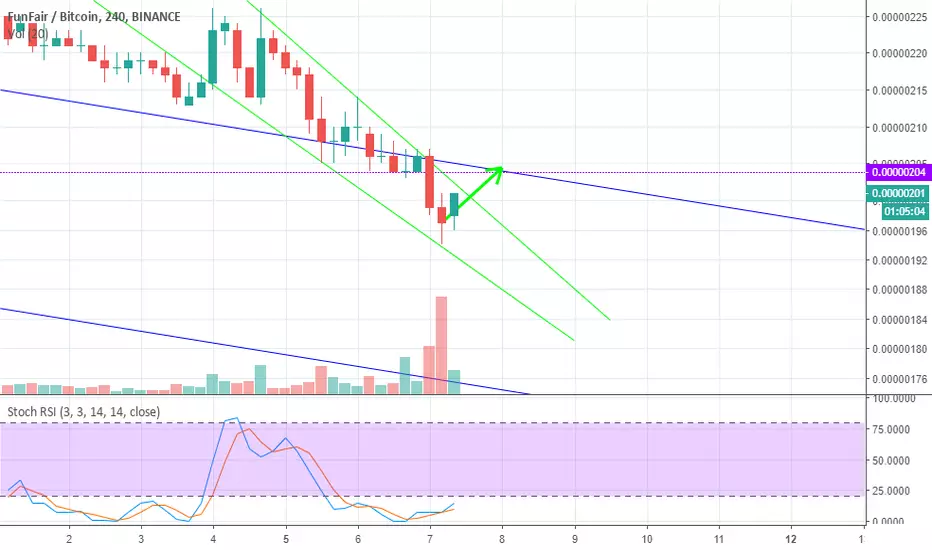
[FUNBTC][66.66% PP] FUNFAIR TRADE SIGNALFunFair
Buy in: 0.00000190 - 0.00000200
Targets:
(1) 0.00000250
(2) 0.00000270
(3) 0.00000290
(4) 0.00000325
Stop loss: Close daily candle below 0.00000183.
FULLY UPDATED 11-NOV.
Namaste.

OMXH25 idea - 1hr chart. Valid for 31.10.-08.11.2018.Self explanatory idea. Publishing for the sake of watching and pondering where this might go.
Not trading advice, DYOR.

FUN - Update (begin accumulating)FUN looks like it will touch its monthly low of 143 Sats.
I honestly don't see it going any lower due to the RSI...its incredibly oversold.
In my opinion begin accumulating now. I bought at 190 and 180.

FUNBTC SHORT PROFITBuy Price: Green zone
Profit: Targets on the chart
Support: ( -0.618 FIBO Line )
SL: 163 sats ( -0.618 FIBO Line )
Invest Suggestion: 20 Percent
Profit Expectations: - 4,5 - 9 - 13,5 Percent
Just hold and watch. All targets will be reached in a few days.
Sell when you got some profit, according to your way of trade.
I am sure, you will be get nice profit. Good Luck!
FUN is extremaly oversold, it's close to the historical low and is in down!!!! Sooner the EMA's will cross each other and we will have a growth confirmed!
Looks Good? Leave a like, share and leave a comment.
Please ask me for any coin address to make a donation.
Thanks for visiting.

FUNFAIR accumulation!
Funfair has been in accumulation for a few weeks now and could be set for some massive gains
At the end of the year, FunFair will be releasing comprehensive operator reporting and administration tools
We seem to have formed a double bottom and could move up from here
EMAs are still pointing down and price has been unable to break above so far
A push to the resistance zone above is very doable and breaking the second target could see price rise quickly
Thanks guys!

FUN - Hit monthly bottomFUN just hit its monthly bottom.
From history price action, FUN was being accumulated for 3 months in 2017 (November - January) where it then went parabolic, up 800%.
This looks like a good long term hold. If you want you be in and out, i have the short term sell targets which are the resistances as shown in the wedge.
:)

FUN FUNFAIRDouble Bottom. indicators turning green.
Buy now 200ish.
Sell before 240Sats.
Stop Loss 190.
Happy Tr4Ding !

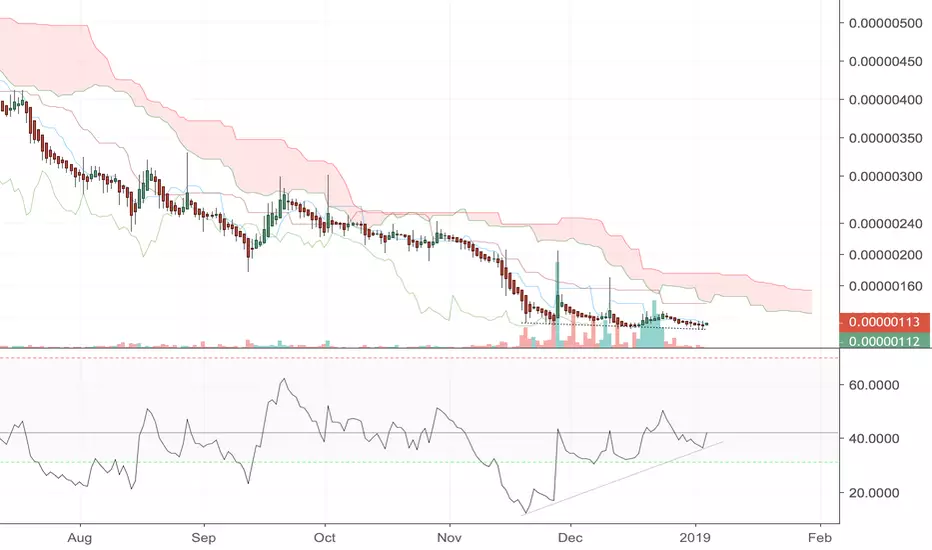
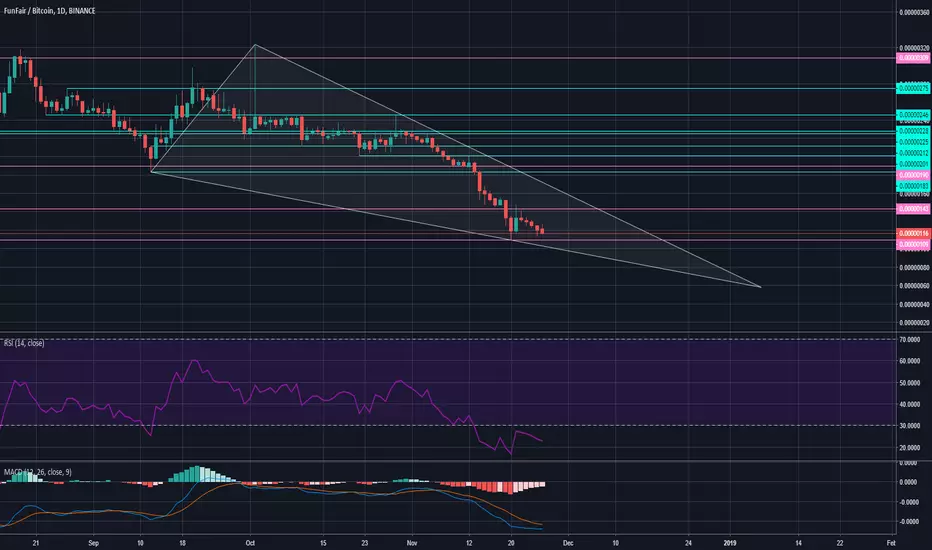
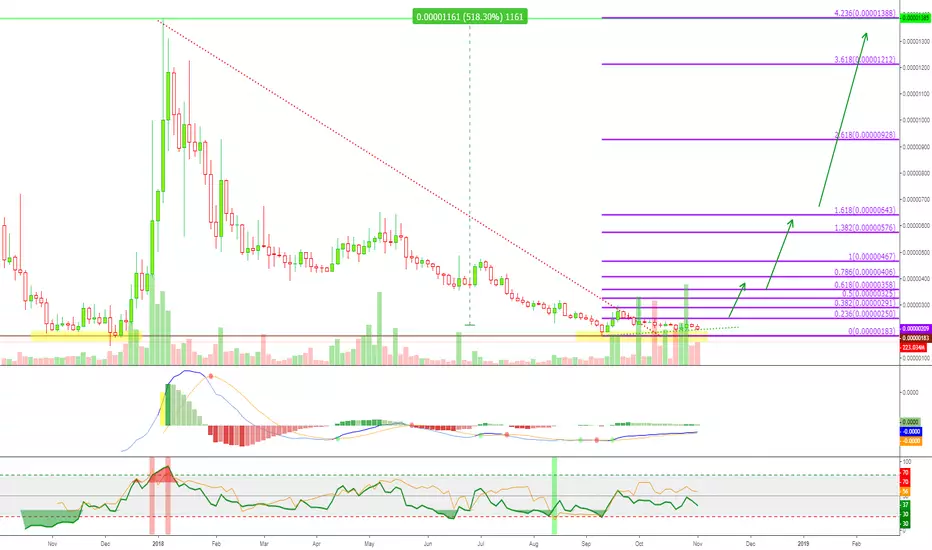
[FUNBTC] FunFair LONG [500% PP]FunFair (FUNBTC) on the weekly time frame:
- First let’s start with the candlesticks. On the 10 Sept. week, marked purple, we have a hammer candle, followed by a high volume inverted hammer on the 1 Oct. week. These are both reversal signals when they show up at the bottom of a trend.
- You can see the red down trendline, which is no longer holding the price.
- The brown line is where FUNBTC found support, it coincides with late 2017 prices before the bull run.
- MACD bullish crossover with changing volume (red to green) and RSI is sitting on the lows, sellers are exhausted.
- Still trading below EMA10, FUN is getting ready to move in a matter of weeks or days.
- Let’s get started with a profitable trade. This is a solid altcoin that has generated good profits for us in the past.
FunFair Trade Instructions
Buy in: 0.00000200 – 0.00000220
Targets by Alan Masters:
(1) 0.00000268
(2) 0.00000325
(3) 0.00000406
(4) 0.00000467
(5) 0.00000576
(6) 0.00000643
(7) 0.00000800
(8) 0.00000928
(9) 0.00001212
Stop loss: Close weekly candle below 0.00000183.
Capital allocation: <15%.
HAVING FUN IS GOOD FOR THE SOUL
Having fun is medicine for the soul.
Laughter can heal your emotions.
Sharing while enjoying can rapidly extend your growth.
So once in a while when you are working, take a strong break and always remember to have some fun.
Namaste.
FUN Trading AdviceBuy Price: Yellow Line
TP: Green Lines
Moon: White Line
Support: Blue Line
SL: Red Line
Invest Suggestion: 5-10 Percent
Profit Expectations: 5, 10 or >20 Percent
Just hold and watch. All targets will be reached within 24 to 72 hours as my prediction. Moon can take >15 days. But it's recommended to hold it for 6-7 days if any target not reached. Sell when you got some profit. I am sure, you will be get nice profit. Good Luck!
Looks Good? Leave a like, share and tell me in comments if my trading advices are working for you.
Show your love.
Please ask me for any coin address to make a donation.
Thanks for visiting.
Gambling or just FUN? FUN / BTC analyticsBUY: 0,00000170 - 0,00000176
SELL: 0,00000280
STOP-LOSS: 0,00000168
Support: 0,00000169
Resistance: 0,00000221
The FunFair project makes online casinos more accessible for both casino owners and players. Thanks to blockchain technology, the platform allows you to manage casinos regardless of location. The platform also provides unparalleled transparency and player protection.
We have already considered this asset and are now updating the analytical findings. Asset’s rates are falling and, most likely, it will update the current minimum, formed at the level of 0.00000183. The purchase zone is within 0.00000170 - 0.00000176. When the price approaches this range, it is necessary to observe the speed of change of the rate. If it changes fast, the probability of breaking through the support level of 0.00000169 is high and approaches the last year’s minimum of 0.00000143. After that, the price should go up sharply. Therefore, it is worth waiting in order to open a long position at the minimum rate.

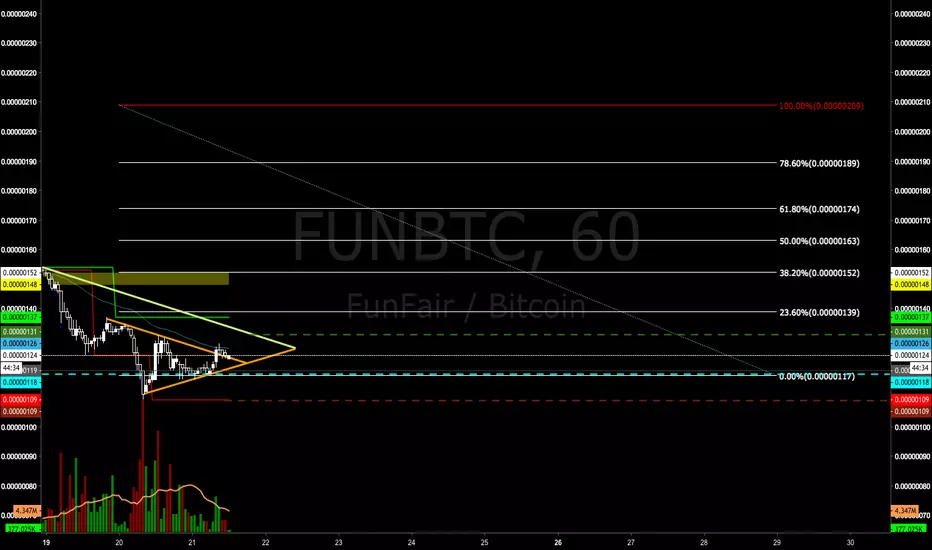
FUNBTC. 100% minimumI scored 3 horizontal lines, with 505 satoshi target (154% profit margin), excluding the highest one (210%), later if the price will be stable and I will have high points of development I will take it into consideration.
Currently the one that interests me the most is the area around 408 sat oshi. it is 106% profit, and the most important one that for a real pump will surely reach.
Good trading