$FUN - FunFair ~ catch the falling knife~While most coins are heading up in value, $FUN has been retracing nicely. Looks to have nearly found support. 183 being the lowest ill let her go before looking to exit.
FUN

its time for some FUN, going longAccumulate #FUN below 210 (~200-180 zone) #DollarCostAverage down
Current price 204
Targets 245-300-360 (play fibs also)
Stoploss lower part of buy zone, don't hold below 180

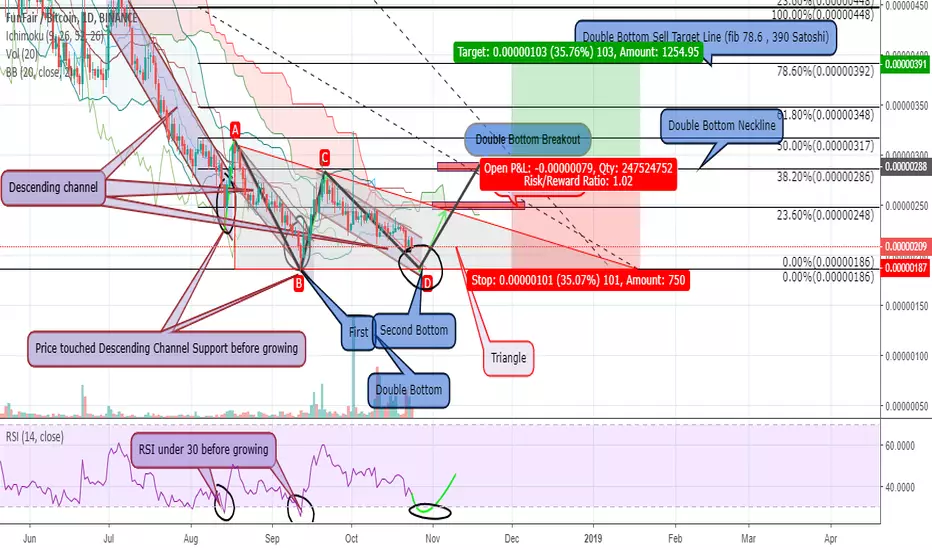
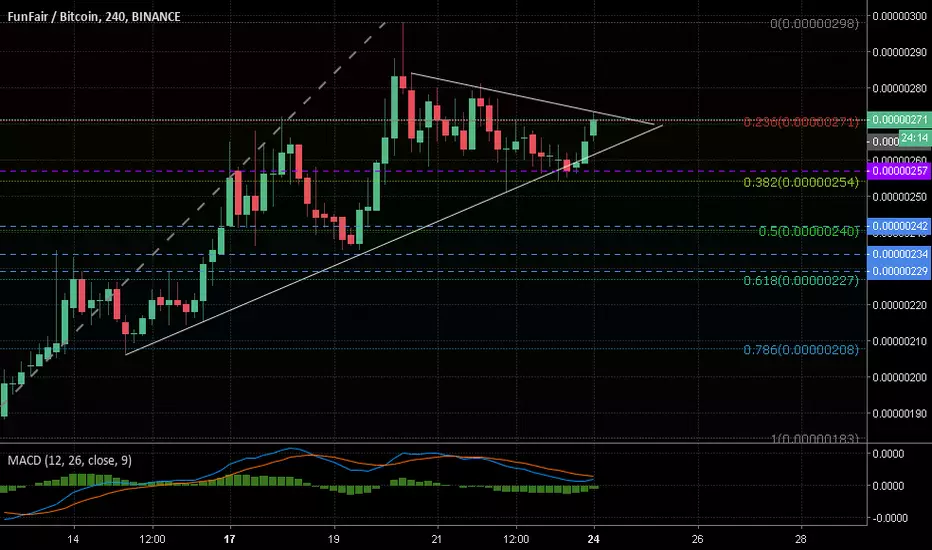
FUNBTC LONGBINANCE:FUNBTC is situated into a Triangle which will make a huge breakout becouse we are near globaly bottom for FUN which is 186 satsoshi(fib 0)
This level was be touched in September and now they can make a beautifull DOUBLE BOTTOM pattern at 1D timeframe
Rsi also can make a Tripple bottom
First target for this double bottom is 248 sats which is 23.60 fibonaci resistance and also internal projection resistance from this triangle
Second target is 286 sats which is 38.2 fibonaci resistance
FOR LONG (IF DOUBLE BOTTOM CONFIRMED) sell target is 317 348 390
We have a very nice BREAKOUT SETUP for this coin.
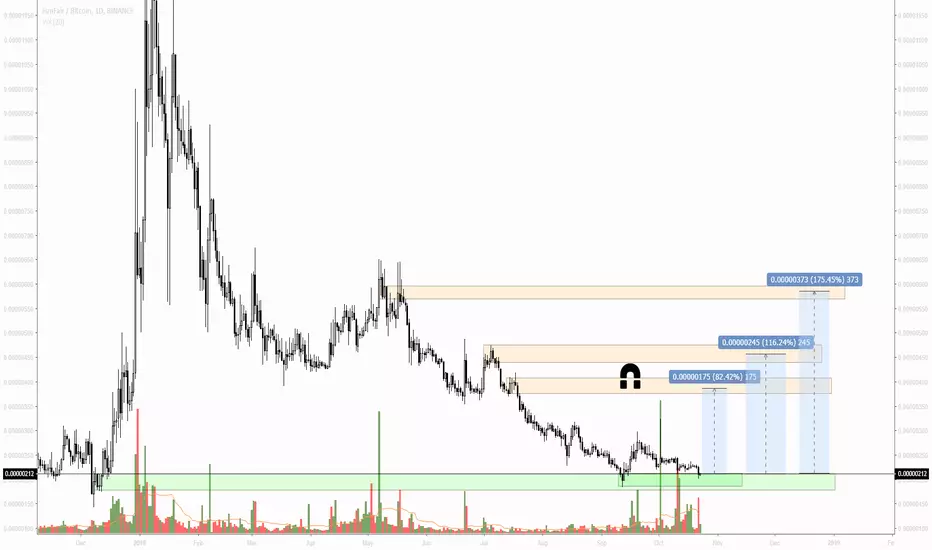
FUN - DCA is smartLiterally the same stuff as my other alt ideas.
Find coins that are bottoming out near historical support (this is a weekly OB, 3D ob, D1 ob, 12H ob). If you look at the weekly, I'm spotting, if this is true, some simple divergences which could most definitely play out over the coming weeks.
I like my chances here.
So I'm going to DCA.
Ideally the buy zone would be not more than 212 sats.
But whatever floats the boat.
I'm not selling any till I see my first target of 374 sats.
Higher up targets are market on the chart.
I'll reupdate this idea if something goes wrong.
DCA, its the name of the game.
FUN - LONG - ICHIMOKU CLOUDBINANCE:FUNBTC Looking good on the 4h chart, about to make a tenkan cross cross inside the cloud, MA50 and bottom of the cloud working as support providing us a good entry with a really close stop-loss, our targets would be just below MA200, important resistance level and top of the cloud.
Entries: 0.00000225 - 0.00000229
Target 1: 0.00000239
Target 2: 0.00000253
Target 3: 0.00000266
Stop Loss: 0.00000217
Disclaimer
CryptoCue is not providing individually tailored investment advice and is not taking subscribers personal circumstances into consideration when discussing investments. Investment involves a high degree of risk and should be considered only by persons who can afford to sustain a loss of their entire position. Investors should consult their registered financial adviser before investing.
CryptoCue is not registered to provide investment advice and is simply providing an opinion, giving a particular experience. Information contained here is not an offer or solicitation to buy, hold, or sell any security.
CryptoCue is not a broker-dealer or financial adviser and is not affiliated with an investment advisory firm and does not engage in activities that would require such registration.
CryptoCue and/or any others affiliated with CryptoCue, are not responsible for any gains or losses that result from the opinions expressed herein.
CryptoCue makes no representation as to the completeness, accuracy, or timeliness of the material provided and all materials are subject to change without notice. Opinions discussed herein have not been reviewed by the securities and exchange commission or any state securities regulatory authority.

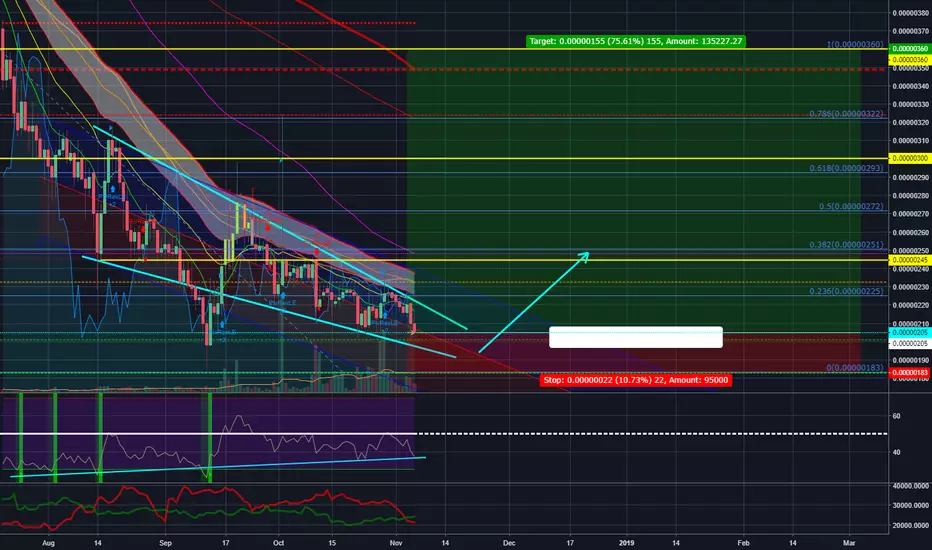
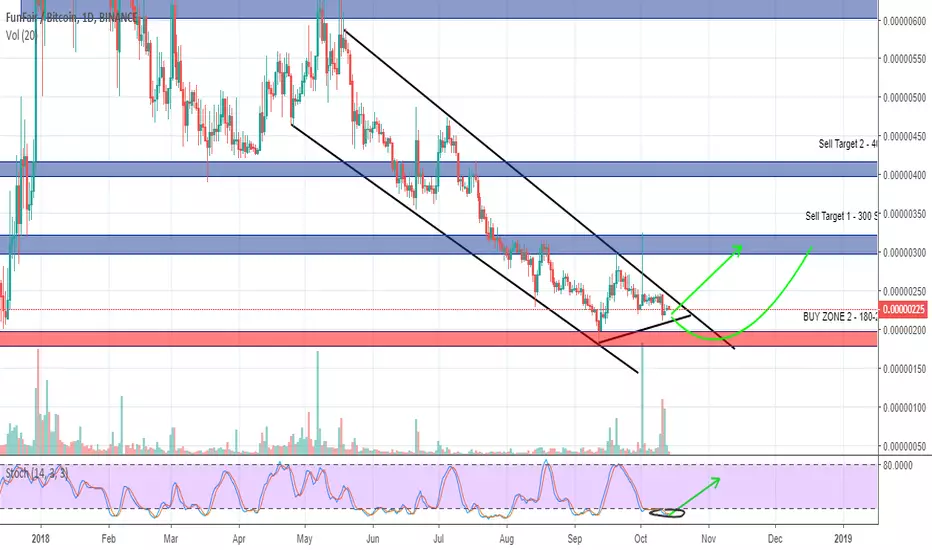
FUNBTC LONGFun is situated into a falling wedge from july and also into a triangle which support line is also the line of global support
There are 2 possibilities
FUN will grow now when it comes out of the triangle or will fall to global support(has bearflag, see update), where from it will begin to grow enormously
Stoch is also heavy oversolded
I think will break upward soon.We need a little bit more volume
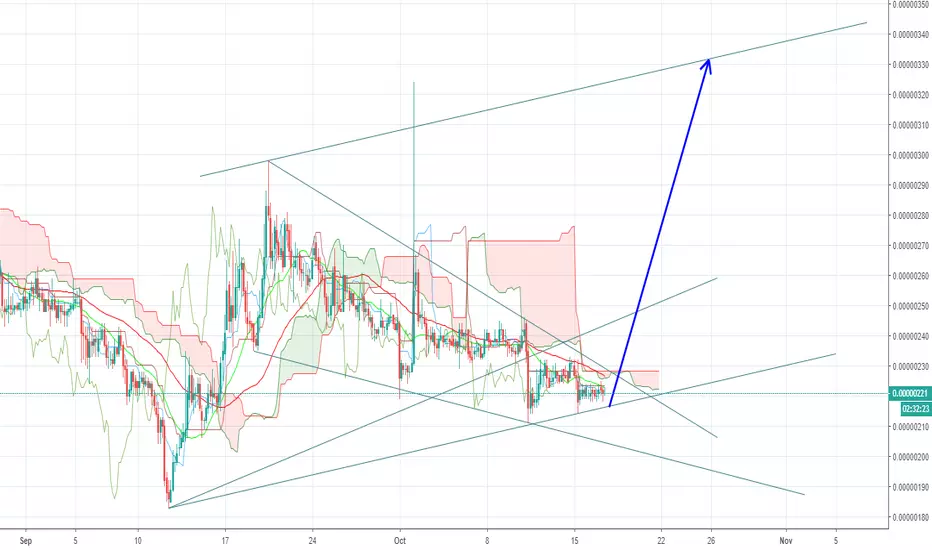
The decision is near. Will we go for new highs or will we go lowThe pattern is very clear about this one. This is the final countdown in my lifetime iv' had reasonable doubt but then again. The story never ends. this is a new beginning. This is a blueprint.
Clear indication of the continues trend of the past month. I don't need to go over it again. This is a clear signal the following will happen. The bull might step down but then again it remains unclear. Will the bear trend pull the weight down from the bulls or will it be visa versa. Clearly there are things happening but then again it's hard to say. What I propose is to follow up for the coming days as these can be setting the long term trend in a reversal from what it is.
In short the signal is clear. If you want to play with high risk you can use leverage but then again it might be better to wait it out. If you don't want to go on the risky and sketchy road you better hold your position or tether up. Either what works best.

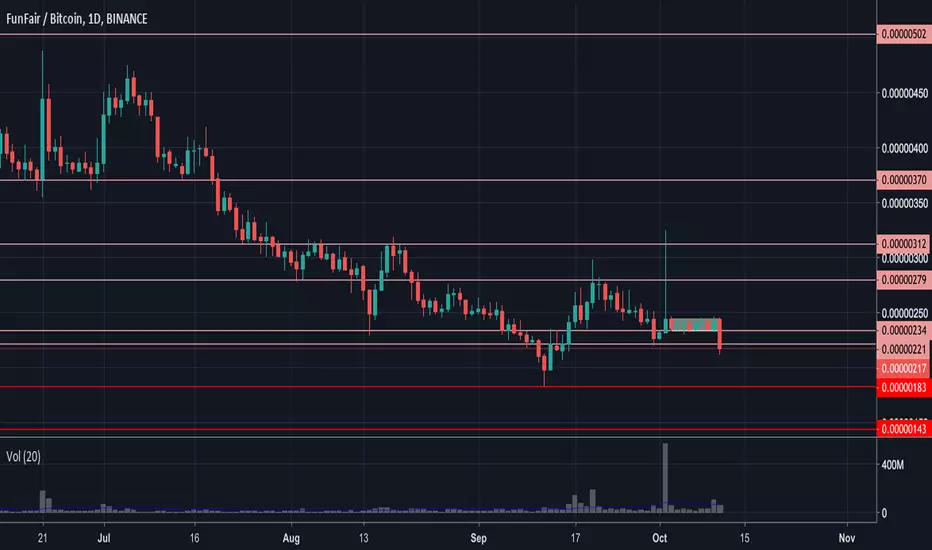
FUN / BTC analyticsFunFair is a blockchain platform that allows to deploy and manage an online casinos, providing transparency and protection for the market participants.
In mid-September, trade volume almost doubled and remains consistently high.
The historical minimum was formed at the level 0.00000143, the new one is remained at 0.00000183.
The asset does not keep in portfolios, trading is speculative.
Now is not the best time to enter, because the rate rolled down from the consolidation zone. The next support level is 0.00000221, but it is weak, and if the price breaks it through, the rate probably will fall to the current minimum and can update it.
The volatility during the day is about 4%, which with low liquidity creates difficulties for intraday trading. Long-term potential within 150%.
The asset does not give a big investment interest due to the overregulation of the industry.
FUN Bounce at 224I see the most support and resistance activity at the highlighted areas. I think BINANCE:FUNBTC is going to be dropping over the next few days into the 230-224 range before coming back up to 262. BTC has been rather steady so this shouldn't have too many curveballs thrown at it.

FUN LongThis trade is contingent on confirmation on the daily chart.
There was a falling wedge breakout, price formed a higher low, and is below the volume POC. Having a close in the daily cloud, and breaking above the black horizontal resistance is required to enter this trade. The target comes from volume profile and horizontal resistances. The red highlighted region is where I would expect a full bullish trend to weaken and reverse if it passes the black horizontals.
FunFair (FUN) Another Ride (200%+ Profits Potential)FunFair (FUN) has always been good to us. Here we can position ourselves once more for a nice and easy trade.
FUN is in the Top100 cryptos by marketcap., sitting at number 72. It has huge potential and is a crypto with a working product. Not that we care, since we don't use it, but this makes our trade safer; less risk.
FunFair (FUNBTC) 100%+ Profits Trade by Alan Masters
TRADE INSTRUCTIONS
Buy in: 290 - 340
FunFair (FUNBTC) Targets by Alan Masters:
(1) 514
(2) 563
(3) 612
(4) 683
(5) 724
(6) 772
(7) 871
(8) 932
(9) 1031
Next support:
(1) 280
(This is the first support if we break below stop loss price)
Capital allocation: <5%
THE BEST WAY TO HAVE FUN
Before you have fun, you have to know what fun is.
Fun is a feeling that by entering a certain state of mind you try to achieve.
Maybe you are playing and you feeling good and having fun.
Maybe you are working, and it is fun, because your work you know to enjoy.
For some other people might be a fight, yet the fun is there as well.
Since fun is not something specific, you can have it in many ways.
The best way to have fun, is to know what fun is for yourself.
For me fun is to share, to grow and help grow.
Fun for you can be making money, while others understand that meditation is fun.
So whatever it is that you do, to have fun every single day.
Remember that if you can understand the feeling we call fun, you can even have FUN without moving from your chair.
Namaste.

FUN Trading AdviceBuy Price: Yellow Line
TP: Green Lines
Invest Suggestion: 5-10 Percent
Profit Expectations: 5, 10 or >20 Percent
Just hold and watch. All targets will be reached within 24 to 72 hours as my prediction. But it's recommended to hold it for 6-7 days if any target not reached. Sell when you got some profit. I am sure, you will be get nice profit. Good Luck!
Thanks for visiting.

Will it be a FUN week?Looks like FUN would want to breakut here. the 4hr macd is looking good. Any thoughts?
FunFair gets it's first casino contractAn Alt coin to keep on your radar to hodl. They applied for a gambling license in Curacao or are soon going to. Once this go through we should get a significant pop. Or if we break this red channel line that is identified here.
Keep your eye's on this one and check out the website. Unlike most crypto projects, they have a working product and they just brought on their first casino using FunFair! funfair.io
If you are looking for a hodl target to get out, mine is $1 USD
Happy hodling,
-Sherem


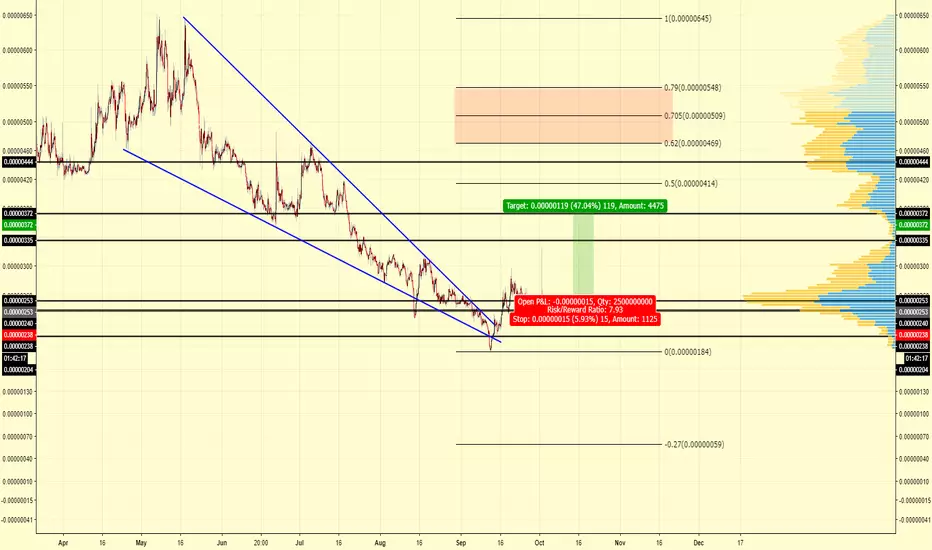
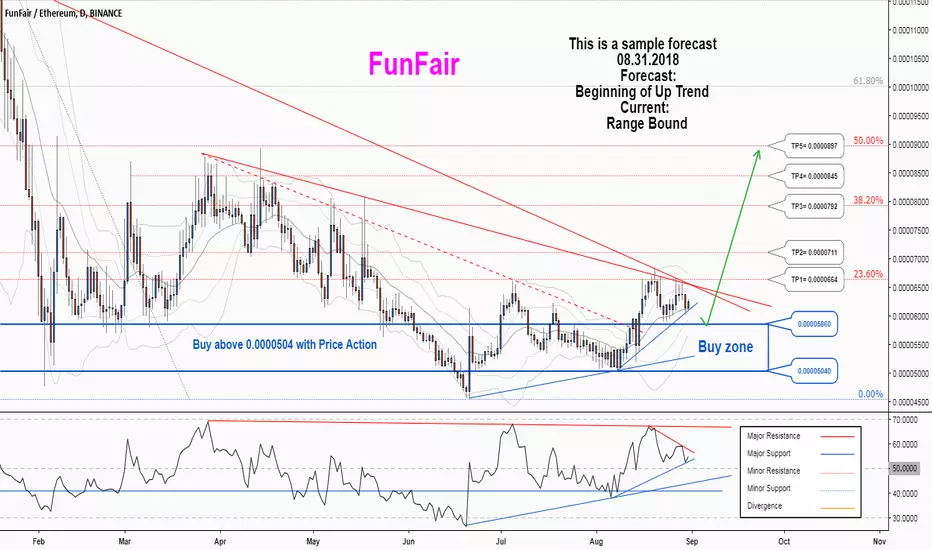
There is a possibility for the beginning of an uptrend in FUNETHTechnical analysis:
. FUNFAIR/ETHEREUM is in a range bound and the beginning of uptrend is expected.
. The price is above the 21-Day WEMA which acts as a dynamic support.
. The RSI is at 54.
. While the RSI and the price downtrend in the Daily chart are not broken, bearish wave in price would continue .
Trading suggestion:
. There is a possibility of temporary retracement to suggested support zone (0.00005860 to 0.00005040). if so, traders can set orders based on Price Action and expect to reach short-term targets.
Beginning of entry zone (0.00005860)
Ending of entry zone (0.00005040)
Entry signal:
Signal to enter the market occurs when the price comes to "Buy zone" then forms one of the reversal patterns, whether "Bullish Engulfing" , "Hammer" or "Valley" in other words,
NO entry signal when the price comes to the zone BUT after any of the reversal patterns is formed in the zone.
To learn more about "Entry signal" and the special version of our "Price Action" strategy FOLLOW our lessons:
Take Profits:
TP1= @ 0.0000664
TP2= @ 0.0000711
TP3= @ 0.0000792
TP4= @ 0.0000845
TP5= @ 0.0000897
TP6= @ 0.0001340
TP7= Free
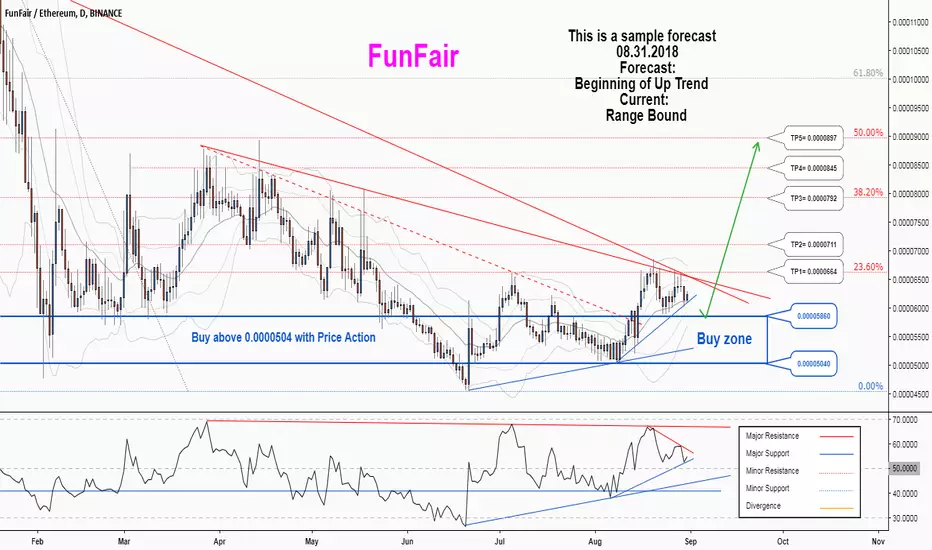

experimental buy/sell zonescan bitcoin plays checkers?
red zone: bearish
green ones: bullish
p.s. you know i say. don't invest this if you are not rich :P

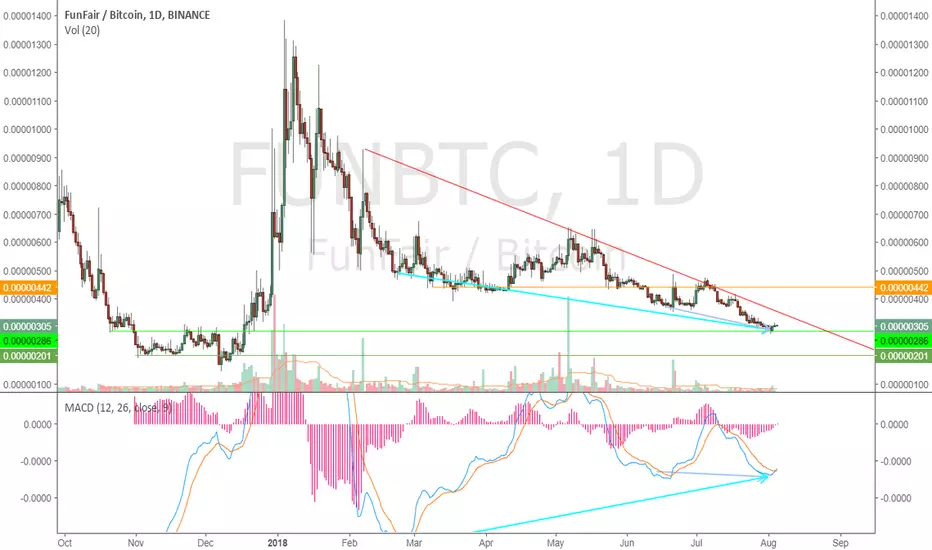
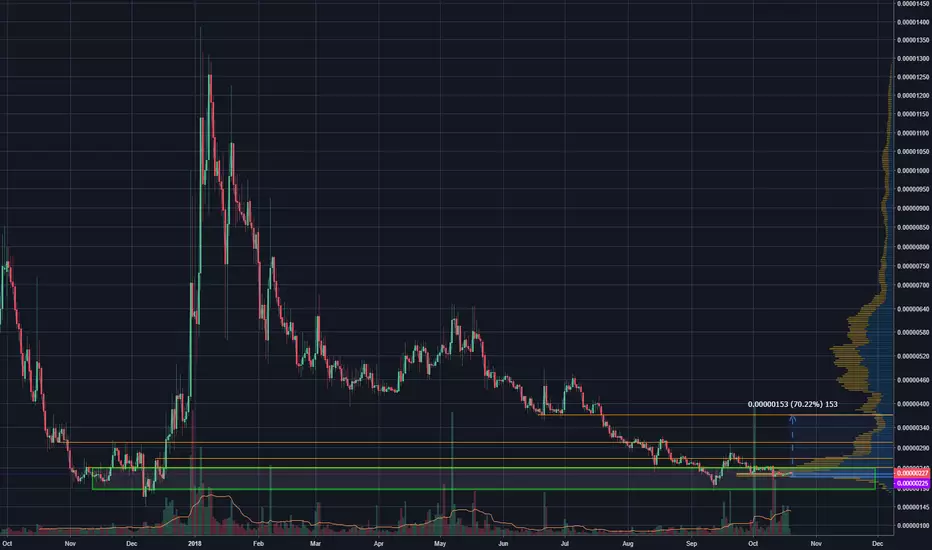
FunFair wait for BreakoutFunFair(FUN) is hitting its support from a long time. Also has macd divergence seen with the blue arrows. The price is still under the trendline(red), and there is a resistance(orange) close up if it does break the trendline.
I am currently not planning on buying, and will wait to see if it hits 200, which is the darker green line.
That point is another support, and is near the all-time low. I will update more once it gets near the darker green line.
Also, if it does manage to break out from there it will have more space to move, as the resistance will be higher up, and it can easily spike up.
Another likely situation is it breaks out near now, but doesn't have enough momentum and returns to the light green support(or back to the trendline).
That will also be a good situation to enter a trade in, but we should wait for now to see what occurs.
Don't place any orders yet, and wait for it to play out.