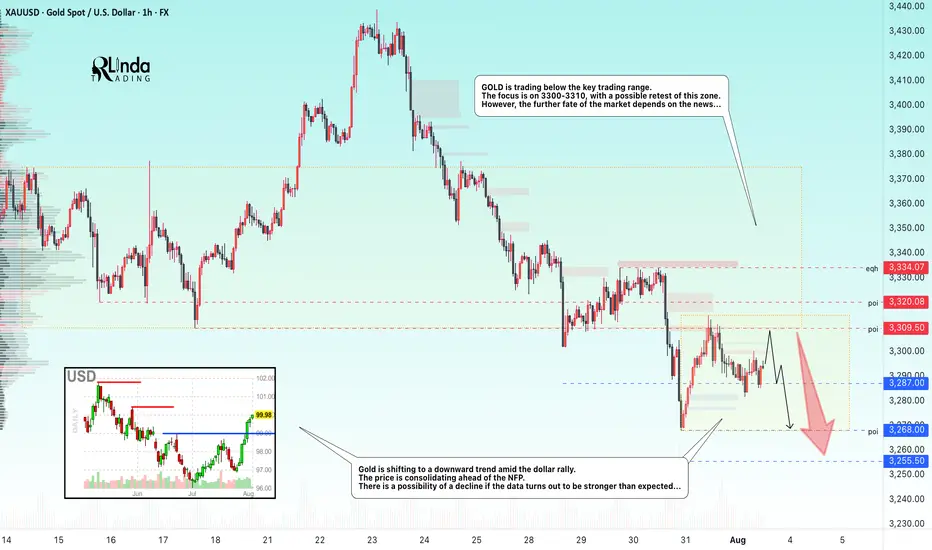
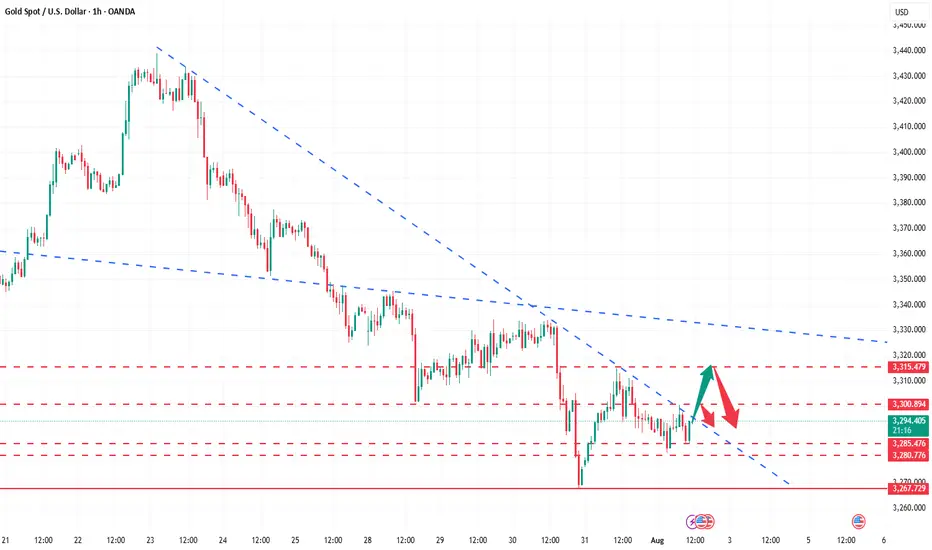
GOLD → The market is waiting for NFP. What could happen?FX:XAUUSD is bouncing off resistance at 3310, confirming the upper limit of the new trading range. The dollar continues to rally, but the market as a whole is stagnating ahead of upcoming news—NFP is coming up!
Gold is consolidating at monthly lows around $3268, awaiting key US labor market data (NFP). Trump's new tariffs (10% globally, 35% for Canada, 39% for Switzerland) have boosted demand for the dollar, putting pressure on gold. Markets are waiting for NFP: forecast +110K jobs, unemployment 4.2%. Weak data (<100K) → gold may rise to $3400. Strong (>150K) → the dollar will strengthen, gold will continue to fall. The probability of a Fed rate cut in September is <50%.
Based on yesterday's data, I would cautiously suggest that NFP will be in the range of 125K–145K, slightly above the consensus (110K). This will play into Trump's hands (I think you understand what I mean...).
Resistance levels: 3300, 3310, 3320
Support levels: 3287, 3268, 3255
The news has a negative nuance — unpredictability. Be careful.
Technically, based on the data we have at the moment, I would assume that the market may test resistance at 3300-3310 before a possible pullback to the specified support. BUT! Unpredictable data could turn the game around, and in that case, if the dollar falls, gold could start to rise.
Best regards, R. Linda!
Fundamental Analysis
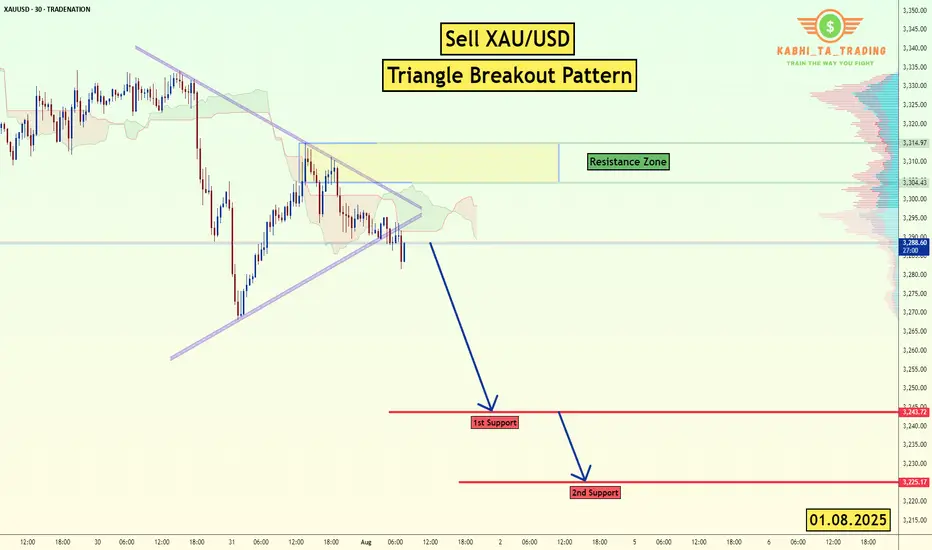
XAU/USD (Gold) - Triangle Breakout (1.08.2025)The XAU/USD Pair on the M30 timeframe presents a Potential Selling Opportunity due to a recent Formation of a Triangle Breakout Pattern. This suggests a shift in momentum towards the downside in the coming hours.
Possible Short Trade:
Entry: Consider Entering A Short Position around Trendline Of The Pattern.
Target Levels:
1st Support – 3249
2nd Support – 3225
🎁 Please hit the like button and
🎁 Leave a comment to support for My Post !
Your likes and comments are incredibly motivating and will encourage me to share more analysis with you.
Best Regards, KABHI_TA_TRADING
Thank you.
Disclosure: I am part of Trade Nation's Influencer program and receive a monthly fee for using their TradingView charts in my analysis.
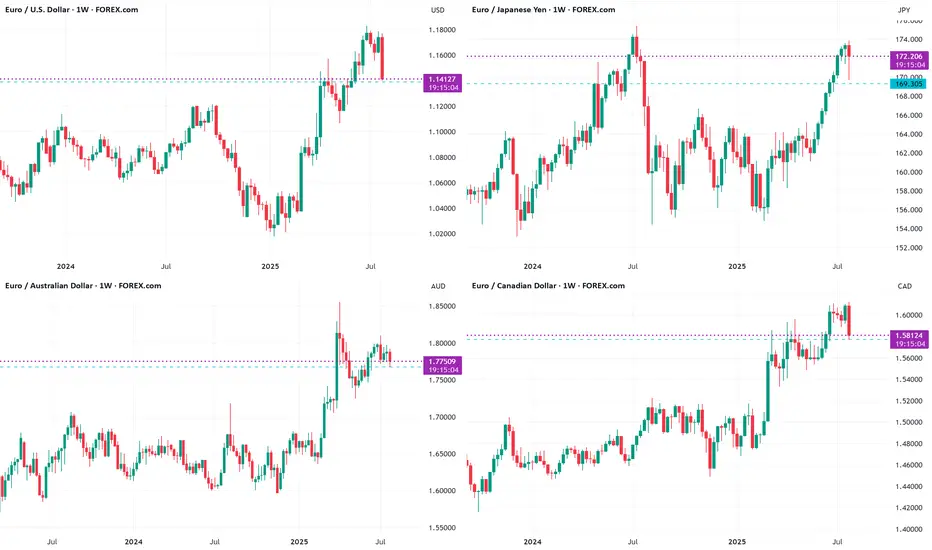
EURO long: The "What If?" tradeHello traders
The Euro is showing signs of bottoming out at the weekly support levels against
USD, JPY, CAD and AUD.
MOST IMPORTANT:
USD:
While King Dollar is clearly reigning after the FOMC indication not to expect rate cuts any time soon and solid economic data, the "What If" factor is NFP tomorrow and to a minor extent month end settling. If the NFP print comes in significantly lower than expectations, the Euro may pop higher. If the print is above expectations, still take a moment to check where the most jobs are. if it is in hospitality and leisure, it is probably summer hiring.
JPY: The BoJ kept rates unchanged.
CAD: The loonie is under siege with Trump's renewed 35% tariffs announced today. However, IF Russian sanctions against oil sales come to fruition, the CAD may strengthen. Watch Oil prices.
AUD: CPI came in below expectations. PPI has just printed lower too.
The Euro Zone's unemployment rate ticked down and German CPI ticked higher. The impact of tariffs seems to be priced in for the moment.
The biggest "What If" ?
The decision of the Federal Appeals Court if the International Trade Court verdict is upheld. In that case, it is all but guaranteed that it will reach the Supreme Court. IF the Supreme Court declares it unlawful, the USD MAY drop like a lead balloon.
The risk assets in these charts are all at right around the weekly 20 SMA.
tradingview.sweetlogin.com
Just some food for thought. Let me know what your thoughts are.
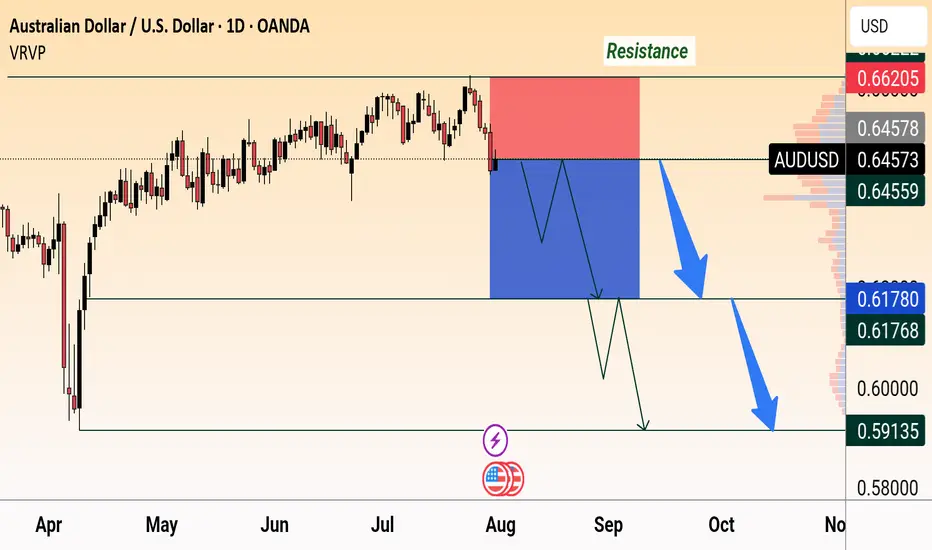
AUD/USD Bearish OutlookAUD/USD faces strong resistance at 0.6620 and is showing bearish momentum. Price is expected to drop below 0.6450 with targets near 0.6178 and 0.5913, following a possible consolidation.
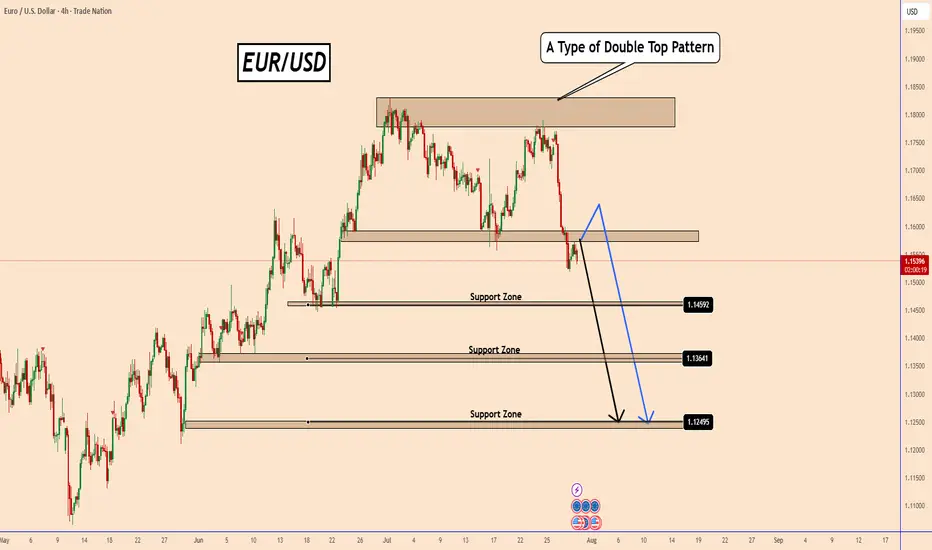
EURUSD: Double Top Pattern Ahead of FOMC MeetingEURUSD: Double Top Pattern Ahead of FOMC Meeting
EURUSD has formed a possible double top, and price action is now trading below the neckline - an indication of increasing bearish probability.
All eyes are on today's FOMC and the interest rate decision. If the Fed signals a rate cut or hints at future easing, this could trigger a sell-off, further validating the bearish scenario.
Although the USD has been weak for an extended period, the market may be changing its positioning this time. Even if EURUSD moves higher during the event, the broader setup favors a decline.
⚠️ Trading around major news events is very risky. It's better to wait for clarity after the FOMC before taking any action.
You may find more details in the chart!
Thank you and Good Luck!
PS: Please support with a like or comment if you find this analysis useful for your trading day
Disclosure: I am part of Trade Nation's Influencer program and receive a monthly fee for using their TradingView charts in my analysis.
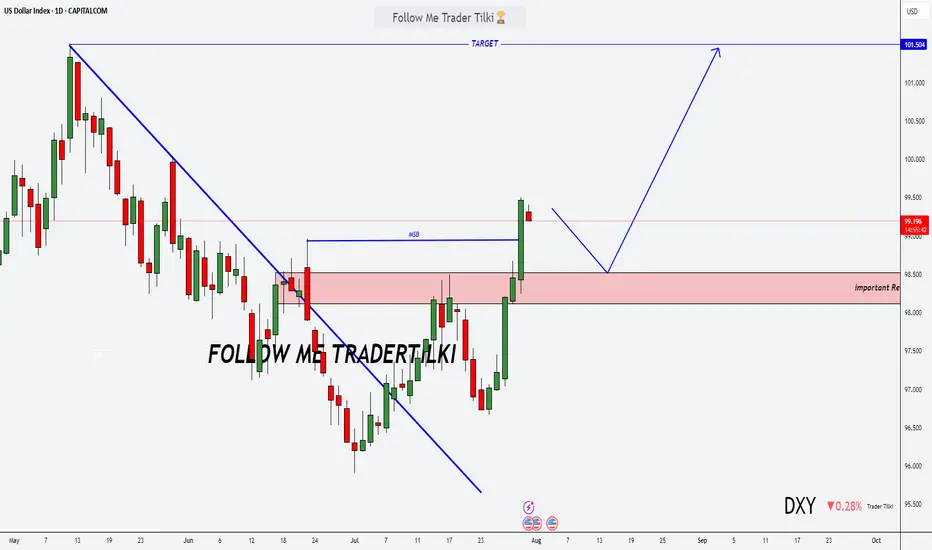
DXY Just Broke Through the Lock… Where’s the Market Headed Now?🌅 Good Morning, Friends!
A few days ago, I marked 98.950 as a key threshold for the DXY index. As of today, that level has officially been broken—and the bullish momentum we anticipated is now kicking in. 📈
The next target? 101.000.
That said, it’s crucial to remember: DXY is heavily influenced by fundamental data. Stay alert and keep a close eye on key economic developments—they’re essential for navigating this move.
This breakout validates the analysis I shared with you all. And it wasn’t just about charts—it was about discipline, precision, and timing.
Every single like from you is a huge boost to my motivation. Thanks from the heart—your support drives me to keep sharing these insights! 💙
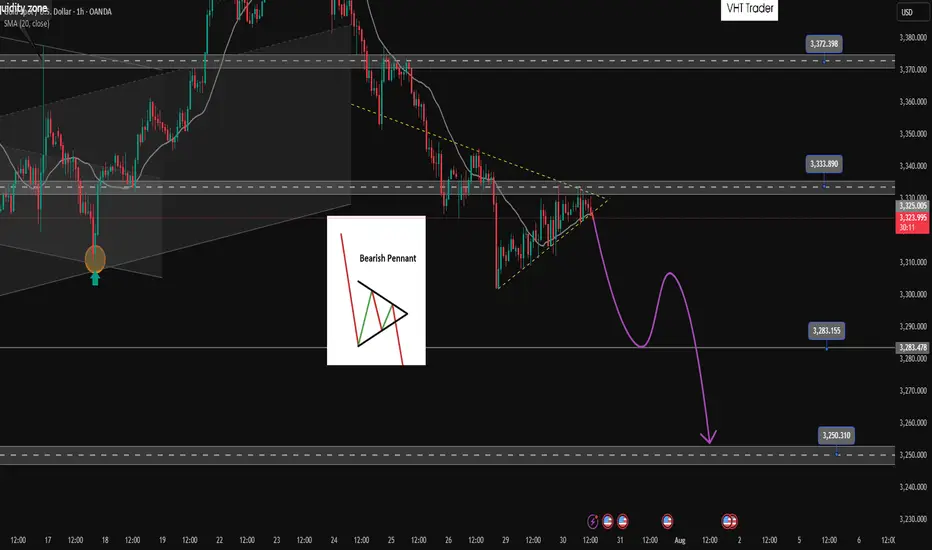
Bearish pennant pattern active. Active SELL✏️Gold price is forming a triangle accumulation pattern. That shows the hesitation of investors at the moment, they may be waiting for important economic indicators of the US this week. Just an impact that makes Price break out of the triangle border can create a strong FOMO trend. The price line is quite similar to the bearish pennant pattern and heading towards really strong support areas.
📉 Key Levels
SELL Trigger: Break bottom line 3324
Target 3285, lower is the 3250 area
BUY Trigger: Break and trading above 3333
BUY Trigger: Rejection and confirmation of candle at 3285
Leave your comments on the idea. I am happy to read your views.
Gold Crashing After Hot U.S. Data – More Pain Ahead?Minutes ago, important indices were released from the US , which catalyzed the continuation of gold's downward trend .
Key U.S. Economic Data Just Dropped!
ADP Employment: 104K
GDP q/q: 3.0%
Both came in stronger than expected , signaling that the U.S. economy is holding up better than many thought!
Strong job growth
Solid economic expansion
The result? A stronger U.S. dollar ( TVC:DXY ) and potential downward pressure on Gold .
All eyes are now on FOMC meeting .
Will the Fed still hint at future rate cuts despite the solid data? Or is the easing cycle officially on hold? What is your idea!?
----------------------
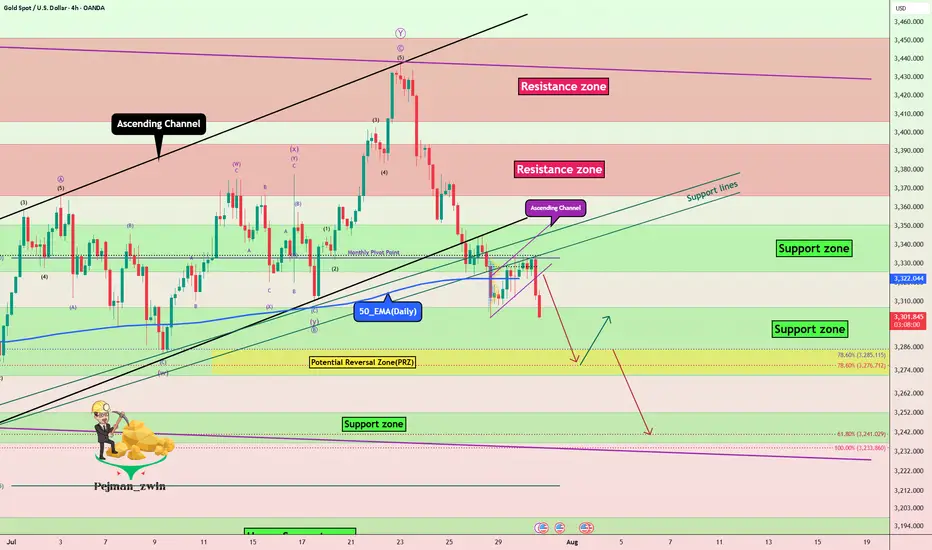
Gold ( OANDA:XAUUSD ) has already managed to break the Support zone($3,350-$3,326) , Monthly Pivot Point , 50_EMA(Daily) , Support lines , and the lower line of the ascending channel . Also, Gold trading below $3,333 plays an important role for me, which can increase the possibility of a continuation of the downtrend .
I expect Gold to drop to at least the Potential Reversal Zone(PRZ) before the FOMO meeting and if the Support zone($3,307-$3,272) is broken, we can expect further declines to $3,253(Second Target) .
--------------------------------
Information we need to know:
How should the Federal Funds Rate be announced to cause a deeper drop in Gold ?
The Fed needs to take a hawkish stance — meaning:
They keep rates unchanged, but make it clear they intend to keep them elevated for a prolonged period.
They emphasize strong economic data like today's solid ADP and GDP numbers .
They express concern that inflationary risks remain, and cutting rates isn’t on the table anytime soon.
In this case, markets get disappointed, rate cut hopes fade, and gold drops as real yields( TVC:US10Y ) rise and the U.S. dollar strengthens.
--------------------------------
Note: Stop Loss (SL) = $3,340
Gold Analyze (XAUUSD), 4-hour time frame.
Be sure to follow the updated ideas.
Do not forget to put a Stop loss for your positions (For every position you want to open).
Please follow your strategy; this is just my idea, and I will gladly see your ideas in this post.
Please do not forget the ✅ ' like ' ✅ button 🙏😊 & Share it with your friends; thanks, and Trade safe.
Smoothie in One Hand, Chart in the Other: Your Vacation ManualSome traders bring a beach read. Others bring their TradingView charts.
It’s the heat of the summer and we figured, why not take it easy with a breeze of lightweight lines to pair with your mezcal espresso martini? Let’s talk about how to relax while still watching the markets.
🏄♂️ Market Never Sleeps… But You Should
Vacations are supposed to be about unplugging, but for traders, that’s just code for “I’ll switch to the app instead.”
And we don’t blame you. With all that’s going on — US-EU tariff deal, stocks at record highs, and Ethereum BITSTAMP:ETHUSD outperforming Bitcoin BITSTAMP:BTCUSD in a monster July run — it’s only natural for market participants to be hooked at this time.
But watch for those signs of getting overly attached. Studies show performance suffers when you're overcooked — like your last scalp trade on Powell Day. So yes, that mojito matters. Just don’t place a leveraged position on a pool float.
📅 Timing the Market… and Your Booking
Let’s talk timing. The pros know not to schedule getaways during Nonfarm Payrolls week or FOMC decision day. (Unless your idea of relaxing is explaining yield curves to your kids on a ferry across lake Como.)
Instead, try planning your time off during historically low-volatility periods. Summer often sees volume dry up like your skin without sunscreen. Think August’s fairly dry weeks — when even the algorithms seem to be on holiday. As always, consult with the Economic Calendar to know when these are.
Bonus tip: if you’re flying and you wanna stay wired in, go for premarket or after-hours shifts. Nothing says “seasoned trader” like placing an order while the flight attendant gathers everyone’s attention for the safety demo.
🧴 SPF 50 and the S&P 500: Know Your Risk Exposure
In these scorchers outside, you wouldn’t step out without sunscreen, right? But would you let your positions roast unsupervised?
Use stop losses like you use sunblock: generously and repeatedly. Even better — scale back. Summer’s thin liquidity (and other summer trading traps ) can turn minor market moves into full-on tidal waves. No one wants to explain to their friends why they lost 40% of their portfolio during a snorkeling trip.
Adequate position sizing is your beach umbrella. It doesn’t stop the storm, but it’ll stop the burn.
🧭 Wi-Fi, but Make It Secure
Public Wi-Fi is great for scrolling memes, not executing trades. One accidental login from a beachside café in Mykonos and boom — your brokerage account may become a group project.
Trading from your vacation spot shouldn’t be a flex (no matter how much you want to look cool to the bunch of people around you). Focus on your game, trade in silence, and bask in sunlight and success.
☀️ Pack Light, Trade Lighter
The golden rule? If you’re not at your desk, don’t trade like you are.
Scale back positions, minimize leverage, and don’t try to outperform the market while someone’s kid is throwing a beach ball at your head. This is a maintenance phase, not a moonshot month.
Think: protect capital, avoid drawdowns, maybe sneak in a swing trade between sunscreen applications.
📲 Must-Have Apps for Sand-and-Screen Trading
You’re not bringing a full setup, but your phone can still do the heavy lifting. Load it with TradingView (obviously), your broker, ideally paired with TradingView, and a solid news feed . Bonus points for noise-canceling headphones that can drown out both market panic and crying toddlers.
Set up push notifications smartly — only the alerts you actually need. You don’t want your wrist buzzing every time Nvidia NASDAQ:NVDA moves 0.1%.
Question for the road : What’s your best summer trade… and was it worth checking your phone at dinner to place it?
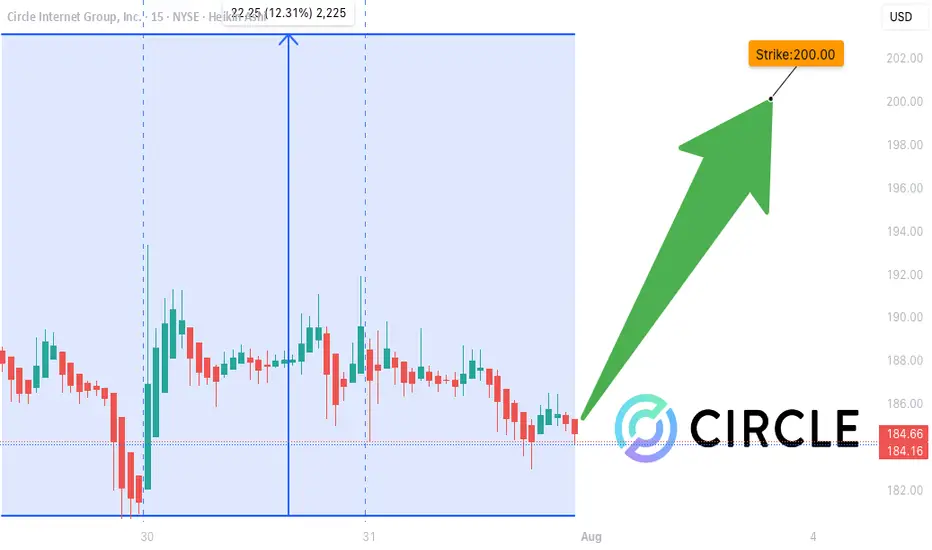
CRCL WEEKLY TRADE SIGNAL (JULY 31)
### 🚨 CRCL WEEKLY TRADE SIGNAL (JULY 31) 🚨
**Call Option Setup – Based on Multi-Model Consensus**
📈 **Momentum**:
🟡 RSI Daily: 46.7 (Neutral)
🟥 Volume: 0.4x last week = 🚨 Weak participation
🟢 Options Flow: Bullish (C/P Ratio = 1.42)
🌤️ VIX: Low (15.4) → Low volatility = 💰 opportunity
🔍 **Model Summary**:
✅ **Grok**: Bullish setup → RECOMMENDED TRADE
❌ Claude, DeepSeek, Gemini, Llama: No trade (weak volume + gamma risk)
🤝 ALL agree: Weak volume & mixed trend = caution
---
### 💥 Trade Setup 💥
🎯 **Direction**: CALL (Bullish bias)
💸 **Strike**: \$200
💰 **Entry**: \$0.85
📆 **Expiry**: Aug 1 (1DTE – high gamma 🔥)
🎯 **Profit Target**: \$1.11
🛑 **Stop Loss**: \$0.51
📊 **Confidence Level**: 65%
📍 **Entry Timing**: Market Open
---
### 🧠 Key Insight
📉 Weak volume = 🚫 no institutional conviction
📈 Bullish options flow = 🔥 potential short squeeze
🕓 Time-sensitive 1DTE = Fast hands needed!
---
👉 If you trade momentum, watch CRCL at open.
🧠 **Strategy**: scalp the move or exit near \$1.11
💥 High risk, high gamma, tight leash.
\#OptionsFlow #CRCL #CallOption #TradingSignal #UnusualOptionsActivity #0DTE #GammaScalp #TradingView #SwingTrade #TFlow
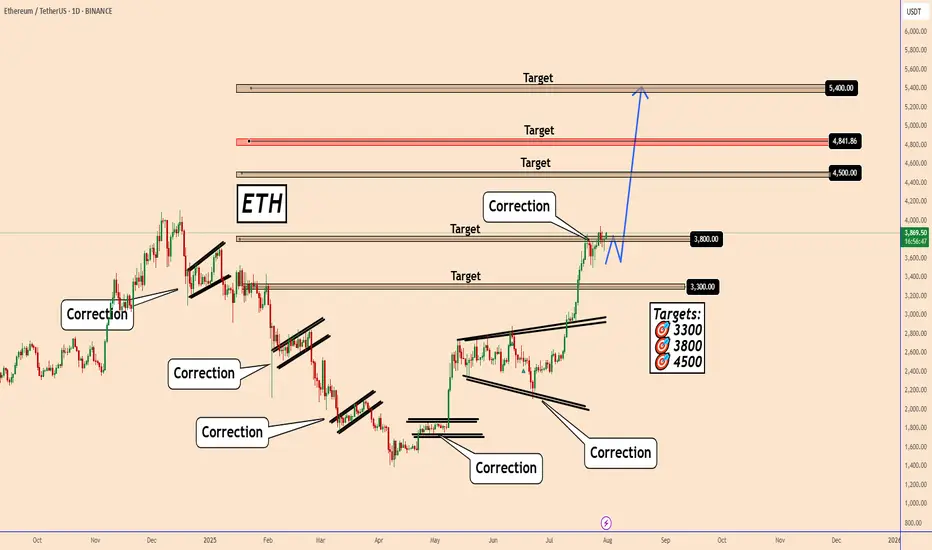
Ethereum: Bullish Momentum Recharging for the Next Leg UpEthereum: Bullish Momentum Recharging for the Next Leg Up
Daily Perspective on ETH Ethereum remains in a clear bullish trend on the daily chart. The long and consistent green waves reflect strong upward momentum over the past several days and weeks.
Looking left on the chart, ETH previously made several corrective moves during bearish phases. The current correction looks similar to those on the left side of the chart, but this time it is taking place within an uptrend.
The price is currently in a consolidation phase, likely preparing for another push higher. I’m watching three key upside targets: 4500, 4840, and 5400.
You may find more details in the chart!
Thank you and Good Luck!
PS: Please support with a like or comment if you find this analysis useful for your trading day
Gold (XAU/USD) 1H Chart – Trendline Support and Upside TargetGold price is trading above the support trendline around 3,287. A bounce from this level could drive price toward the 3,313 resistance and potentially the 3,333 target. Maintaining support above 3,287 is key for the bullish outlook.
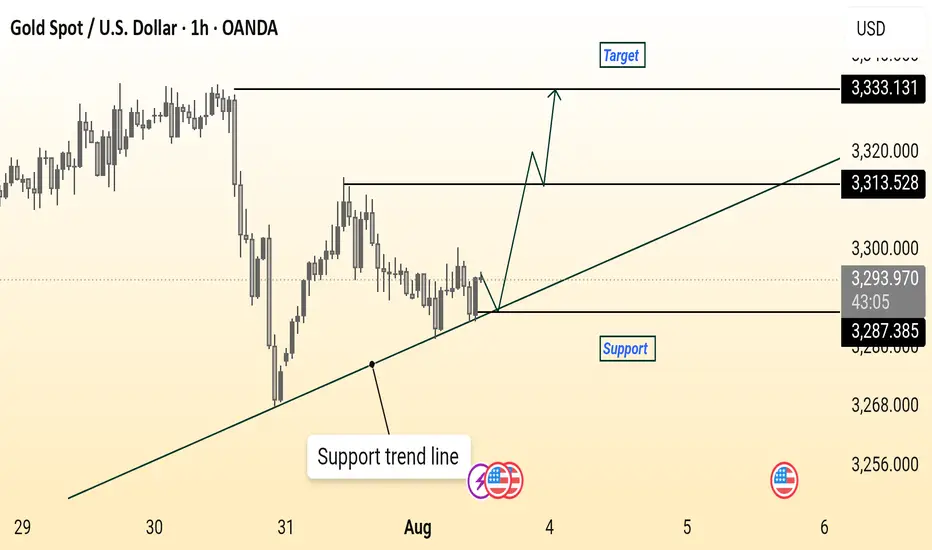
FIG IPO: Is it Worth the Hype?IPO Highlights
IPO pricing & volume
-Figma priced its IPO at $33 per share on July 30, 2025 (above its revised range of $30–32 and the initial $25–28 range—raising over $1.2 billion by selling approximately 36.94 million shares.
Valuation
-This pricing placed its valuation at around $19–19.5 billion fully diluted, close to the US $20 billion Adobe had once offered in a failed acquisition attempt.
Financial Profile & Business Strengths
Revenue and profitability
-Figma posted US $749 million in revenue for 2024 (up 48% YoY), and revenue in Q1 2025 grew by 46% to $228.2 million. It also delivered $44.9 million in net income during Q1 2025, signaling improved profitability after a net loss the prior year (inflated by a one‑time $1 billion breakup fee from Adobe).
Customer base & margins
-The company boasts 13 million monthly active users and covers 95% of Fortune 500 companies, with strong 91% gross margins and approximately 18% operating margins.
Cryptocurrency holdings
-Figma holds $69.5 million in a Bitcoin ETF and $30 million in USD Coin, planning to reinvest these into Bitcoin, a strategy similar to that of MicroStrategy.
Strategic & Market Implications
Signal for IPO revival
-Figma is the largest enterprise-software IPO since 2021 and is seen as a potential catalyst for a broader IPO rebound, potentially opening the floodgates for other companies such as Canva, Databricks, and more.
Market perception & analyst viewpoints
-Analysts, including Gil Luria at D.A. Davidson, view Figma as well-positioned in the AI/design space. Others caution that rising usage of generative AI could disrupt future margins, creating both potential and uncertainty.
Competitive landscape
-The IPO sets the stage for Figma to directly compete with Adobe. Despite Adobe’s recent stock decline, analysts expect both companies to potentially thrive given growing demand for creative tools.
-Disclaimer: This analysis is for informational and educational purposes only and does not constitute financial advice, investment recommendation, or an offer to buy or sell any securities. Stock prices, valuations, and performance metrics are subject to change and may be outdated. Always conduct your own due diligence and consult with a licensed financial advisor before making investment decisions. The information presented may contain inaccuracies and should not be solely relied upon for financial decisions. I am not personally liable for your own losses, this is not financial advise.

XRPUSDT → Range formation. Retest of resistanceBINANCE:XRPUSDT.P , after a false breakout of the daily resistance level of 3.352 and the elimination of traders, has entered a correction phase. The trading range shown below has been formed, with an emphasis on resistance...
XRP previously formed a false breakout of the daily resistance level of 3.352, as indicated in the idea above. After changing its market character, the price entered a correction phase. Focus on the range of 3.00 - 3.264. A retest of resistance (zone of interest and liquidity) is possible before falling to 3.161, 3.05 or to the liquidity zone of 3.00. There are no technical or fundamental reasons for exiting the consolidation; most likely, a retest of the zone of interest may end in manipulation and a pullback to support...
Resistance levels: 3.1609, 3.264, 3.352
Support levels: 3.05, 3.00
I do not rule out the fact that a retest of the 3.264 resistance level may have a breakout structure and the price will continue to rise, but based on the price behavior pattern on D1, the market structure, and market stagnation, I conclude that at the moment, the chances of seeing a correction from resistance are higher. Further developments will need to be considered after the retest of key zones on the chart...
Best regards, R. Linda!

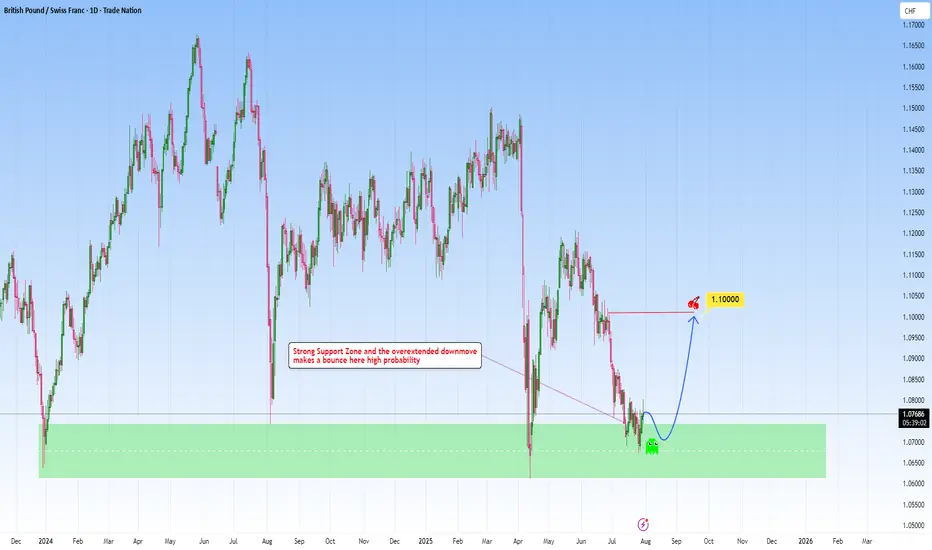
GBPCHF meets strong support: A reversal here is high probabilityLooking at GBPCHF and how it fits within my approach to structure-based trading, this one is really speaking my language.
Price has come down into a key higher-timeframe support zone: a zone that’s proven itself multiple times in the past. Now, price has shown some initial rejection there, making my long position towards 1.1000 a clear, rational target.
What makes this setup different could be the patience behind it. As we let the market complete its downward leg, waited for price to revisit a reliable zone, and now anticipating a bounce back. It’s a move that I’ve captured across my previous charts again and again.
Let me know in the comments what you think
Disclosure: I am part of Trade Nation's Influencer program and receive a monthly fee for using their TradingView charts in my analysis.
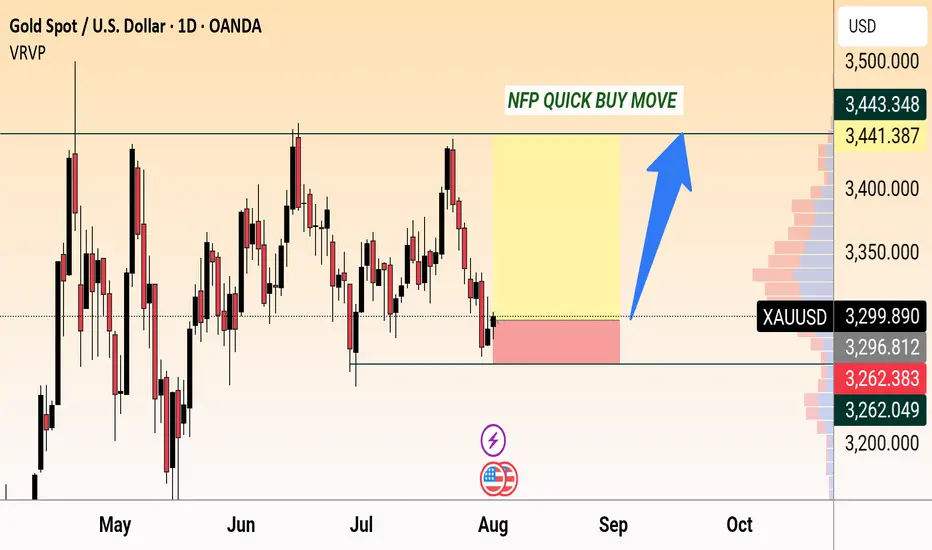
NFP quick buy moveGold (XAUUSD) forms support near 3,262 with a potential bullish move expected on NFP news. Targeting 3,443 resistance zone for a quick buy opportunity.
Apple (AAPL) Shares Jump Following Earnings ReportApple (AAPL) Shares Jump Following Earnings Report
Yesterday, after the close of the regular trading session, Apple released its earnings report, which surpassed analysts’ expectations:
→ Earnings per share: actual = $1.57, forecast = $1.43;
→ Revenue: actual = $94.04 billion, forecast = $89.35 billion.
As a result, AAPL shares surged in the post-market, rising from $207.57 to $212.51.
Media Commentary:
→ The company reported a 13% year-on-year increase in iPhone sales.
→ However, according to Tim Cook, tariffs have already cost the company $800 million and this figure could exceed $1 billion in the next quarter.
Technical Analysis of the Apple (AAPL) Stock Chart
Following the volatility in April 2025, price action has justified the construction of an ascending channel (marked in blue). The $216 level, which has acted as a key reference point since March, remains a significant resistance area, because:
→ It has consistently prevented AAPL from reaching the upper boundary of the channel;
→ Even in the wake of a strong earnings report, the price failed to break through this level in post-market trading.
If the $216 level continues to cap gains in the coming days – despite the positive report – the stock might pull back towards the median line of the blue channel (following the post-market rally). This zone often reflects a balance between supply and demand. While such a retracement would appear technically justified, it may raise concerns among shareholders, particularly when compared to the more aggressive price rallies seen in the shares of other tech giants, such as Microsoft (MSFT), as we discussed yesterday.
From a more pessimistic perspective, peak A may turn out to be yet another lower high within a broader bearish structure that has been forming on the AAPL chart since December 2024, when the stock reached its all-time high around the $260 level.
This article represents the opinion of the Companies operating under the FXOpen brand only. It is not to be construed as an offer, solicitation, or recommendation with respect to products and services provided by the Companies operating under the FXOpen brand, nor is it to be considered financial advice.
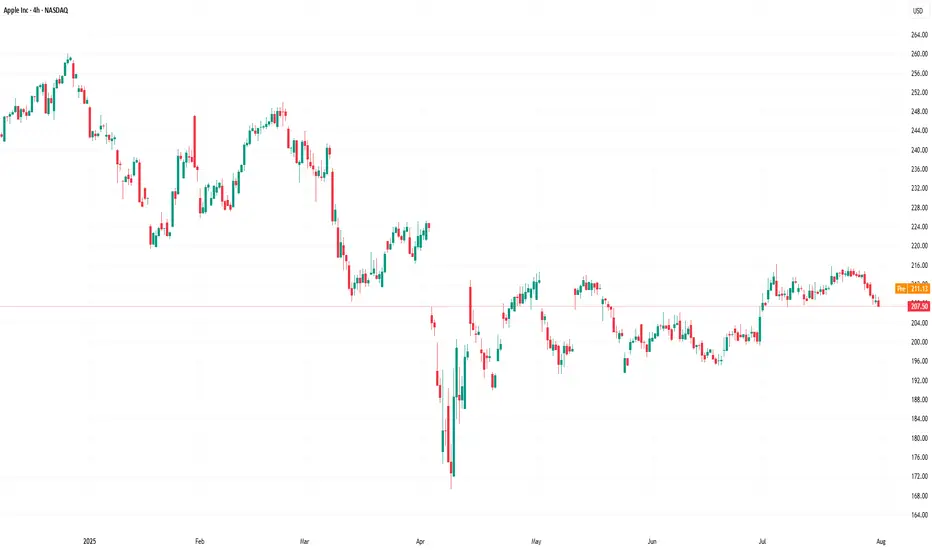
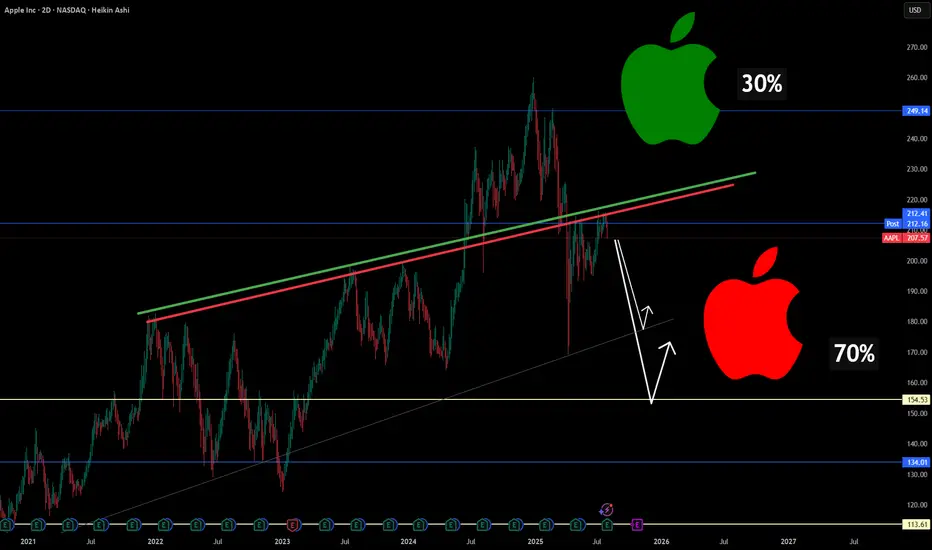
Why Apple Could Be Entering a Structural Correction🍎📉 Why Apple Could Be Entering a Structural Correction ⚠️🔍
After scanning major tech names today, one stock stood out— for all the wrong reasons : NASDAQ:AAPL .
Technically, Apple has broken below long-standing trendline support , and my chart now assigns a 70% probability(roughly guys...roughly and rounded) of further downside vs only 30% upside . But it's not just about the chart...
Here’s the macro storm Apple is walking into:
🧭 1. Trade War Revival
New tariffs on Chinese electronics could cost Apple up to $1.1B/quarter , even as it tries to diversify production. India and Vietnam are promising, but not mature enough to offset risk.
🤖 2. Lagging in the AI Arms Race
While Nvidia, Google, and Microsoft pour $30B+ into AI, Apple is spending less than half that. Analysts weren’t impressed with “Apple Intelligence.” Siri still isn’t leading.
🇨🇳 3. China: Flatlining Growth, Rising Risk
~18% of Apple’s revenue still comes from China. With Huawei resurging and tightening regulations, Apple’s dominance is being chipped away.
🛑 4. Innovation Pipeline: Empty?
There’s no iPhone super-cycle ahead. Vision Pro remains niche. Apple now looks like a mature tech stock without a breakout catalyst —risky when valuation is still premium.
⚖️ 5. Legal Pressure on Both Sides of the Atlantic
The DOJ and EU are targeting Apple’s App Store dominance. If changes are enforced, the service revenue moat weakens.
🔽 Summary: This Isn’t Panic. It’s Repricing.
The market is re-rating Apple based on real structural risks.
Downside levels I’m watching:
📉 177.65 (first support)
📉 154.53 (next key level)
❗️134–113 zone if macro pressure escalates
Chart = structure. Narrative = pressure. Both are aligned.
Let me know your thoughts—still long NASDAQ:AAPL , or hedging this weakness?
One Love,
The FXPROFESSOR 💙
Disclosure: I am happy to be part of the Trade Nation's Influencer program and receive a monthly fee for using their TradingView charts in my analysis. Awesome broker, where the trader really comes first! 🌟🤝📈
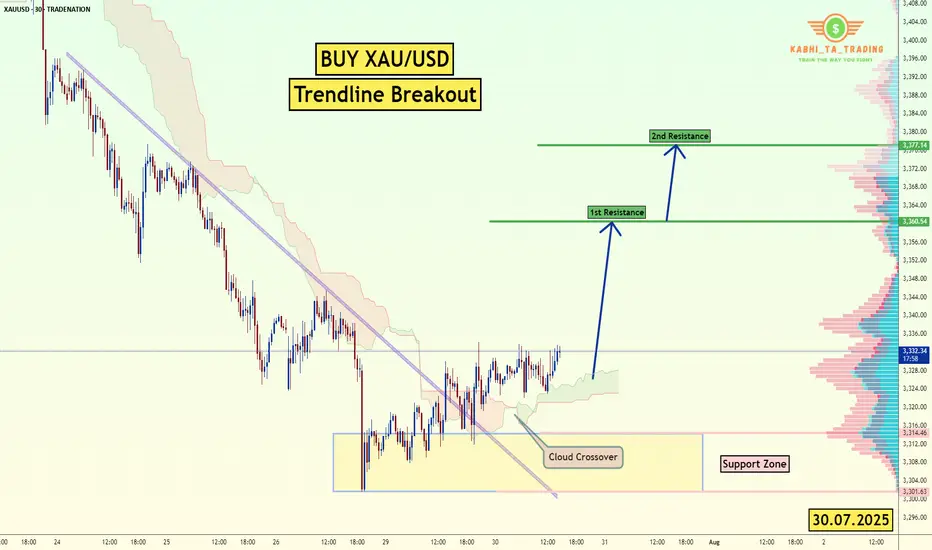
XAU/USD Trendline Breakout (30.07.2025)The XAU/USD pair on the M30 timeframe presents a Potential Buying Opportunity due to a recent Formation of a Trendline Breakout Pattern. This suggests a shift in momentum towards the upside and a higher likelihood of further advances in the coming hours.
Possible Long Trade:
Entry: Consider Entering A Long Position around Trendline Of The Pattern.
Target Levels:
1st Resistance – 3360
2nd Resistance – 3377
🎁 Please hit the like button and
🎁 Leave a comment to support for My Post !
Your likes and comments are incredibly motivating and will encourage me to share more analysis with you.
Best Regards, KABHI_TA_TRADING
Thank you.
Disclosure: I am part of Trade Nation's Influencer program and receive a monthly fee for using their TradingView charts in my analysis.
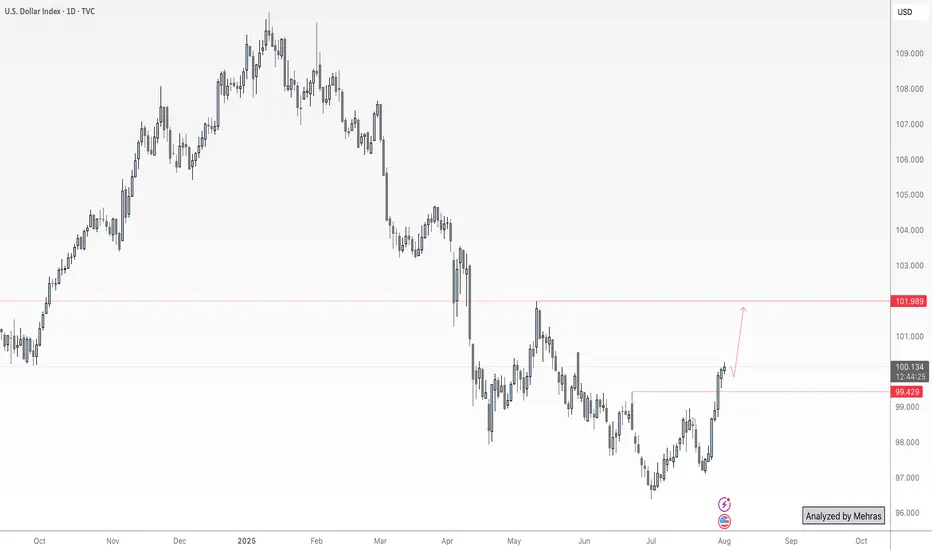
NFP Volatility Ahead – Is the Dollar Ready to Break Higher?🟢 DXY Outlook – A Key Day for the Dollar Index
Yesterday’s monthly candle closed with strong bullish momentum, marking a powerful start to August. Today, on the first trading day of the month, we’re expecting three major U.S. economic releases:
NFP, Average Hourly Earnings (m/m), and the Unemployment Rate.
As discussed in last week’s outlook, DXY has successfully broken above the key 100 level and confirmed a monthly close above it — a significant technical development. With no major order blocks or visible resistance in the way, the path toward the 102 target appears technically clear.
That said, I anticipate mixed data from today’s releases — which means we could see both sides of liquidity being taken during the initial reaction. Price might dip toward lower zones temporarily to collect liquidity before resuming its bullish move toward 102.
📌 In summary:
From a swing perspective, I believe the direction remains bullish for the Dollar Index as long as we hold above the 100 level.
When I say the data might be “mixed,” I mean the market could show an initial drop toward lower zones at the time of release — not because of a reversal, but to grab liquidity before continuing higher toward the 102 target.
Unless we see something unexpectedly extreme in the numbers, I expect the DXY to remain on track to reach the 102 level in the coming days or next week.
🔁 This analysis will be updated whenever necessary.
Disclaimer: This is not financial advice. Just my personal opinion.
Tesla - The all time high breakout!🚗Tesla ( NASDAQ:TSLA ) will break out soon:
🔎Analysis summary:
For the past five years Tesla has overall been consolidating between support and resistance. But following the recent bullish break and retest, bulls are slowly taking over control. It is actually quite likely that Tesla will soon break above the previous all time highs.
📝Levels to watch:
$400
🙏🏻#LONGTERMVISION
SwingTraderPhil

The idea of shorting on rallies below 3315 remains unchanged.Gold remains generally weak, with multiple rebounds showing signs of fatigue. The upward moving average continues to suppress prices, indicating that the bearish trend remains intact, and the short-term market outlook remains bearish. Trading strategies remain bearish today, with a key focus on the 3300-3315 area, a key short-term resistance zone. If the market rebounds before the US market opens and approaches this area, or if a clear topping signal appears near this range, consider entering a short position. Today will see the release of the non-farm payroll data, which may influence the market's trajectory. We recommend prioritizing short-term trading before the release, and reconsidering the market's direction based on market feedback after the release. Structurally, gold continues to exhibit a volatile downward trend, with lower highs and lower lows. Today's low is expected to be lower than yesterday's. Short-term short positions are focused on 3285-3280, with a break below this level potentially allowing for further declines. Please carefully time your entry, strictly implement risk management, and avoid emotional trading.
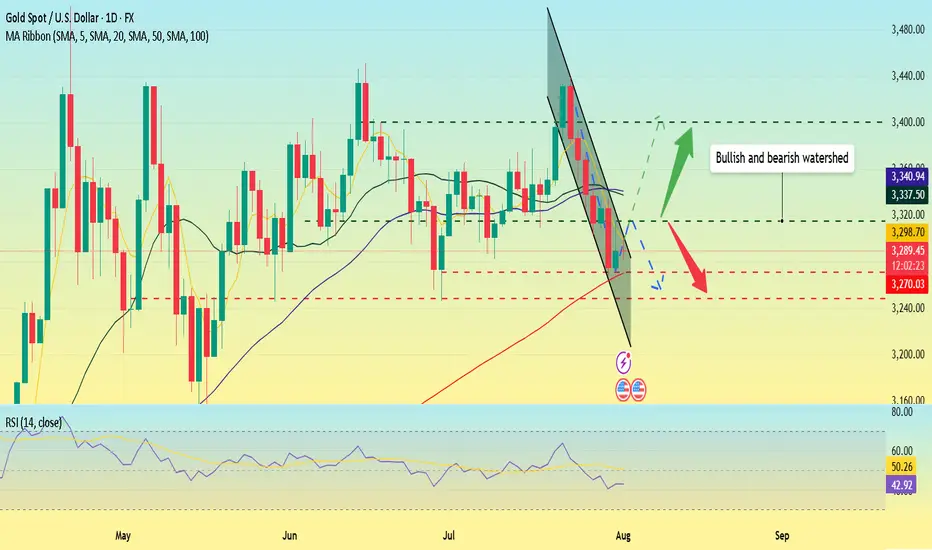
Impact of the Non-Farm Payrolls? Latest Analysis.Information Summary:
Most traders are turning their attention to the crucial US labor market report, which is being closely watched as the market actively searches for new clues regarding the timing of the next interest rate cut this year.
The July non-farm payrolls report will be released at 8:30 AM US time. US non-farm payrolls increased by 110,000 in July, seasonally adjusted, lower than the 147,000 increase in June. The US unemployment rate is expected to rise from 4.1% to 4.2% in July.
If the non-farm payrolls figure falls below 100,000 and the unemployment rate rises, it could signal a weakening job market, undermining the Fed's rekindled hawkish outlook and dampening the dollar's upward momentum. In this scenario, gold prices could re-cross the 3,400 mark. However, if the non-farm payrolls unexpectedly exceed 150,000, it could support the dollar's continued rise and hurt gold. Strong US employment data could rule out two rate cuts from the Fed this year.
Market Analysis:
Quaid believes that the current moving average crossover is trending downward, and downward momentum is still in play. The RSI remains at 42.7, hovering below the midline, indicating that gold's downward trend remains intact. The 20-day moving average fell below the 50-day moving average on Wednesday, confirming the bearish momentum.
Therefore, if gold closes below the key support level of the 100-day moving average at $3,270 on a weekly basis, a new downtrend could begin, potentially leading to a drop towards the June 30 low of $3,248.
Quaid believes that the current bull-bear watershed needs to focus on around 3315, which is the previous intensive trading area and is also the first resistance position for short-term upward movement.
On the last trading day of Super Data Week, Quaid hopes that everyone has gained something and has a happy weekend; I wish you all good luck.