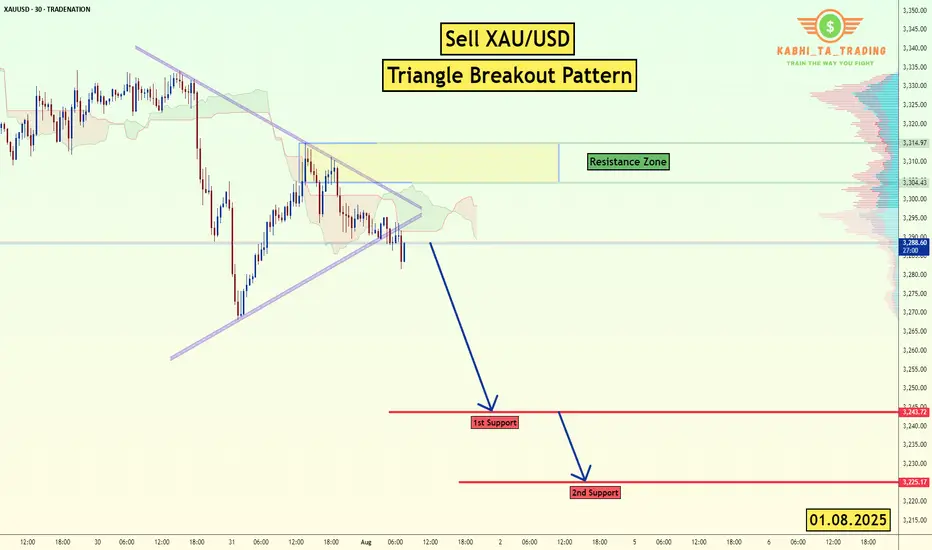
XAU/USD (Gold) - Triangle Breakout (1.08.2025)The XAU/USD Pair on the M30 timeframe presents a Potential Selling Opportunity due to a recent Formation of a Triangle Breakout Pattern. This suggests a shift in momentum towards the downside in the coming hours.
Possible Short Trade:
Entry: Consider Entering A Short Position around Trendline Of The Pattern.
Target Levels:
1st Support – 3249
2nd Support – 3225
🎁 Please hit the like button and
🎁 Leave a comment to support for My Post !
Your likes and comments are incredibly motivating and will encourage me to share more analysis with you.
Best Regards, KABHI_TA_TRADING
Thank you.
Disclosure: I am part of Trade Nation's Influencer program and receive a monthly fee for using their TradingView charts in my analysis.
Fundamental-analysis
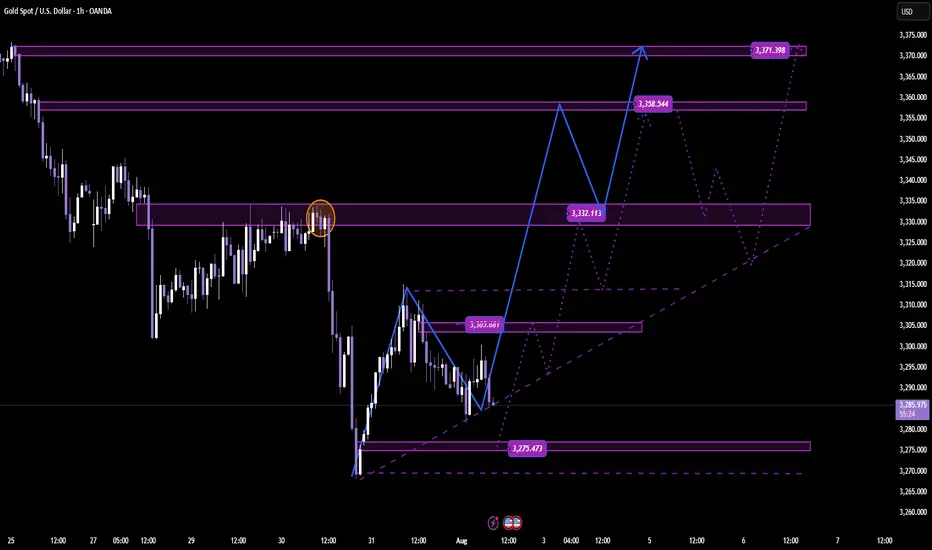
DAILY SCALPING PLAN | CLINTON SMC STYLE✅ XAU/USD - DAILY SCALPING PLAN | CLINTON SMC STYLE
📆 Date: August 1st, 2025
📍 Strategy: Smart Money Concepts (SMC)
🔑 Focus: Liquidity Sweep | Order Block | BOS | Premium/Discount Model
🔍 Market Overview
Gold (XAU/USD) is currently in a manipulation phase after a strong move down from a premium supply zone. The market has swept key liquidity and is preparing for a high-probability move in both directions based on Smart Money footprints.
Current structure suggests:
Bullish intent forming from a discount demand zone.
Liquidity resting above recent highs – perfect for short-term scalps and intraday swings.
🟢 BUY SETUP – DISCOUNT DEMAND REACTION
🎯 Entry: 3275
🛡️ Stop Loss: 3268
🎯 Take Profits:
TP1: 3285
TP2: 3295
TP3: 3305
TP4: 3315
TP5: 3325
TP6: 3335
Reasoning:
This is a clean bullish OB resting beneath a CHoCH and BOS zone. Price may wick into this area as Smart Money reloads after sweeping early long positions. If held, expect sharp upside expansion toward previous liquidity highs.
🔴 SELL SETUP – PREMIUM SUPPLY REJECTION
🎯 Entry: 3356
🛡️ Stop Loss: 3362
🎯 Take Profits:
TP1: 3350
TP2: 3345
TP3: 3340
TP4: 3330
TP5: 3320
Reasoning:
This level is a key supply block where price previously distributed. If price expands into this zone, it’s likely to act as a liquidity magnet for Smart Money to offload longs and enter short-term shorts. Expect reaction.
🧠 SMC Insights
Internal BOS & CHoCH signal early signs of accumulation.
Price respects the premium vs. discount framework with clear liquidity targets.
SMC traders understand that price doesn’t move randomly – it targets liquidity, mitigates OBs, and respects structure.
🔔 Note:
Always wait for clear confirmation (rejection wick, engulfing pattern, or M15 structure shift) before execution. Entries without confirmation are riskier in current volatility.
📌 Follow @ClintonScalper for daily SMC scalping plans & deep institutional insight.
🔁 Like, comment & share if you find this helpful!
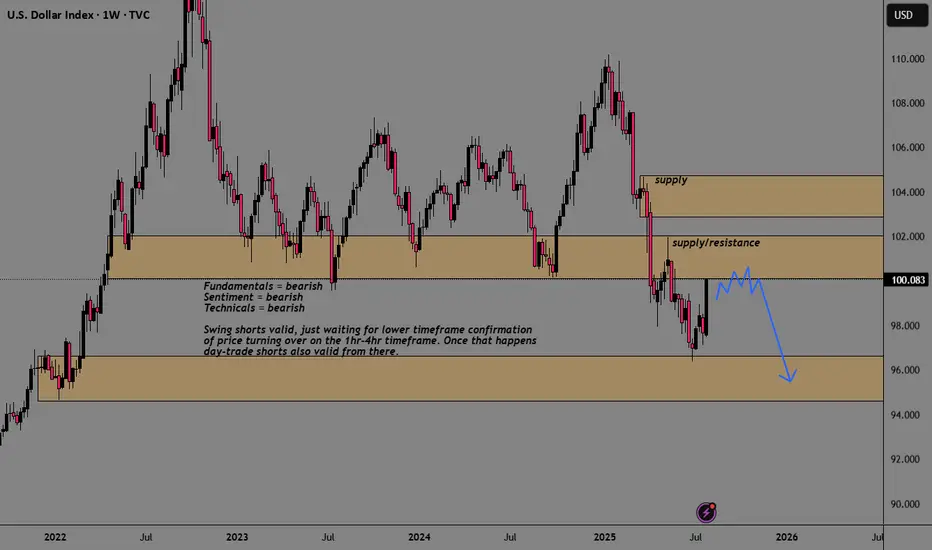
DXY USDOLLAR CRASH Incoming!Long-term fundamentals are bearish
Long-term sentiment = bearish
Long-term technicals = bearish
Trump wants a weaker dollar + FED injecting endless amounts of cash into the markets
driving stocks/ gold up, and the dollar down, losing purchasing power.
My plan is to look for shorts on the 1hr-4hr timeframe with lower timeframe confirmation.
Once price starts turning over, day-traders can join in.
Agree or disagree?
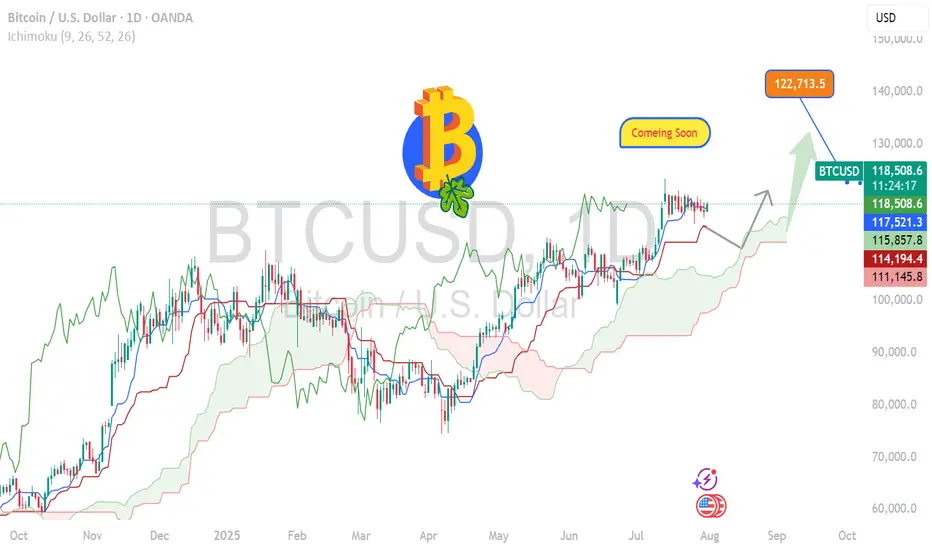
BITCOIN- Charging Towards 122k Momentum Building BTC/USD Long Setup – Targeting 122K 🔥
Bitcoin is holding strong above 118500, signaling bullish momentum.
✅ Price broke key resistance & forming higher lows.
🟢 Current structure favors buy-side continuation with next major target at 122000.
Support Zones:
🔹 117800 – intraday bullish retest
🔹 116500 – strong demand zone
Resistance Ahead:
🔸 120200 – short-term reaction
🔸 122000 – major target
🚀 Expecting bullish wave continuation.
If momentum sustains above 118K, 122K breakout highly probable!
#BTC #Bitcoin #CryptoSetup #BTCUSD #CryptoTrading #BTC122K #ChartAnalysis #BullishBreakout
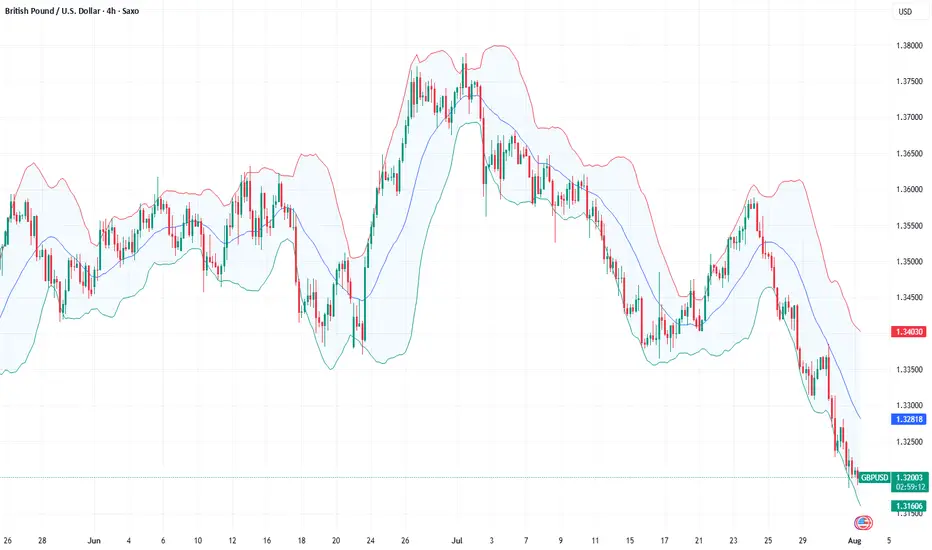
Fundamental Market Analysis for August 1, 2025 GBPUSDThe pound remains under pressure due to the strengthening of the dollar and expectations of further easing of the Bank of England's policy at its meeting on August 7. The regulator's rhetoric in June-July pointed to a “gradual and cautious” course of rate cuts amid weak growth, and the market is pricing in the likelihood of another move at the next meeting. The situation is complicated by the fact that July inflation in Britain unexpectedly accelerated, but the regulator interprets it as a temporary consequence of tariff and price shocks, not wanting to tighten financial conditions excessively.
The external environment is also unfavorable for the GBP: the US has imposed new tariffs on a number of trading partners, strengthening demand for the dollar as a risk-free asset. For the UK, the trade implications are mixed: part of the supply chain is focused on the dollar zone, and industry is sensitive to global demand, which, in the context of prolonged uncertainty, is hitting investment and employment expectations. The risks of a decline in private sector business activity remain elevated.
Today, attention is focused on US employment data: if the labor market confirms its stability, the likelihood of a Fed rate cut in September will decrease further, which will keep the dollar in the ascendancy. All these factors combined create a bearish bias for GBPUSD in the short term, with any brief rebounds from local oversold conditions typically being used for selling.
Trading recommendation: SELL 1.32000, SL 1.32500, TP 1.31000
FOMC rate decision 30-07-2025FOMC announced no change to interest rate, but the new tariffs is the major player for the upcoming quarter, we shall see its effect on the economy and corporates earnings soon, then the fed can make better judgment whether to lower interest rate or not.
Disclaimer: This content is NOT a financial advise, it is for educational purpose only.

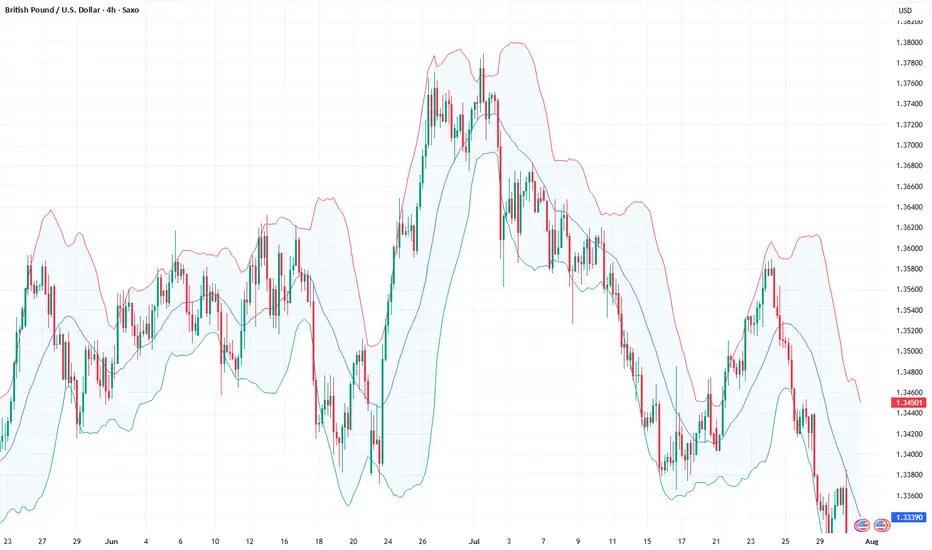
Fundamental Market Analysis for July 31, 2025 GBPUSDGBPUSD:
The pound remains under pressure as consumer spending and the labor market in the UK are weakening, reducing the likelihood of an aggressive response from the Bank of England. Core inflation has dropped to 3.3% y/y – the lowest in two years – allowing the regulator to keep rates steady for longer.
External factors are also unfavorable: demand for the defensive dollar is strengthening ahead of the FOMC meeting, and the yield spread between 10-year gilts and USTs has narrowed to 115 basis points – the lowest since March, stimulating flows into the dollar.
Additional negative dynamics come from the rise in the UK current account deficit to 3.9% of GDP, amid higher prices for imported energy and declining exports of services. Expectations of tighter fiscal consolidation are increasing fiscal risks and encouraging investors to reduce long GBP positions.
Risks to the bearish outlook are limited: these would be a surprise in the form of hawkish Bank of England comments or a sharp deterioration in US macro data that could weaken the dollar.
Trade recommendation: SELL 1.32700, SL 1.32900, TP 1.31700
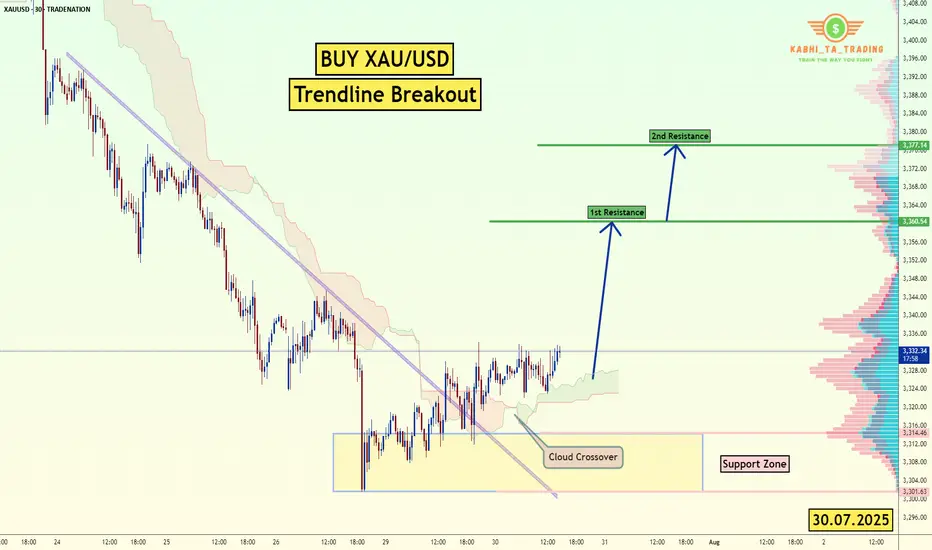
XAU/USD Trendline Breakout (30.07.2025)The XAU/USD pair on the M30 timeframe presents a Potential Buying Opportunity due to a recent Formation of a Trendline Breakout Pattern. This suggests a shift in momentum towards the upside and a higher likelihood of further advances in the coming hours.
Possible Long Trade:
Entry: Consider Entering A Long Position around Trendline Of The Pattern.
Target Levels:
1st Resistance – 3360
2nd Resistance – 3377
🎁 Please hit the like button and
🎁 Leave a comment to support for My Post !
Your likes and comments are incredibly motivating and will encourage me to share more analysis with you.
Best Regards, KABHI_TA_TRADING
Thank you.
Disclosure: I am part of Trade Nation's Influencer program and receive a monthly fee for using their TradingView charts in my analysis.
BA: Boeing down on better than expected results! 30-07-2025Yesterday we get Boeing earnings report which came better than expected, but the stock down more than 4% as the company is not expected to make positive profit or free cashflow before 2026. No dividends currently paid, so there is nothing attractive to me now.
Disclaimer: This content is NOT a financial advise, it is for educational purpose only.

DCF VALUATION ANALYSIS OF BSEConclusion: OVERVALUED
:-OVERVIEW
BSE Limited has shown strong financial growth in recent years. Its revenue jumped from ₹924.84 crore in FY23 to ₹1,592.50 crore in FY24 (a 72% increase), and further surged to ₹3,212 crore in FY25, doubling year-on-year. EBITDA grew impressively to ₹1,779 crore in FY25 with a 60% increase, and EBIT reached ₹1,670 crore, up 56%. Net profit also rose significantly to ₹1,112 crore, with earnings per share increasing to ₹81. Dividend per share improved to ₹23, reflecting healthy returns
DCF:
-The valuation was performed using a Discounted Cash Flow (DCF) approach based purely on verified financial data and market risk parameters without relying on user-specific growth assumptions.
-The cost of equity was calculated using an adjusted risk-free rate plus equity risk premium multiplied by beta, resulting in a discount rate of approximately 13.58%. The terminal growth rate was conservatively taken as 4%. Using these reliable inputs and actual EBIT cash flows, the intrinsic enterprise value was estimated at around ₹36,839 crore, translating to an intrinsic value per share of approximately ₹1,364.
-Currently, BSE’s market price is around ₹2,480 per share, which is substantially higher than the intrinsic value derived from fundamentals, indicating the stock is trading at a significant premium. This valuation is grounded in audited company financials and globally accepted valuation methodologies, providing a trustworthy reference point for investors.

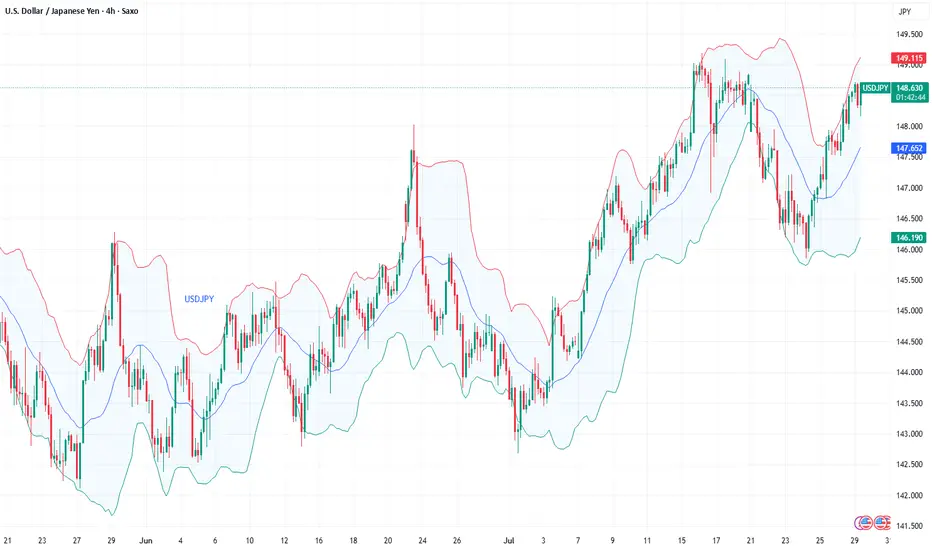
Fundamental Market Analysis for July 29, 2025 EURUSDThe pair is consolidating at 148.500, leaving behind a nearly 1% gain since the start of the week. High Treasury yields (10-year bonds — 4.34%) are supporting demand for the dollar, while the easing of the US-Japan trade conflict is reducing defensive demand for the yen. As part of yesterday's statement by the US Treasury, tariffs on Japanese cars are being reduced to 10%, which improves the outlook for export-oriented corporations, but at the same time reduces investors' need for safe-haven currencies.
Despite inflation of 3.7% y/y and rising food costs, the Bank of Japan is likely to keep its rate at 0.5% following its July 30-31 meeting and only revise its CPI forecasts upward. Former Deputy Governor of the Central Bank Hiroshi Nakaso acknowledges that further increases are only possible after assessing the effect of US tariffs, i.e., not before 2026. This scenario reinforces negative real interest rates and a widening yield differential with the US.
In addition, the inflow of Japanese investment into foreign bonds has resumed amid confidence in a gradual, rather than sharp, normalization of BOJ policy. Taken together, these factors point to the likelihood of a test of 150.00 in the coming days in the absence of verbal intervention by the Japanese Ministry of Finance.
Trading recommendation: BUY 148.500, SL 147.900, TP 150.500
Fundamental Market Analysis for July 28, 2025 GBPUSDThe pound is sliding to 1.34250, reacting to a fresh slowdown in UK inflation and reduced expectations of further tightening from the Bank of England. The annual CPI for June fell to 2.2%, the lowest since March 2022, allowing the regulator to keep rates unchanged at the August meeting.
Meanwhile, rising Treasury yields intensify capital inflows into dollar assets after a strong US Q2 GDP report (+2.4% q/q). The British economy remains close to stagnation: the services PMI fell to 49.8, indicating shrinking orders and wage pressure.
Political risks also weigh on the pound: the ruling party's parliamentary majority shrank after unscheduled by-elections, complicating the government's implementation of fiscal stimulus. Collectively, this increases the attractiveness of selling the pair ahead of the Fed meeting, where markets price in a possible rate hike by year-end.
Trade recommendation: SELL 1.34250, SL 1.34450, TP 1.33250

USOIL Analysis : MMC Bullish Setup Building on USOIL – Target🧠 Introduction & Trade Philosophy
In today’s 4H USOIL chart analysis, we are at a critical decision-making zone, where price action is preparing to make a major move in either direction, based on the response to a central demand zone. We are applying the MMC Rule, which emphasizes mirroring supply-demand behavior and validating market moves through structural confirmation.
The current price structure presents a classic MMC scenario, where price must either confirm a bullish double demand reaction or invalidate the setup by breaking the key zone and moving bearish.
📍 Chart Structure Explained
🔷 1. Central Reversal Zones (CRZs)
There are two CRZs highlighted:
The upper CRZ around 65.90–66.20, where price was previously rejected.
The lower CRZ, where price is currently consolidating, is around 64.80–65.50.
These zones are liquidity-rich areas where big players react—either by absorbing positions or driving directional moves.
🟢 2. Bullish Scenario – MMC Rule In Play (Path 1)
"If we want it bullish, we want 50% supply and demand will be double according to MMC Rule"
According to MMC, a bullish move must be confirmed by a strong reaction from demand, showing double the pressure of the last bearish move. Here's how that plays out:
Price respects the lower CRZ, bouncing near the 65.00 mark.
If this bounce gains momentum and breaks above the trendline resistance, the first target is the minor resistance at $69.00, followed by the major resistance zone near $70.50–$71.00.
A retest of broken structure, followed by bullish continuation, is expected. This is marked with the white zigzag projection labeled as “1” on the chart.
Watch for a clear higher high formation, which would indicate a shift in structure and validate bullish momentum.
🔻 3. Bearish Scenario – Breakdown Confirmation (Path 2)
"If it breaks, USOIL will go bearish"
If price fails to hold the current demand and closes below $64.80–64.50, it signals that demand has been absorbed, and MMC reversal has failed. In that case:
A clean breakdown below the demand zone will confirm bearish control.
The next downside target becomes $62.00, as labeled “2” on the chart.
The downward move is likely to follow a steep path as marked with the sharp downward trendline extension, especially if supported by volume and news catalysts.
🔄 Mirror Concept Highlight – Ellipse Area
The ellipse shape on the chart marks a previous compression zone followed by a breakout. This area represents an imbalance in supply that led to a sell-off. The MMC principle suggests the market tends to mirror these zones—if that was previous supply, and the current demand zone mirrors its positioning and structure, we can anticipate a similar reaction, but to the upside.
This is where the "50% double reaction" rule comes in—demand needs to show twice the strength to overcome the previous sell-side pressure.
🔧 Technical Levels Summary
Zone Type Price Range Notes
Major Resistance 70.50 – 71.00 Final target if bullish scenario plays out
Minor Resistance 68.80 – 69.20 First bullish checkpoint
Upper CRZ 65.90 – 66.20 Key structure to break for bulls
Lower CRZ (Support) 64.80 – 65.50 Demand base for bullish setup
Bearish Target Zone 62.00 – 61.80 Projected zone if support breaks
🧭 Trader’s Mindset & Risk Notes (MMC Style)
Wait for clear confirmation and price behavior near the CRZs before entering.
Use trendline breaks, candlestick confirmation, and volume to validate direction.
Avoid guessing the direction—let price tell the story.
Stick to MMC rules: No confirmation, no position.
✅ Bullish Criteria Checklist:
✔️ Price respects lower CRZ
✔️ Breakout above trendline
✔️ Closes above $66.20
✔️ Higher highs + strong bullish candles
✔️ MMC Double Demand Reaction Confirmed
❌ Bearish Breakdown Triggers:
❌ Breaks below $64.50
❌ Weak bounce + lower highs
❌ Volume increases on downside
❌ Clean breakdown structure
🚀 Trade Plan & Outlook
We’re now at a critical zone where market sentiment will soon be clear. Based on your MMC analysis, the bias remains bullish as long as price holds above $64.80. Be patient and let the setup complete with structure confirmation.
This is not just a technical play—it's a psychological zone, where institutional traders also make decisions. Follow the MMC logic and react with confirmation.

GBP/CAD - H4 - Bearish Flag (26.07.2025)The GBP/CAD Pair on the H4 timeframe presents a Potential Selling Opportunity due to a recent Formation of a Bearish Flag Pattern. This suggests a shift in momentum towards the downside in the coming Days.
Possible Short Trade:
Entry: Consider Entering A Short Position around Trendline Of The Pattern.
Target Levels:
1st Support – 1.8242
2nd Support – 1.8139
🎁 Please hit the like button and
🎁 Leave a comment to support for My Post !
Your likes and comments are incredibly motivating and will encourage me to share more analysis with you.
Best Regards, KABHI_TA_TRADING
Thank you.
Disclosure: I am part of Trade Nation's Influencer program and receive a monthly fee for using their TradingView charts in my analysis.

TON/USDT - Bullish Channel in H4 (27.07.2025)The TON/USDT pair on the H4 timeframe presents a Potential Buying Opportunity due to a recent Formation of a Bullish Channel Pattern. This suggests a shift in momentum towards the upside and a higher likelihood of further advances in the coming Days.
Possible Long Trade:
Entry: Consider Entering A Long Position around Trendline Of The Pattern.
Target Levels:
1st Resistance – 3.770
2nd Resistance – 3.989
🎁 Please hit the like button and
🎁 Leave a comment to support for My Post !
Your likes and comments are incredibly motivating and will encourage me to share more analysis with you.
Best Regards, KABHI_TA_TRADING
Thank you.

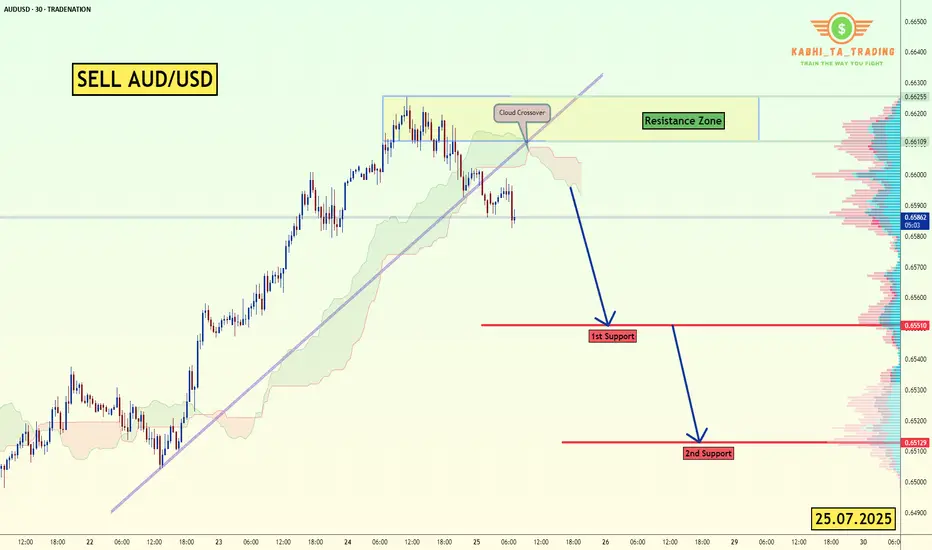
AUD/USD - Breakout (25.07.2025)The AUD/USD Pair on the M30 timeframe presents a Potential Selling Opportunity due to a recent Formation of a Trendline Pattern. This suggests a shift in momentum towards the downside in the coming hours.
Possible Short Trade:
Entry: Consider Entering A Short Position around Trendline Of The Pattern.
Target Levels:
1st Support – 0.6551
2nd Support – 0.6513
🎁 Please hit the like button and
🎁 Leave a comment to support for My Post !
Your likes and comments are incredibly motivating and will encourage me to share more analysis with you.
Best Regards, KABHI_TA_TRADING
Thank you.
Disclosure: I am part of Trade Nation's Influencer program and receive a monthly fee for using their TradingView charts in my analysis.
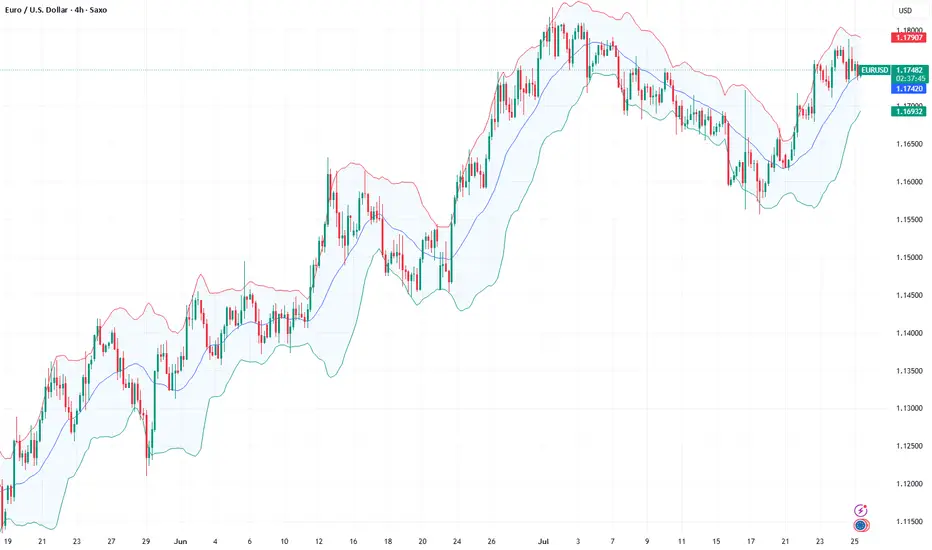
Fundamental Market Analysis for July 25, 2025 EURUSDThe euro remains under pressure as the bond yield gap is once again widening in favor of the dollar following comments from Fed Chair Powell about the need to “keep policy tight for longer” to counteract the inflationary effects of new US tariffs. Additional support for the dollar came from the increase in June retail sales and a decline in jobless claims, which confirms the resilience of the US economy and pushes expectations for the first rate cut toward the year-end.
From the European side, euro support is undermined by signs of slowing activity: the GfK consumer confidence index in Germany remains below its historical average, and preliminary July eurozone PMIs, despite some improvement, still indicate an uneven recovery of the real sector. Further pressure comes from ongoing uncertainty around EU–US trade talks; Washington is still discussing the possibility of 15% tariffs, which threatens the bloc’s export prospects and fuels demand for the safe-haven dollar.
With monetary policy divergence and tariff escalation risks persisting, the pair is likely to continue correcting toward 1.17. Investors are awaiting tomorrow’s US PCE data, which could reinforce expectations of the Fed maintaining a “hawkish” stance and cement the downward trend.
Trade recommendation: SELL 1.17350, SL 1.17550, TP 1.16350
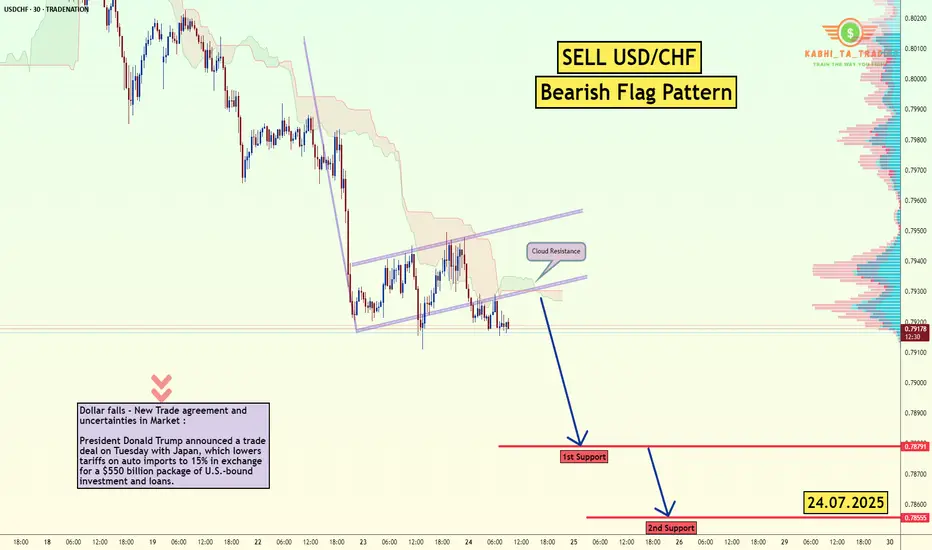
USD/CHF - Bearish Flag (24.07.2025)Fundamental Updates :
Dollar falls - New Trade agreement and uncertainties in Market :
President Donald Trump announced a trade deal on Tuesday with Japan, which lowers tariffs on auto imports to 15% in exchange for a $550 billion package of U.S.-bound investment and loans.
The USD/CHF Pair on the M30 timeframe presents a Potential Selling Opportunity due to a recent Formation of a Bearish Flag Pattern. This suggests a shift in momentum towards the downside in the coming hours.
Possible Short Trade:
Entry: Consider Entering A Short Position around Trendline Of The Pattern.
Target Levels:
1st Support – 0.7878
2nd Support – 0.7855
🎁 Please hit the like button and
🎁 Leave a comment to support for My Post !
Your likes and comments are incredibly motivating and will encourage me to share more analysis with you.
Best Regards, KABHI_TA_TRADING
Thank you.
Disclosure: I am part of Trade Nation's Influencer program and receive a monthly fee for using their TradingView charts in my analysis.
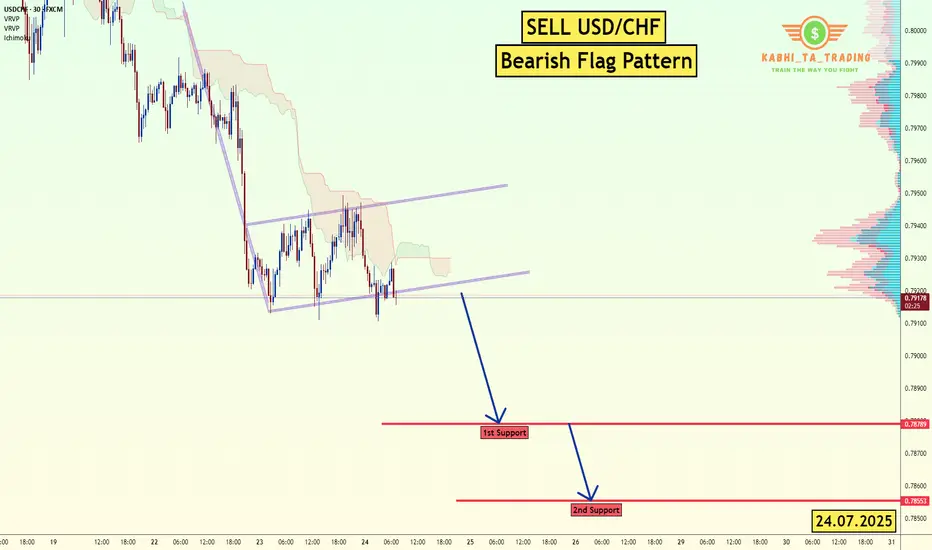
USD/CHF - Bearish Flag (24.07.2025)The USD/CHF Pair on the M30 timeframe presents a Potential Selling Opportunity due to a recent Formation of a Bearish Flag Pattern. This suggests a shift in momentum towards the downside in the coming hours.
Possible Short Trade:
Entry: Consider Entering A Short Position around Trendline Of The Pattern.
Target Levels:
1st Support – 0.7878
2nd Support – 0.7855
🎁 Please hit the like button and
🎁 Leave a comment to support for My Post !
Your likes and comments are incredibly motivating and will encourage me to share more analysis with you.
Best Regards, KABHI_TA_TRADING
Thank you.
Disclosure: I am part of Trade Nation's Influencer program and receive a monthly fee for using their TradingView charts in my analysis.
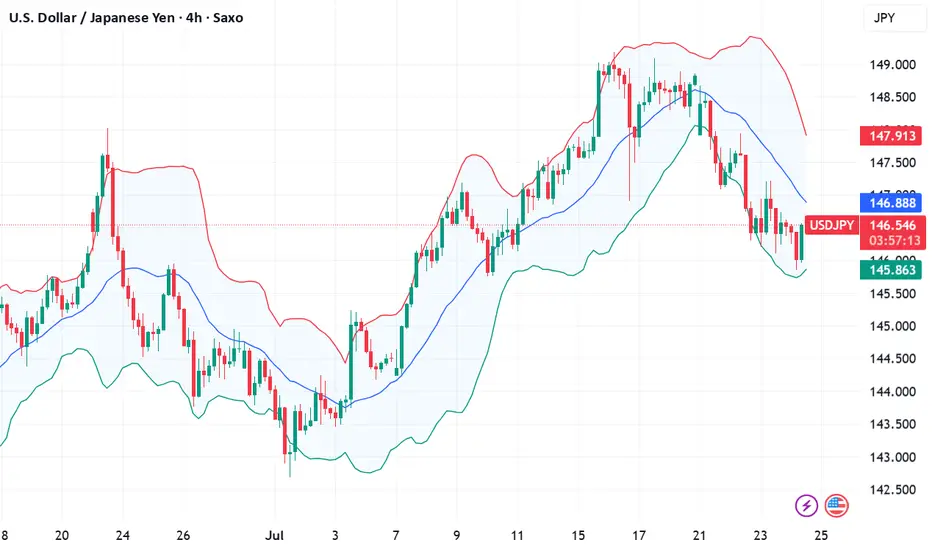
Fundamental Market Analysis for July 24, 2025 USDJPYThe Japanese yen (JPY) strengthened against its US counterpart for the fourth consecutive day and reached a nearly three-week high during Asian trading on Thursday. The recently announced trade deal between Japan and the US reduces economic uncertainty and increases the likelihood that the Bank of Japan (BoJ) will resume its tightening cycle at the end of this year, which in turn is seen as a key factor continuing to support the JPY. The US dollar (USD), on the other hand, is languishing near two-and-a-half-week lows and is putting additional pressure on the USD/JPY pair.
However, domestic political uncertainty and disappointing data on Japan's manufacturing PMI may keep yen bulls from aggressive bets. Moreover, the optimistic market sentiment should help limit the safe-haven yen's gains and further losses for the USD/JPY pair. Traders are now eagerly awaiting the release of US flash PMI indices to take advantage of short-term opportunities later in the North American session. However, the mixed fundamental backdrop calls for caution before making aggressive directional bets.
Trade recommendation: SELL 146.00, SL 147.10, TP 145.00
KO: Coca-Cola (CFD) Earnings 23-07-2025Yesterday we have the Coca-Cola earnings report came out and beat on both earning and revenue. But due to the technical position I do not see it a good entry on the stock CFD, still see PepsiCo stock CFD is a better option.
Disclaimer: This content is NOT a financial advise, it is for educational purpose only.

Fundamental Market Analysis for July 23, 2025 GBPUSDSterling is struggling to hold above 1.35 as fundamentals tilt against it. US CPI has accelerated to 2.7 % y/y, reinforcing expectations that the Fed will delay its easing cycle, whereas in the UK subdued GDP growth and a cooling labour market have revived talk of a Bank of England rate cut as early as August.
Political noise adds to the pressure: London must balance the US’s hard‑line trade stance with the need to mend ties with the EU, heightening uncertainty for businesses. Meanwhile, capital is flowing toward higher‑yielding US Treasuries, sapping demand for UK assets.
The situation is compounded by Britain’s persistent current‑account deficit, which—amid a stronger dollar—requires ever‑higher risk premia to finance. All told, short positions in cable with a tight stop above 1.35750 look attractive in the short run.
Trade recommendation: SELL 1.35250, SL 1.35750, TP 1.34750

VZ: Verizon stock update after earningsVerizon jumped on positive results, which aligned with my bullish view on it.
Tomorrow will have its competitors T-Mobile & AT&T earnings result, this will update us on the industry as well. Most probably that I will go long on it in the next 24Hr.
Disclaimer: This content is NOT a financial advise, it is for educational purpose only.
