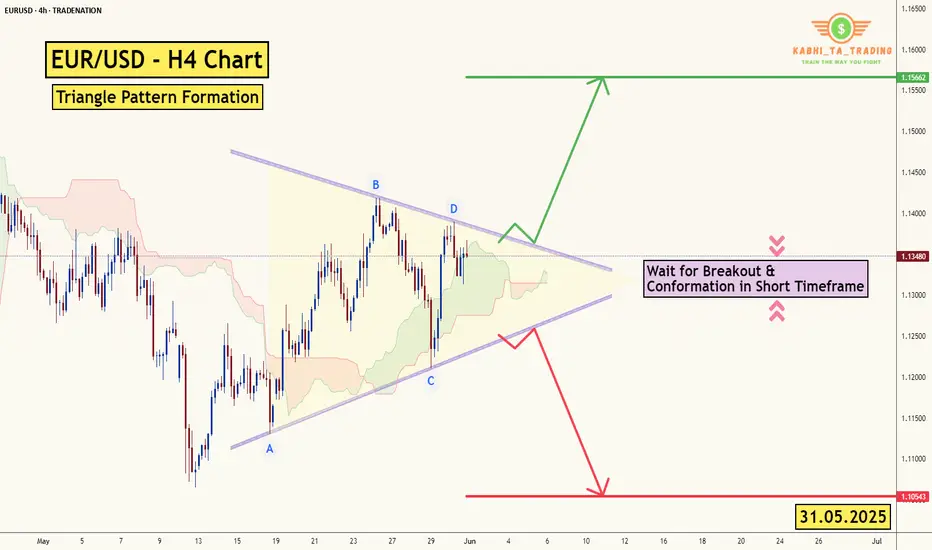
EUR/USD - H4 - Triangle Formation (31.05.2025)The EUR/USD pair on the H4 timeframe presents a recent Formation of a Triangle Pattern.
1. Wait for Breakout with Good Volume
2. Conformation in short Timeframe Must
🎁 Please hit the like button and
🎁 Leave a comment to support for My Post !
Fundamental Updates :
Dollar mixed on tariff uncertainty, U.S. President Donald Trump to battle a U.S. trade court ruling that blocked most of his proposed tariffs.
Your likes and comments are incredibly motivating and will encourage me to share more analysis with you.
Best Regards, KABHI_TA_TRADING
Thank you.
Disclosure: I am part of Trade Nation's Influencer program and receive a monthly fee for using their TradingView charts in my analysis.
Fundamental-analysis
Energy giants surge: Top 5 stocks to watchJune 2025 was marked by heightened volatility across the global energy sector . Amid fluctuating oil prices, geopolitical uncertainty, and ongoing industry transformation, major oil and gas companies delivered mixed results. Let’s break down the key drivers behind the moves in Shell, TotalEnergies, BP, Chevron, and Exxon Mobil.
Here are the five leaders that set the tone this June :
1. Shell: Steady growth driven by strategic adjustments . The stock climbed 7% thanks to a pragmatic dividend policy and a $3.5B share buyback plan. LNG Canada project developments also boosted investor confidence.
2. TotalEnergies: Strong performance backed by green energy push . Shares rose 5.5% after the acquisition of a renewable energy portfolio and a dividend increase. Conservative production forecast (+3% for 2025) and investment in clean energy kept demand strong.
3. BP: Recovery supported by oil price rebound . BP added around 7% on oil market stabilization and a new share buyback program. Although production declined due to asset sales, higher profitability in the oil segment offset the drop.
4. Chevron: Notable gains fueled by new projects . Chevron advanced 7.5% following the launch of the Ballymore field in the Gulf of Mexico. Expanded buyback and dividend plans further attracted investors.
5. Exxon Mobil : Stable upward momentum from production expansion. Shares jumped nearly 10% as Q1 profits reached $7.7B. Liquefied natural gas development and output growth targets energized traders.
FreshForex analysts believe the rally in energy majors may continue in the near term. Shell, TotalEnergies, BP, Chevron, and Exxon Mobil remain strong picks for active investors.

Gold on the Edge: Will US Debt Fears Spark a Breakout?XAUUSD – Gold on the Edge: Will US Debt Fears Spark a Breakout?
After weeks of muted movement, gold is coiling within a bearish channel — but a fresh warning from Goldman Sachs may be the trigger that changes everything. With concerns mounting over America’s fiscal future, gold could be preparing for a decisive shift.
🌐 Macro View – Goldman Sachs Sounds the Alarm
🔺 Goldman Sachs recently issued a critical warning:
US national debt is expected to exceed WWII levels, with interest payments topping $1 trillion by 2025, outpacing spending on defense and healthcare.
If urgent fiscal reforms aren’t implemented, the US could face a tightening cycle that slows GDP growth without reducing the debt-to-GDP ratio.
The root causes? Excessive spending, rising interest rates, and deep political gridlock.
📌 For global investors, this type of uncertainty is often bullish for gold — especially as a hedge against both inflation and US dollar instability.
📉 Technical Outlook (Updated – M30 to H1)
Gold is still trading inside a well-defined descending channel, with sellers firmly in control.
Price is currently hovering around the pivot zone at 3,338.42, with a possible short-term bounce toward 3,368.04, the upper edge of the channel.
EMA ribbons (13–200) are sharply aligned to the downside, signaling strong bearish momentum.
If the price fails to break above 3,368, the next key support zones lie at 3,325.78, and potentially 3,309.25, where unfilled fair value gaps (FVG) await.
✅ Trade Plan
🟢 BUY ZONE: 3310 – 3308
Stop-Loss: 3303
Targets: 3314 → 3318 → 3322 → 3326 → 3330 → 3340 → 3350 → 3360 →
🟢 BUY SCALP: 3325 – 3323
Stop-Loss: 3318
Targets: 3330 → 3334 → 3338 → 3342 → 3346 → 3350 → 3360 → 3370 →
🔴 SELL ZONE: 3418 – 3420
Stop-Loss: 3424
Targets: 3414 → 3410 → 3405 → 3400 → 3396 → 3390 → 3385 → 3380
🔻 SELL SCALP: 3396 – 3398
Stop-Loss: 3403
Targets: 3392 → 3388 → 3384 → 3380 → 3375 → 3370
💬 Closing Thoughts – A Volatile End to the Week?
With US markets returning from a bank holiday and macro pressure rising, volatility could spike to close the week.
✅ Stick to disciplined SL/TP levels. Avoid premature entries and let price confirm direction.
Gold remains technically bearish — but the global debt narrative could turn this market on its head.
Prepare. Observe. Strike only when the structure aligns.

Fundamental Market Analysis for June 20, 2025 USDJPYThe Japanese yen (JPY) strengthened slightly against the US dollar during Friday's Asian session and moved away from the monthly low reached the day before. Data released by the Japanese government showed that the annual consumer price index (CPI) in May remained well above the Bank of Japan's (BoJ) target of 2%. This confirms market expectations that the BoJ will raise interest rates again and is a key factor driving the moderate growth of the JPY.
Meanwhile, ongoing trade uncertainty and further escalation of geopolitical tensions in the Middle East continue to weigh on investor sentiment, further strengthening the JPY's status as a safe haven. In addition, the moderate decline in the US dollar (USD) is pulling the USD/JPY pair back towards the psychological level of 145.000. However, expectations that the BoJ may keep rates unchanged until the first quarter of 2026, as well as the Federal Reserve's (Fed) hawkish pause earlier this week, may limit the pair's losses.
Market participants are paying extra attention to upcoming economic releases from the US, including inflation and labor market data, which could influence the Fed's monetary policy trajectory. If the statistics prove strong, this could strengthen the dollar and put pressure on the yen. However, the continuing weakness in the global economic recovery and high Japanese inflation continue to support expectations of a gradual tightening of BoJ policy, creating an ambiguous outlook for the USD/JPY exchange rate in the short term.
Trading recommendation: SELL 145.400, SL 145.700, TP 144.300

Detailed technical analysis of the ETH/USD chart🧭 General Context (1D, Long-Term):
The chart covers the period from approximately September 2023 to June 2025.
ETH/USD has gone through a complete cycle: growth → decline → correction → potential consolidation/accumulation.
🔹 Market Structure (Price Action)
🔸 Trends:
November 2023 – March 2024: strong uptrend, ETH reaches highs around $4,000+
March 2024 – February 2025: clear downtrend ending with a local low around $1,600
February 2025 – May 2025: dynamic rebound – probable trend change (new higher low + higher high)
May – June 2025: currently consolidating between ~$2,400–2,800
📉 Key Support and Resistance Levels
Type Level Notes
🔴 Resistance ~2,800 – 2,900 Local high, many candles with shadows rejected from above
🟡 Resistance ~3,200 – 3,400 Beginning of strong declines from 2024
🟢 Support ~2,300 – 2,400 Local lows in June 2025
🟢 Strong support ~1,600 – 1,800 Final market low of March 2025 (possible accumulation phase)
📊 Technical indicators
✅ Stochastic RSI (at the bottom of the chart):
Currently in the oversold zone (~0–20) → may signal a potential bottom / buying opportunity
Red-blue lines are starting to wrap upwards → possible rebound
Recent crossovers of the indicator corresponded to local price movements
🔍 Technical formations
⚠️ Possible formations:
Double Bottom: February–March 2025 → classic trend reversal formation
Rising Channel: from March 2025 to present – prices are moving in a slightly rising channel
Current consolidation may be a bull flag (continuation after the increase)
📌 Summary – scenarios
🟢 Bullish scenario:
Breakout of resistance ~2,800 → possible test of levels 3,200 – 3,400 USD
Confirmation of a higher low → continuation of the uptrend
Stochastic RSI in the oversold zone → potential for an uptrend
🔴 Bearish scenario:
Drop below 2,300 USD → possible return to the area of 1,800–1,600 USD
Breakout of the structure of higher lows
Confirmation that the increase was only a correction
🧠 Final conclusions
Currently, ETH/USD is in a key decision zone: after a strong rebound, the market is resting.
Stochastic RSI suggests a potential upside impulse, but requires confirmation by a breakout of resistance.
For traders: 2,800 (resistance) and 2,300 (support) are worth watching.
For investors: 1,600–1,800 could be considered a long-term accumulation zone.

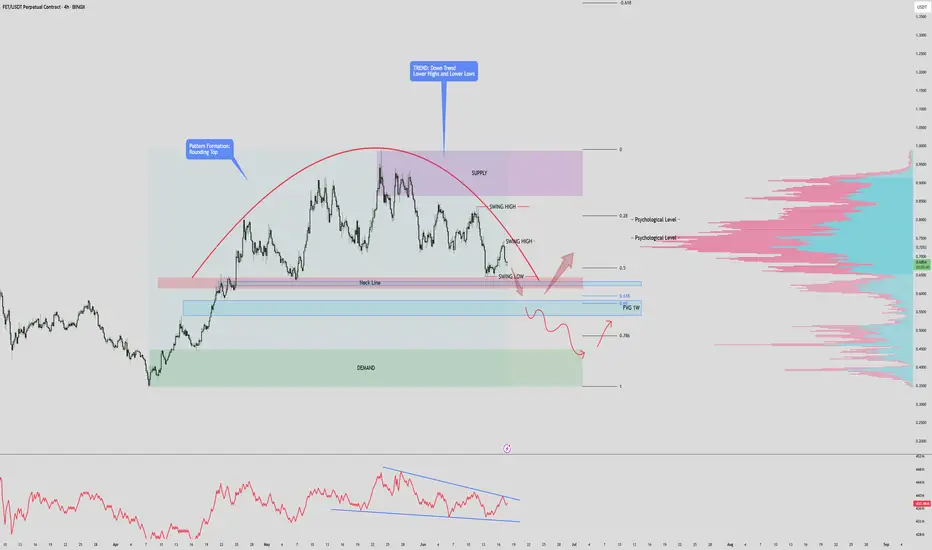
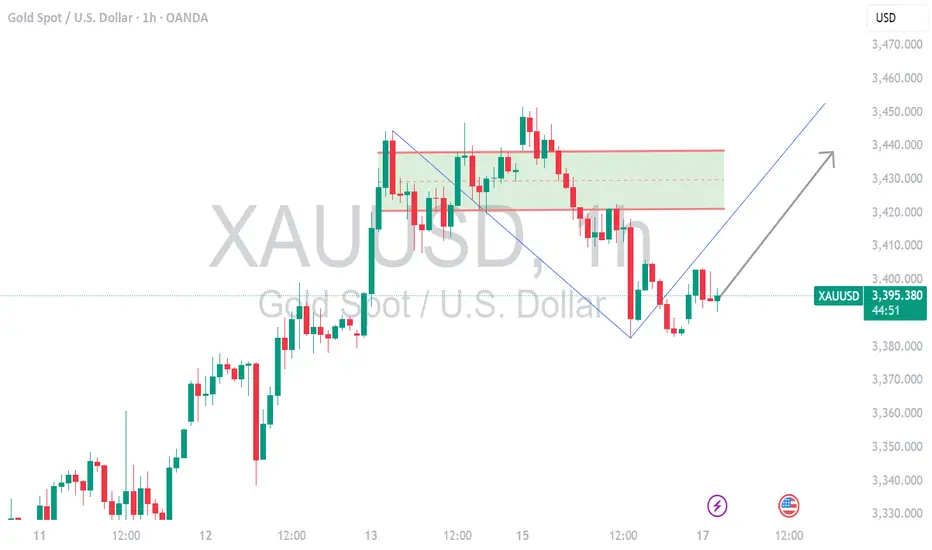
$FET 4Hr Time frame DUMP before PUMP? $1 Recovery!FET/USDT – 4H Time Frame Analysis
Pattern Formation: A rounding top is clearly visible, suggesting weakening bullish momentum and potential trend reversal.
Trend Structure: Price is forming lower highs and lower lows, confirming a bearish trend.
Key Zones:
Supply Zone: $0.85 – $0.975
Demand Zone: $0.35 – $0.45
Neckline Support: Price is approaching a critical neckline level. A break below this could trigger strong downside movement.
Weekly FVG & Fib Confluence:
Below the neckline lies a weekly Fair Value Gap (FVG).
The 0.618 Fibonacci retracement aligns with this zone, forming a golden pocket — a key support area.
Scenario 1 – Bullish Reversal:
If price holds above the golden pocket, a bounce could push it back toward psychological levels (e.g., $0.70 and $0.80)
Scenario 2 – Bearish Continuation:
If price fails to hold the FVG/GP zone, this invalidates bullish setups.
Expect a breakdown targeting the $0.35–$0.45 demand zone.
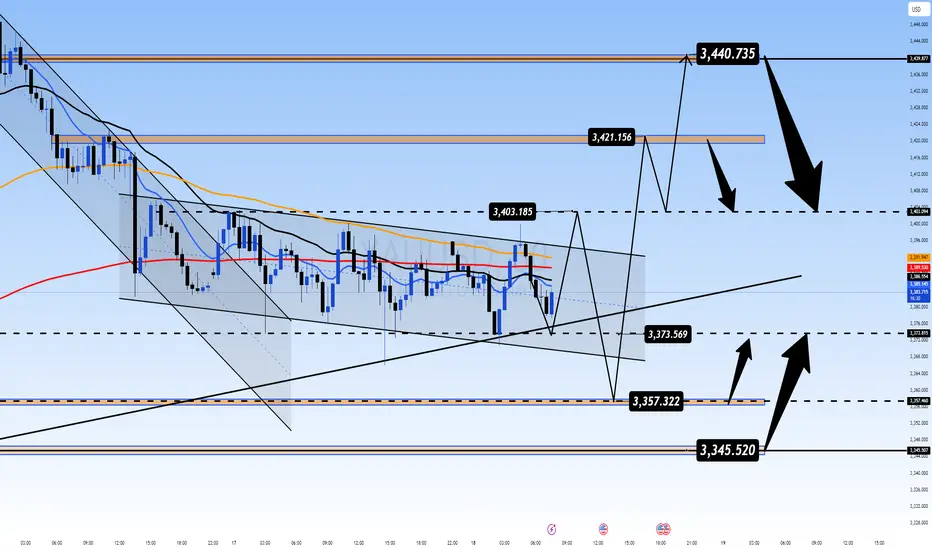
Gold Breaks the Range: Trend Reversal or Just a Fakeout?XAUUSD – Gold Breaks the Range: Trend Reversal or Just a Fakeout?
After several days of sideways action, gold has finally broken out of its consolidation channel — but not upward. The price action signals uncertainty, while underlying global risks suggest a larger move may be brewing. With US markets closed for a bank holiday, low liquidity could lead to sharp, unexpected spikes — traders, stay alert.
🌍 Macro & Fundamental Outlook
📌 As widely expected, the Federal Reserve held rates steady, but Fed Chair Powell maintained a hawkish tone, warning that inflation risks remain due to ongoing geopolitical instability and rising commodity costs.
🔥 The gold market now hinges on two major geopolitical scenarios in the Middle East:
If the US intervenes diplomatically to ease tensions between Iran and Israel, gold may continue to correct further — possibly into the 3,325 – 3,300 range or lower.
However, if reports are accurate that Trump is coordinating with Israel for potential strikes on Iran, gold could spike aggressively as safe-haven demand surges toward 3,417 – 3,440.
📊 Technical Breakdown (M30 – H1)
Price has broken below the range-bound structure, suggesting a potential momentum shift to the downside.
The EMA cluster (13–34–89–200) is sloping downward, confirming bearish short-term pressure.
The 3,345 level has acted as support, but if it gives way, 3,325 becomes a critical liquidity zone where buyers may step in.
✅ Trading Plan
🟢 BUY ZONE 1: 3,325 – 3,328
Entry: Only after a clear bullish reversal (pin bar / bullish engulfing candle)
SL: Below 3,320
TP: 3,345 → 3,360 → 3,373 → 3,384
🟢 BUY ZONE 2: 3,345 – 3,348
Entry: On price retest and bullish confirmation
SL: Below 3,340
TP: 3,360 → 3,373 → 3,384 → 3,403
🔴 SELL ZONE: 3,417 – 3,440
Entry: If price rallies into resistance with no supporting fundamentals
SL: Above 3,445
TP: 3,403 → 3,384 → 3,360 → 3,345
💬 Final Thoughts
Gold is at a pivotal point. While today’s break could indicate a new leg down, we’ve seen countless false breakouts during low liquidity sessions. Only trade on confirmation — not emotion. Watch for geopolitical headlines and let price action guide your risk-adjusted decisions.
Stay patient. Stay sharp. Let the market prove itself before you do.

GBP/USD - For FOMC & Fed Interest RateThe GBP/USD pair on the M30 timeframe presents a Potential Buying Opportunity due to a recent Formation of a Channel Pattern. This suggests a shift in momentum towards the upside and a higher likelihood of further advances in the coming hours.
Possible Long Trade:
Entry: Consider Entering A Long Position around Trendline Of The Pattern.
Target Levels:
1st Resistance – 1.3567
2nd Resistance – 1.3682
🎁 Please hit the like button and
🎁 Leave a comment to support for My Post !
Your likes and comments are incredibly motivating and will encourage me to share more analysis with you.
Best Regards, KABHI_TA_TRADING
Thank you.
Disclosure: I am part of Trade Nation's Influencer program and receive a monthly fee for using their TradingView charts in my analysis.

Smart Money Zones Revealed (XAUUSD) Is Gold Just Breathing or Breaking? Smart Money Zones Revealed (XAUUSD)
🔍 Macro & Sentiment Overview
Gold faced a sharp correction after a strong Asian session rally, which caught many traders off guard...
While the US Dollar gained 0.7% due to safe-haven flows and Fed anticipation, gold's dip seems more like a liquidity sweep than a structural reversal...
🌍 Rising geopolitical tensions — especially Iran–Israel and Trump’s comments about Tehran — keep the fear premium alive…
🛢️ Meanwhile, oil prices are surging, and institutional funds might be rotating capital between commodities and equities...
📝 All eyes are now on the Fed’s rate decision and the US retail sales report — a potential "horror print" that could shock rate expectations and trigger high volatility across markets.
📉 Technical Breakdown (M30 Perspective)
Price pulled back sharply after an overextended bullish move from Asian FOMO…
EMAs (13, 34, 89, 200) show early signs of potential crossover — signaling caution for buyers…
Liquidity gaps (FVG zones) below current price indicate a magnet for institutional fills…
🎯 Trade Setup
🔵 BUY ZONE: 3345 – 3343
Stop-Loss: 3339
Take Profits:
3350 → 3354 → 3358 → 3362 → 3366 → 3370 → 3380 → 3400 → ???
🧠 Look for confirmation through price action and rejection candles during London/NY sessions before entering.
🔴 SELL ZONE: 3442 – 3444
Stop-Loss: 3448
Take Profits:
3438 → 3434 → 3430 → 3425 → 3420 → 3410 → 3400
⚠️ Only short upon clean rejection and strong bearish confirmation patterns — avoid blind entries in this volatile phase.
🧠 Final Thoughts
Gold is moving within a smart money playbook — triggering stop hunts and liquidity grabs. With macro uncertainty ahead, patience and precision matter more than ever.
Let price come to your zones. Don’t chase. Let volatility serve you — not shake you.
📌 Follow this idea for live updates during the Fed press conference and NY session.
Fundamental Market Analysis for June 18, 2025 EURUSDEvent to pay attention to today:
12:00 EET. EUR - Consumer Price Index
15:30 EET. USD - Unemployment Claims
21:00 EET. USD - FOMC Rate Decision
Declining confidence in the US economy amid trade policy is undermining the US Dollar (USD) against the Euro (EUR). Data released by the US Census Bureau on Tuesday showed that US retail sales fell 0.9% m/m in May, compared to a 0.1% decline (revised from +0.1%) recorded in April. The figure was weaker than estimates of -0.7%. Meanwhile, US industrial production in May declined 0.2% m/m vs. 0.1% previously (revised from 0%), worse than expectations of 0.1%.
Traders expect the US Federal Reserve to leave borrowing costs unchanged at its June meeting on Wednesday. Markets now estimate a nearly 80% chance that the Fed will cut rates in September and then another in October, according to Reuters.
The mood of European Central Bank (ECB) policymakers is supportive of the common currency. ECB President Christine Lagarde said that rate cuts are coming to an end as the central bank is now in a “good position” to deal with the current uncertainty.
Meanwhile, investors will keep an eye on geopolitical risks. Israel is set to step up strikes on Tehran, while the US is considering expanding its role amid rising tensions between Israel and Iran.
Trade recommendation: SELL 1.1460, SL 1.1560, TP 1.1260
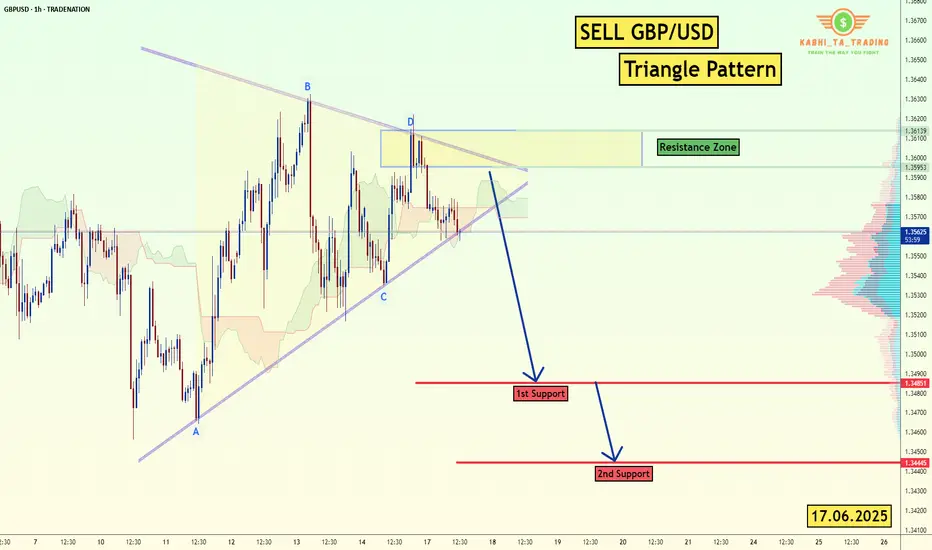
GBP/USD - H1-Triangle Breakout (17.06.2025)The GBP/USD Pair on the H1 timeframe presents a Potential Selling Opportunity due to a recent Formation of a Triangle Breakout Pattern. This suggests a shift in momentum towards the downside in the coming hours.
Possible Short Trade:
Entry: Consider Entering A Short Position around Trendline Of The Pattern.
Target Levels:
1st Support – 1.3485
2nd Support – 1.3444
🎁 Please hit the like button and
🎁 Leave a comment to support for My Post !
Your likes and comments are incredibly motivating and will encourage me to share more analysis with you.
Best Regards, KABHI_TA_TRADING
Thank you.
Disclosure: I am part of Trade Nation's Influencer program and receive a monthly fee for using their TradingView charts in my analysis.
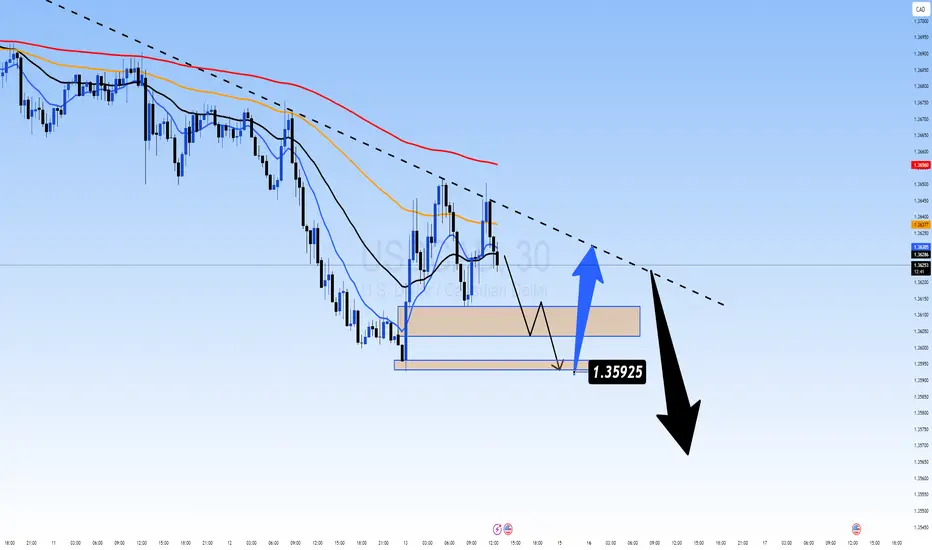
Oil Rises, Canadian Yields Surge: Can USD/CAD Rebound?USDCAD 17/06 – Oil Rises, Canadian Yields Surge: Can USD/CAD Rebound?
After a significant drop to the 1.355x area, USD/CAD is showing early signs of recovery. However, the pair remains influenced by strong macro headwinds—particularly oil prices and Canadian monetary policy signals.
🌐 Macro & Sentiment Overview
WTI crude oil is rising due to ongoing tensions between Israel and Iran, which increase the risk of global supply disruptions. This supports the Canadian Dollar (CAD) as a commodity-linked currency.
Canada’s 10-year bond yields have reached their highest levels in 5 months (~3.4%), reinforcing expectations that the BoC may remain hawkish in the near term.
USD weakens slightly as traders await more clarity from the Federal Reserve about the next rate cut timeline, potentially in Q3.
📊 Technical Analysis (M30 Chart)
Price is printing higher lows above the key trendline.
EMAs 13–34–89 are tightening → sign of sideways pressure before breakout.
Short-term bullish channel still intact.
Key resistance zones: 1.3581 and 1.3605.
🎯 Trade Setup Scenarios
📈 Long Scenario
Entry: 1.3556 – 1.3560 (trendline bounce)
Stop Loss: 1.3535
Take Profits: 1.3581 → 1.3605
✅ Wait for M30/H1 confirmation like bullish engulfing or price-action breakout.
📉 Short Scenario
Entry: 1.3605 (if price rejects resistance)
Stop Loss: 1.3630
Take Profits: 1.3581 → 1.3556
⚠️ Trigger only on bearish rejection with strong candle and volume at resistance.
📌 Strategic Outlook
USD/CAD is caught in a tug-of-war: stronger Canadian fundamentals (oil + yields) vs. cautious USD movement post-FOMC. If oil prices and Canadian yields continue to climb, CAD may remain in favor. However, short-term technical rebounds toward 1.3600 remain valid if price structure holds.

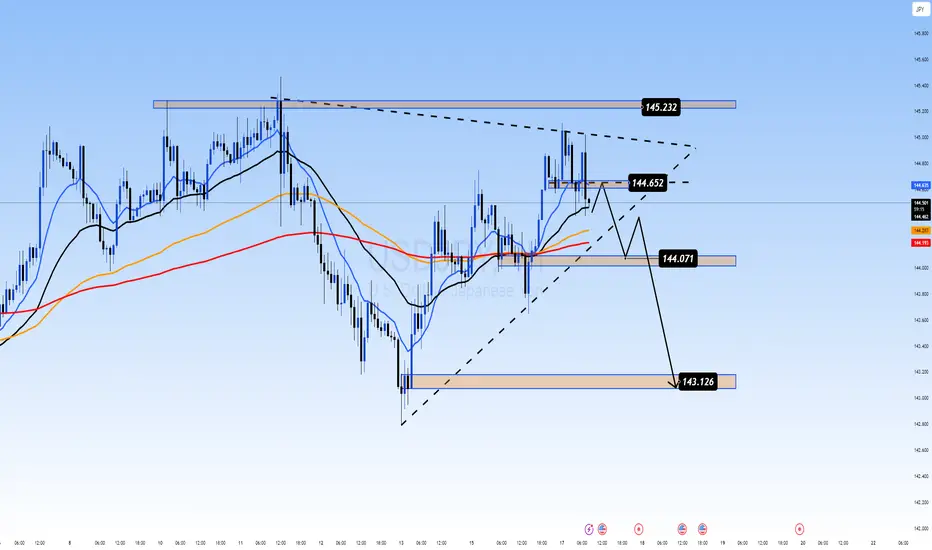
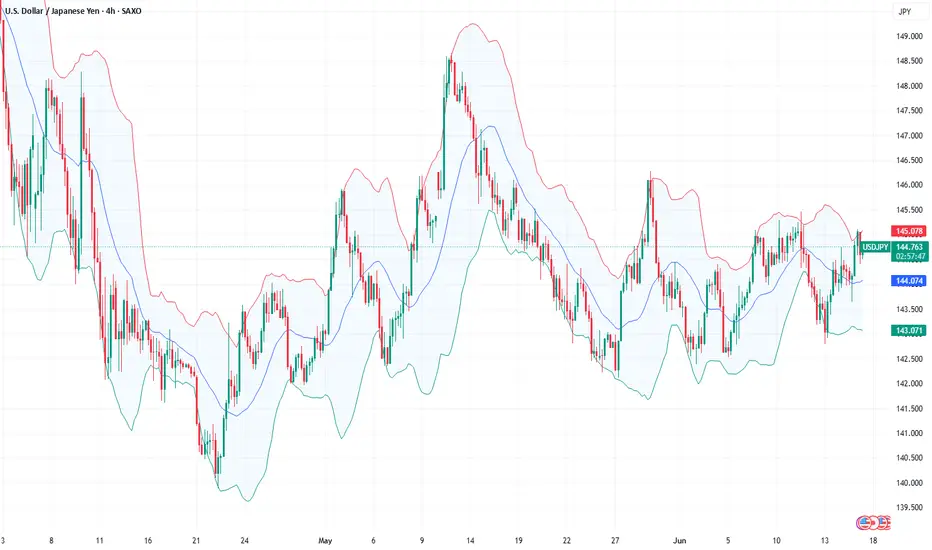
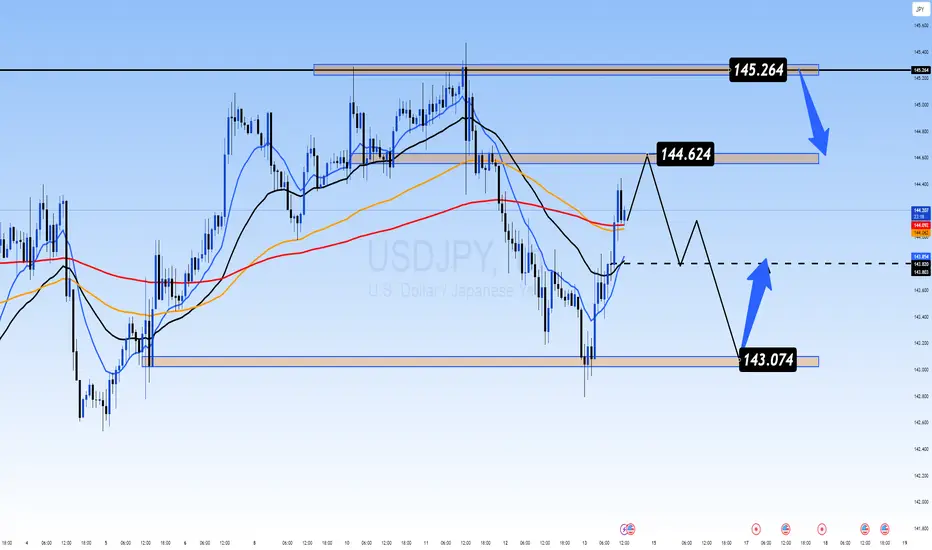
Squeeze in Progress: Will BOJ Trigger the Next Breakout?USDJPY 17/06 – Squeeze in Progress: Will BOJ Trigger the Next Breakout?
The USDJPY pair is currently consolidating just below the key 144.650 resistance, stuck within a tightening triangle structure. As markets await more clarity from both the Bank of Japan (BOJ) and the Fed, price action is showing signs of indecision — but pressure is building.
🌐 Macro & Sentiment Overview
BOJ maintains a neutral stance: Despite growing speculation of a hawkish shift, the BOJ held rates steady, providing no strong forward guidance. Markets remain cautious.
US Dollar remains resilient amid stable bond yields and expectations that the Fed may delay rate cuts, adding short-term support to USDJPY.
Geopolitical risk is on the rise: Ongoing Middle East tensions are fueling safe-haven demand for JPY, capping bullish momentum.
🔍 Technical Setup (M30 Chart)
Price is trapped inside a symmetrical triangle, tightening between 144.652 resistance and 143.126 support.
EMA 13/34/89 are aligned bullishly, but EMA 200 (red) is acting as a dynamic ceiling near 144.300.
Key support zones:
144.071: Minor structural level and trendline test.
143.126: Major liquidity zone and untested demand.
🎯 Trade Scenarios
📉 Scenario 1 – Sell on Rejection at 144.652
Entry: 144.650–144.700
Stop Loss: 145.250
Take Profit: 144.071 → 143.600 → 143.126
Ideal if BOJ shifts tone or USD weakens post-Fed comments.
📈 Scenario 2 – Buy on Bullish Reaction at 143.126
Entry: 143.100–143.150
Stop Loss: 142.700
Take Profit: 143.600 → 144.071 → 144.650 → 145.200
Valid only with clear bullish confirmation on M15–M30 structure.
🧠 Final Thoughts
USDJPY is coiling tightly ahead of a potential breakout. Macro uncertainty from central banks, geopolitical instability, and upcoming CPI data make this week highly volatile. Instead of chasing, let price come to your zones and react accordingly.
🔔 Focus on structure, confirm with price action, and avoid emotional trades. Patience and discipline are key in this compression phase.
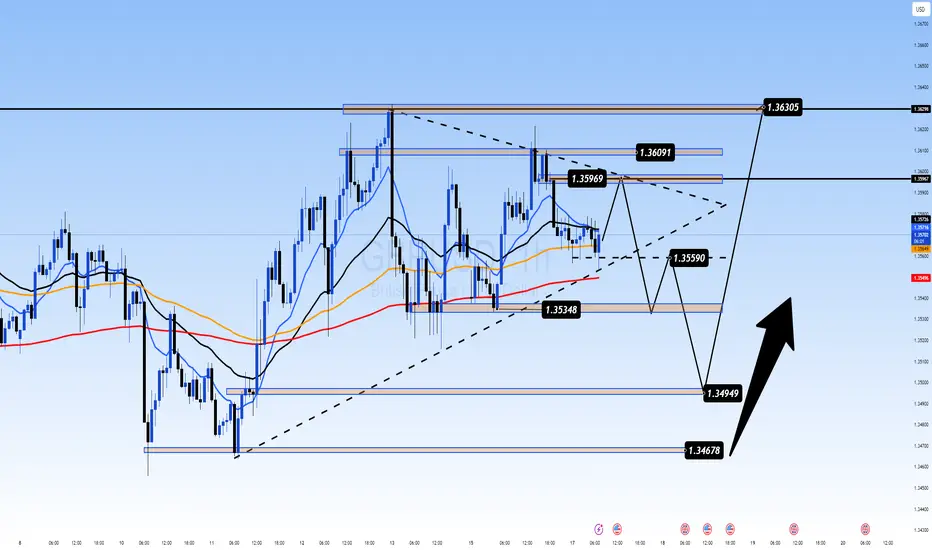
The Calm Before the Storm: All Eyes on UK CPI & Central BanksGBPUSD 17/06 – The Calm Before the Storm: All Eyes on UK CPI & Central Banks
The GBPUSD pair is coiling in a tight range near the mid-1.3500s as traders brace for two high-impact events: UK CPI data on Wednesday and interest rate decisions from both the Fed and BoE this week. Price remains supported above the 200 EMA and is compressing within a symmetrical triangle – typically a precursor to a major breakout.
📊 Macro & Fundamental Outlook
🔹 Federal Reserve (FOMC): Expected to hold rates steady, but growing anticipation of a dovish tilt toward September is weighing slightly on the USD.
🔹 Bank of England (BoE): Markets are pricing in deeper rate cuts following recent UK GDP weakness, pressuring the GBP in the short term.
🔹 Geopolitical Risks: Rising Middle East tensions are fuelling demand for USD as a safe haven, reinforcing its strength ahead of data events.
📝 Bottom Line: The CPI release could be the first trigger to shift GBPUSD’s current consolidation. A hot inflation print might push GBP higher; a miss could fuel further downside.
🔧 Technical Analysis (H1 Chart)
Price is ranging between 1.3535 (support) and 1.3609 (resistance)
EMAs 13/34 crossing below EMA 89 → signal of potential bearish continuation
Uptrend line from 1.3467 is still intact and acting as dynamic support
Break below 1.3559 may lead to a move toward 1.3495 and 1.3467
A confirmed breakout above 1.3609 opens the door to 1.3630+
🎯 Trade Scenarios
Scenario 1 – Buy from Trendline Support
Buy Zone: 1.3495 – 1.3467
Stop Loss: 1.3440
Targets: 1.3535 → 1.3559 → 1.3596 → 1.3630
🟢 Best setup if price prints a bullish engulfing or hammer candle on key support + UK CPI surprise.
Scenario 2 – Sell on Resistance Rejection
Sell Zone: 1.3609 – 1.3630
Stop Loss: 1.3660
Targets: 1.3590 → 1.3559 → 1.3535 → 1.3495
🔴 Only valid with strong rejection signals + softer UK data or hawkish Fed tone.
💡 Market Sentiment
Retail traders are trapped in a waiting zone – expecting a breakout
Institutions may push price into one direction pre-data to collect liquidity
Risk appetite is fragile, and traders are cautious ahead of back-to-back central bank announcements
📌 Final Thoughts
GBPUSD is preparing for volatility. Instead of chasing moves, let the market come to your key zones and react with discipline. The 1.3467–1.3495 support area could be crucial for the next directional move.
Stay patient. Wait for confirmation. Respect your risk.
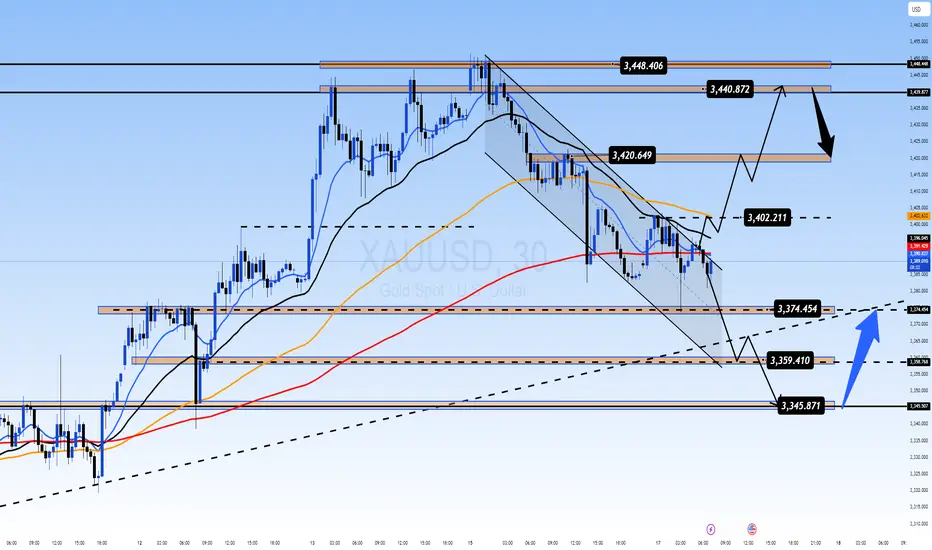
Gold’s Game of Traps: Is the Dip a Setup for a Bigger Move? Gold’s Game of Traps: Is the Dip a Setup for a Bigger Move?
After an aggressive rally fueled by geopolitical FOMO headlines, gold (XAUUSD) saw a sudden pullback — but what looked like weakness might actually be a setup for smart accumulation. The market narrative is shifting, and price action is sending important signals...
🌍 Global Drivers Behind the Volatility
Middle East conflict between Israel and Iran continues to escalate, prompting global safe haven flows. Evacuation warnings and nuclear deal pressure add more uncertainty to the mix.
Despite bullish news, gold failed to hold its highs — a potential bull trap as institutional players took advantage of retail FOMO to offload.
Big capital may now be rotating from gold into other sectors like energy (oil) and discounted equity assets.
📉 Price Action & Technical Outlook (M30–H1)
After topping around 3442–3440, price snapped back into the mid-range — a sign of liquidity hunting rather than a full reversal.
The EMAs (13/34/89/200) on the M15–M30 timeframes are showing early signs of bearish crossover, hinting at further short-term weakness.
Below current price sits a clean Fair Value Gap (FVG) that could act as a magnet — aligning with a high-probability buy zone.
🎯 Trading Playbook
✅ BUY Setup – "Smart Money Entry Zone"
Buy Zone: 3342 – 3344
Stop Loss: 3338
Take Profit Targets:
→ 3348 → 3352 → 3356 → 3360
→ 3364 → 3368 → 3372 → 3380+
💡 Look for price to tap into the FVG and form a base with bullish confirmation (engulfing candle, divergence, or rising volume) before entering.
❌ SELL Setup – "Fade the Overhead Resistance"
Sell Zone: 3440 – 3442
Stop Loss: 3446
Take Profit Targets:
→ 3436 → 3432 → 3428 → 3424
→ 3420 → 3415 → 3410
⚠️ Only short on a strong rejection or bearish engulfing candle near the resistance — do not short blindly.
🧠 Market Psychology Insight
The initial Asian-session rally was likely a news-driven liquidity event.
Institutions appear to be rotating capital, using emotional retail entries as exit liquidity.
Current market conditions suggest a shakeout before a longer-term bullish move.
📌 Final Note
Don’t chase price. Let it come to your zones. This market is being driven by geopolitical narrative and smart money behavior, not just technicals alone.
✅ Stay patient.
📊 Trade with logic.
🧘♂️ Let others FOMO — you focus on levels and confirmation.
👉 Follow for real-time London session updates and reaction-based entries.
Fundamental Market Analysis for June 17, 2025 USDJPYThe Japanese yen (JPY) continues to experience significant pressure against the US dollar (USD), showing a three-day decline and trading above the key psychological level of 145.000. This weakening is largely due to growing market expectations that the Bank of Japan (BoJ) may delay raising rates until the first quarter of next year. The main reason for this delay is said to be the continuing uncertainty surrounding future US tariff policy, which could have a significant impact on global trade flows and Japan's economic growth. Moderate but steady growth in the US dollar is also contributing to the strengthening of the USD/JPY position, pushing the pair to new highs during the Asian trading session.
However, market participants are cautious about aggressive bearish bets against the yen ahead of the upcoming Bank of Japan monetary policy meeting. This meeting is seen as a critical event that could provide additional signals about the central bank's long-term policy outlook. Any hints of a change in tone or new assessments of the economic situation will be carefully analyzed by traders.
In addition to central bank decisions, growing geopolitical tensions in the Middle East may help limit deeper losses for the Japanese yen. As a traditional “safe haven,” the yen typically attracts investors during periods of global instability, which may offset some of the negative impact of interest rate differentials. In addition, the outlook for the USD/JPY pair is influenced by the growing recognition that the US Federal Reserve (Fed) may lower borrowing costs in 2025. Expectations of future Fed rate cuts could hinder further strengthening of the US dollar and thus limit the upside potential of the USD/JPY pair. Overall, the market remains in anticipation of key decisions that will determine the future trajectory of one of the world's most actively traded currency pairs.
Trading recommendation: SELL 144.550, SL 145.000, TP 143.600
GOLD- XAU-USD Hello Traders! The GOLD MARKET is on fire! 🚨🔥
XAUUSD has officially broken above the key resistance zone — this is not just a move, this could be the start of something BIG! 💥📈
Is this the golden breakout we’ve been waiting for, or just a short-lived spike?
Are we heading toward the next major target, or is a pullback on the horizon? 🎯🔍
Your insights matter — comment below with your analysis and let’s decode this golden move together!
Stay sharp, stay golden! ⚔️💰
#XAUUSD #GoldBreakout #ForexTraders #MarketMomentum #GoldAnalysis #TradeSmart
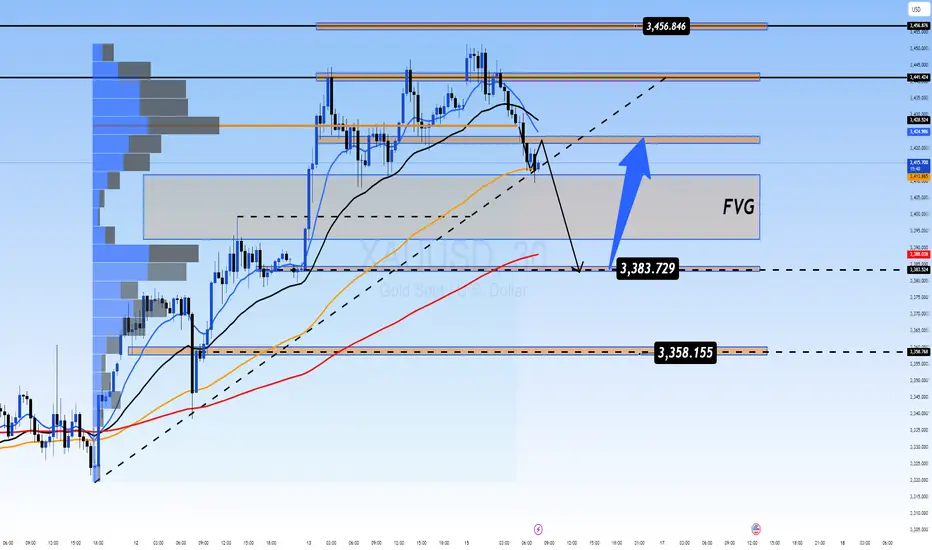
XAUUSD 16 June – Liquidity Trap or Smart Money Rotation? XAUUSD 16 June – Liquidity Trap or Smart Money Rotation?
Gold surprised many traders with a sharp spike during the Asian session, only to reverse aggressively hours later. While headlines screamed “war” and panic, the price behavior told a different story—one of strategic distribution and smart money rotation...
🌍 Macro & Fundamental Context
Geopolitical triggers: Rising tensions in the Middle East (Israel-Iran) and political assassinations triggered emotional buying across safe-haven assets like gold and oil.
Institutional rotation: Major funds appear to be offloading gold positions to rebalance into equities (in correction) and oil (strong upside potential).
Market narrative: News-induced FOMO drives retail into overbought zones, allowing larger players to exit at premium prices.
📈 Technical Overview (M30 Structure)
Price Action: Gold tapped into major resistance at 3456–3458, showing an aggressive rejection shortly after.
EMA Behavior: EMAs (13/34/89/200) are flattening across M15 and M30—early signs of a possible bearish crossover.
Volume Drop: Declining volume after the spike suggests buyer exhaustion, reinforcing the idea of a bull trap.
Fair Value Gap (FVG): A visible liquidity void remains below the 3390 area. Price often returns to fill these zones.
🎯 Trading Plan for Today
✅ Scenario A: Buy from Demand Zone (Liquidity Fill)
Entry: 3383 – 3385
Stop Loss: 3377
Targets: 3386 → 3390 → 3394 → 3398 → 3402 → 3406 → 3410+
📌 Best executed during London or NY session if price shows absorption or reversal confirmation.
❌ Scenario B: Sell from Resistance Only on Clear Rejection
Entry: 3456 – 3458
Stop Loss: 3462
Targets: 3452 → 3448 → 3444 → 3440 → 3435 → 3430
⚠️ Only enter shorts if clear bearish engulfing or pin-bar setup forms near resistance zone.
🧠 Market Psychology
Retail FOMO is being exploited by larger players to exit risk positions.
Liquidity engineering is likely in play—smart money drives price up on headlines, then exits into buyer momentum.
Equity & Oil rotation signals a shift in institutional preference short-term.
📌 Final Thoughts
This isn’t a time to chase breakouts. Gold is entering a volatile re-accumulation phase where news is being weaponized to induce emotional trading. The real edge lies in waiting for price to come to your level and only executing with confirmation.
🎯 Zone to Watch: 3383 – 3385
📉 Avoid chasing moves
📊 Respect your SL & manage risk like a pro
—
🧭 Stay patient. The next big move will reward those with discipline and timing.
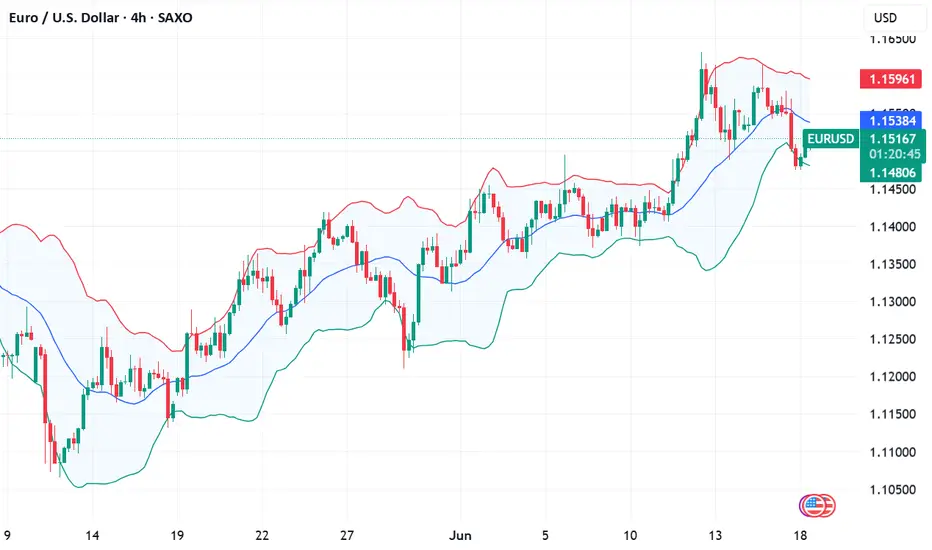
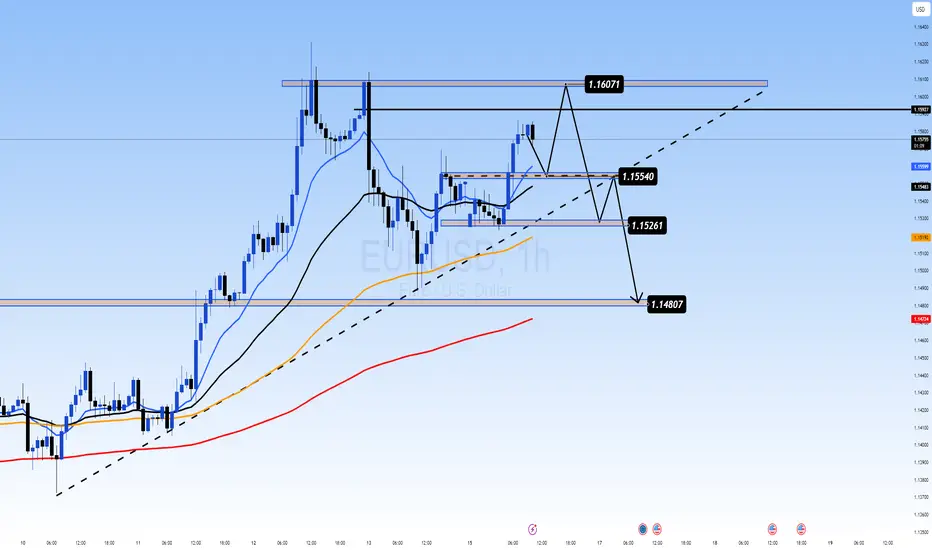
EURUSD 16 June – Technical Rebound or Liquidity Trap? EURUSD 16 June – Technical Rebound or Liquidity Trap?
The EURUSD pair has shown sharp movements after testing key resistance near 1.1607. While the price action may appear bullish at first glance, deeper analysis suggests we might be facing either a continuation of the uptrend or a strategic liquidity hunt.
🌍 Macro & Fundamental Overview
The ECB remains hawkish with rates still high, but recent commentary hints at a more dovish tone possibly leading to rate cuts in late Q3 2025.
Meanwhile, the Federal Reserve maintains its cautious stance, holding off on rate cuts due to sticky core inflation.
This divergence in policy expectations creates a neutral to slightly USD-favorable bias, depending on upcoming economic data.
⏳ Bottom line: EURUSD remains in a choppy environment with compression–expansion cycles, and no confirmed macro-driven trend yet.
📉 Technical Outlook (H1 Chart)
Price Structure: The pair is moving within a short-term ascending channel, but current price is testing the upper boundary.
EMA Analysis (13/34/89/200): Still supports an uptrend, but flattening out — potential bearish crossover if price fails to hold.
Key Resistance:
1.1607: Major resistance and local top (double rejection zone).
Critical Support Zones:
1.15540: Minor structural support — a decisive level for intraday direction.
1.15261 & 1.14807: Unfilled FVG zones and liquidity pools that may get targeted if the price breaks lower.
🎯 Trade Setup Ideas
📘 Scenario A – BUY from 1.15540 support (bullish continuation)
Entry: 1.15540 (upon bullish candle confirmation or strong bounce)
Stop Loss: 1.15200
Take Profits: 1.15850 → 1.16070 → 1.16300+
✅ Ideal if European sentiment remains positive or if USD weakens across the board.
📕 Scenario B – SELL if price breaks and retests 1.15540
Entry: 1.15540 (after a breakdown + rejection retest)
Stop Loss: 1.15720
Take Profits: 1.15261 → 1.14807 → possibly 1.1450
✅ Best used if USD gains strength or EUR shows weakness after economic releases.
🧠 Market Psychology
The market is currently reactive to any shift in tone from ECB and Fed, causing price whipsaws near key zones.
Smart traders will avoid chasing breakouts and instead focus on reaction zones like 1.15540 for confirmation-based trades.
Watch for fakeouts, as institutional players may be hunting liquidity before choosing direction.
📌 Final Thoughts
EURUSD is in a sensitive zone, and 1.15540 is the intraday pivot. Holding above could trigger a push toward 1.1607 and higher. But failure to hold would likely attract sellers toward the 1.1480–1.1450 liquidity range.
🎯 Discipline is key. Avoid emotional entries. Let the market come to your level — and execute only with confirmation.
EUR/CAD Long Bias🚀 EUR/CAD – Strong Long Opportunity Based on Multi-Factor Confluence
Over the past week, I conducted a comprehensive macro and sentiment-driven analysis across G10 FX pairs. Among several potential setups, EUR/CAD emerged as the most fundamentally and technically aligned long opportunity, supported by a confluence of high-probability signals across positioning, macro divergence, and capital flow sentiment.
🔍 Key Drivers Behind the EUR/CAD Long Bias:
1️⃣ Macroeconomic Divergence (ENDO View)
🇪🇺 Eurozone has shown relative stability in core macro indicators:
Inflation continues to cool, providing flexibility for ECB rate guidance.
GDP growth remains structurally flat but not contracting — suggesting resilience.
🇨🇦 Canada, on the other hand:
Shows a deteriorating inflation-growth mix.
Retail Sales and Industrial Production trends are softening.
ENDO analysis flags CAD as one of the weakest among G10 currencies.
2️⃣ Positioning – COT Report & Z-Scores
Speculative traders are increasing their long exposure to EUR (COT net longs rising +13,887 last week).
Z-Score on EUR long positions: +1.33 → statistically elevated interest in long EUR exposure.
CAD positioning is flat-to-negative, with no bullish buildup in speculative flows.
This gives EUR a clear relative edge in terms of speculative conviction.
3️⃣ Score & EXO Sentiment Framework
EUR/CAD is one of few pairs showing clear directional consensus across:
✅ EXO Score Sheet: Long Bias confirmed.
✅ RR_w Sheet: Strong risk/reward rating supports further upside.
✅ IR Forecast Sheet: ECB-CAD policy spread favors EUR strength in medium term.
4️⃣ Market Sentiment – Risk Regime
We are currently in a “Risk-On” sentiment regime, which generally favors currencies like EUR over defensive, commodity-linked currencies like CAD.
CAD tends to underperform in reflationary sentiment waves — especially when Oil fails to support the currency.
5️⃣ Cluster & Trend Confirmation
While not a primary factor, cluster analysis shows that EUR/CAD is not in a weak trend regime.
Trend alignment over 30 and 14 days remains favorable.
🔚 Conclusion:
EUR/CAD is one of the few pairs this week that aligns across all analytical fronts: macro, positioning, sentiment, and structure. In a crowded FX environment, such confluence is rare and valuable.

Bearish Bias Holds as Oil Rises & Rate Differentials NarrowUSDCAD – Bearish Bias Holds as Oil Rises & Rate Differentials Narrow
🌍 Macro & Fundamental Outlook
The Canadian Dollar (CAD) continues to gain ground this week, supported by two key drivers:
Crude oil prices surged due to Middle East tensions and renewed demand optimism — boosting CAD as a commodity-linked currency.
US-Canada yield spreads narrowed, following revised expectations that the Bank of Canada (BoC) may keep rates higher for longer, while the Fed is seen pausing.
Short-term event risks to watch:
🇨🇦 Canadian Manufacturing Sales data today at 13:30 GMT
🇨🇦 G7 Summit in Alberta from June 15–17, which may influence oil and energy policy sentiment
Our latest fair value estimate for USDCAD has shifted lower to 1.3613, reflecting tighter rate spreads and stronger oil. Technical structure remains tilted to the downside.
📉 Technical Outlook – M30 Chart
🔹 Structure:
Price remains in a short-term downtrend, with a well-defined descending trendline capping upside attempts.
The pair recently tested the EMA 89–200 zone and failed, suggesting continued bearish pressure.
🔹 Key Zones:
Dynamic Resistance: 1.3638 – 1.3660 (trendline + EMA cluster)
Support Area: 1.3592 → 1.3578
A break below 1.3578 could expose deeper downside toward 1.3420 (September lows)
🔹 Momentum Indicators:
RSI has bounced from oversold (30) but remains in bearish territory.
The current rebound looks corrective — potentially a dead cat bounce.
🧠 Market Sentiment
Flows favour commodity-backed currencies like CAD, especially with energy prices rising.
USD has weakened slightly as the Fed is expected to hold rates steady next week.
Sentiment is leaning toward "sell the rallies" on USDCAD for now.
🎯 Trade Setup Scenarios
🔻 SELL SCENARIO – If price retests and rejects 1.3638 – 1.3660
Entry: 1.3640 – 1.3655
Stop-Loss: 1.3685
Targets: 1.3592 → 1.3578 → 1.3510
🔺 BUY SCENARIO – If strong bullish reaction occurs at 1.3592 – 1.3578
Entry: 1.3580
Stop-Loss: 1.3545
Targets: 1.3620 → 1.3640
⚠️ Focus on trend continuation. Only consider buys if clear rejection or bullish confirmation appears at support.
✅ Conclusion
The current trend in USDCAD favours sellers, with fundamental momentum supporting CAD via higher oil and narrowing yield differentials. Key resistance at 1.3638–1.3660 remains the pivot zone to monitor. With Canadian data and the G7 Summit ahead, volatility could increase.
Dollar Momentum Fades | Can 143.07 Hold as Support?USDJPY – Dollar Momentum Fades | Can 143.07 Hold as Support?
🌍 Fundamental & Macro Outlook
USDJPY has faced strong downside pressure recently as risk-off sentiment boosts demand for the Japanese Yen, following escalating tensions between Israel and Iran.
The US Dollar Index (DXY) rallied on geopolitical concerns but is struggling to sustain momentum near the 98.30 resistance zone.
Despite the Bank of Japan's ultra-loose monetary policy, JPY is acting as a safe haven in current global risk conditions.
Traders are awaiting next week’s monetary policy decisions from both the Federal Reserve and the Bank of Japan. Both central banks are expected to keep rates unchanged, but forward guidance could spark major volatility.
According to UOB Group, the dollar's recovery potential is weakening, and further downside toward 142.20 is possible, unless price reclaims the 144.60–144.95 resistance zone.
📉 Technical Analysis – H1 Chart
🔸 Trend Structure
USDJPY remains in a mild downtrend, but price has bounced from the 143.074 key support zone.
A recovery towards 144.624 is in play, but that zone must be cleared for bullish continuation.
🔸 EMA Outlook
Price is currently testing the EMA 89 and 200 — a rejection from this area could trigger another move down.
EMA 13 & 34 are now acting as short-term dynamic support.
🔸 Key Price Zones
Resistance: 144.60 – 145.26
Support: 143.07 – 142.20
🧠 Market Sentiment
Risk aversion continues to dominate as geopolitical headlines drive sentiment.
The Yen is benefitting from capital protection flows despite Japan’s dovish stance.
Large funds may be starting to hedge by rotating into JPY from elevated USD levels.
🎯 Trading Scenarios for June 13
📌 Scenario 1 – Short Setup (Rejection at Resistance)
Entry: 144.60 – 144.90
Stop-Loss: 145.30
Take-Profit: 143.60 → 143.07 → 142.50
📌 Scenario 2 – Long Setup (Rebound from Support)
Entry: 143.10 – 143.20
Stop-Loss: 142.70
Take-Profit: 144.00 → 144.60
✅ Wait for confirmation at key levels — avoid trading in the middle of the range when volatility is headline-driven.
✅ Conclusion
USDJPY remains trapped between strong resistance at 145.26 and buying interest at 143.07. If risk sentiment persists, the Yen may continue to strengthen. However, central bank decisions next week (Fed & BoJ) will be the major catalysts for any medium-term breakout.
GBPUSD – Sterling Slips Amid Geopolitical Risk |GBPUSD – Sterling Slips Amid Geopolitical Risk | Will Support Hold for a Bounce?
🌍 Macro & Geopolitical Overview
The British Pound (GBP) is under pressure as risk sentiment deteriorates following a sharp escalation between Israel and Iran.
Israel launched a major military campaign, striking dozens of nuclear and military facilities in northeastern Tehran.
PM Netanyahu announced the start of "Operation Rising Lion", aimed at eliminating the Iranian nuclear threat.
US President Donald Trump voiced support, stating that Iran “must never have a nuclear bomb.”
Investors reacted by fleeing to safe-haven assets, pushing the US Dollar (DXY) from 97.60 to nearly 98.30.
Meanwhile, next week’s Bank of England (BoE) and Federal Reserve meetings are in focus. Both are expected to hold rates steady, but weak UK economic data may pressure the BoE to adopt a more cautious or dovish tone.
📉 Technical Analysis – H1 Chart
🔸 Trend Structure
GBPUSD broke down from its recent high at 1.36288 and is now approaching key support between 1.35350 and 1.34957.
As long as 1.3495 holds, the move appears to be a technical correction, not a reversal.
🔸 Fibonacci & Moving Averages
Current price sits near Fibonacci 0.236 retracement of the recent swing.
Price is trading below the EMA 13 & 34, but EMA 200 near 1.353x still acts as potential support.
🔸 Resistance to Watch
The next upside target sits at 1.3588, followed by the previous high at 1.3628.
🧠 Market Sentiment
Risk aversion is dominating due to geopolitical headlines.
GBP is vulnerable as a risk-sensitive currency.
However, if tensions ease and central bank decisions next week come in line with expectations, GBP could rebound from its currently discounted levels.
🎯 Trade Setup Suggestion
✅ BUY ZONE: 1.35350 – 1.34957
Stop-Loss: 1.3460
Take-Profit Targets: 1.3588 → 1.3628
Enter only on bullish price action confirmation around the support zone.
✅ Conclusion
GBPUSD is trading under geopolitical stress, but the technical setup around 1.3495 – 1.3535 offers a potential bounce zone. A short-term recovery could unfold if sentiment stabilizes and central banks maintain the expected policy stance.
