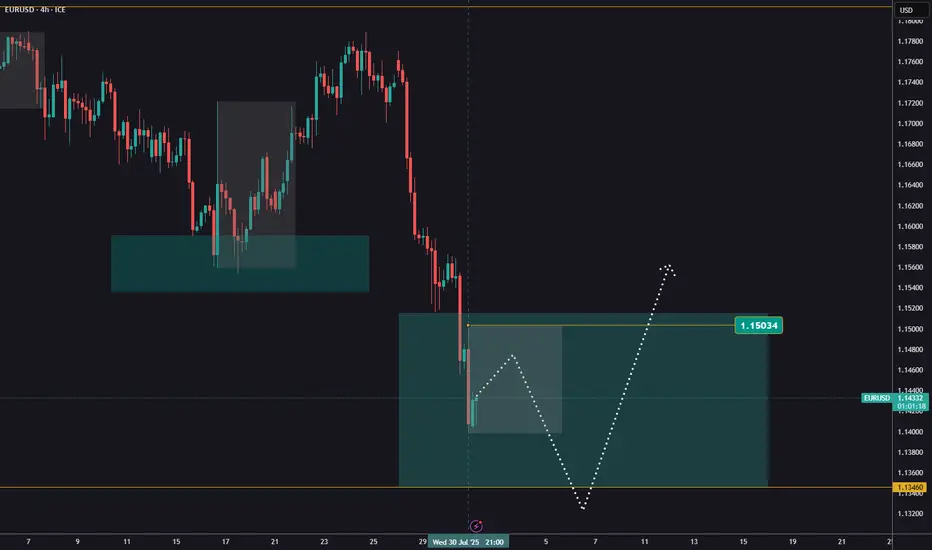
EURUSD after the FedEURUSD continues to trade within the reversal zone highlighted in our previous analyses.
Following yesterday’s Fed decision, we’re seeing additional downside movement, though price hasn’t yet reached the support level at 1,1346.
Our outlook remains unchanged – we’re watching for the end of the pullback and will look for buying opportunities afterwards.
The H1 candle formed during the news release can serve as a reference. A break and close above it would signal a potential reversal to the upside.
Conversely, if price breaks and closes below that candle, it would suggest the correction is likely to continue toward lower levels.
Fundamental Analysis
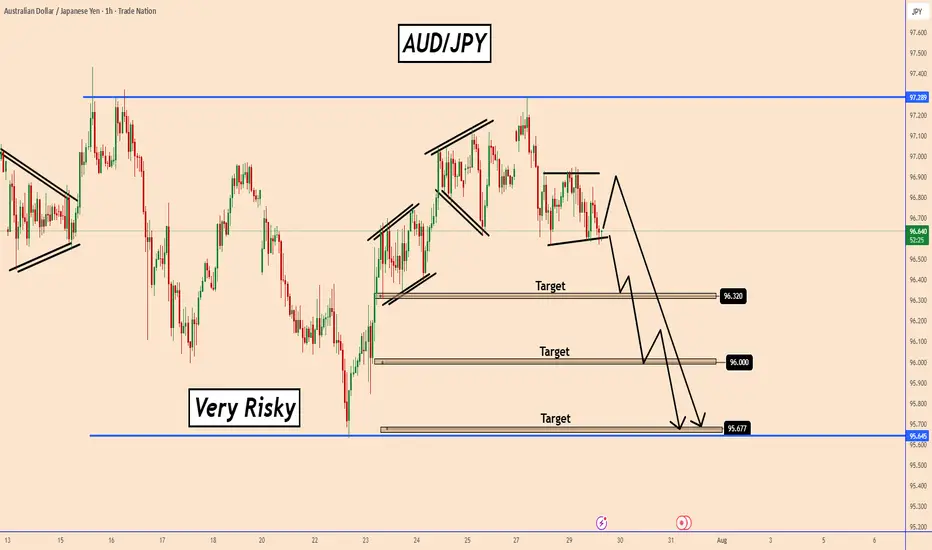
AUDJPY Poised to Start a Distribution Phase to 98.70AUDJPY Poised to Start a Distribution Phase to 98.70
On the 60-minute chart, AUDJPY has completed the accumulation phase, and it appears that AUDJPY is preparing for a breakout phase.
This is happening on the 60-minute chart.
The price that has already formed a pattern has a lower form and chances are that it may fall further from this area.
If this happens, AUDJPY may start another impulsive downward move.
In the overall picture, AUDJPY faced a strong resistance near 97.30 and is indicating a downward move to 95.70.
You may find more details in the chart!
Thank you and Good Luck!
PS: Please support with a like or comment if you find this analysis useful for your trading day
Disclosure: I am part of Trade Nation's Influencer program and receive a monthly fee for using their TradingView charts in my analysis.
GME 1W: when the memes fade, the structure speaksGameStop is once again testing the lower boundary of its long-term consolidation, bouncing off the 21.53 zone - a level that aligns with the 0.79 Fib retracement and historical support. This zone also intersects with a key trendline on the weekly chart, and just recently, a golden cross (MA50 crossing MA200 weekly) printed - a rare but technically significant signal. The stock continues to trade inside a broad descending channel, and if this support holds, the natural next step is a move back toward the mid-range at 37.42 (0.5 Fib), followed by a possible push toward 64.92. The tactical setup favors a confirmation entry near current levels, with a stop under 21.00. Risk/reward here is among the cleanest GME has offered in months.
On the fundamental side, GameStop remains in a transitional phase. The company is shutting down unprofitable segments, reducing costs, and doubling down on e-commerce and digital distribution. Financial results are still slow to recover, but the latest Q2 2025 report showed positive operating cash flow and narrowing losses. This isn't a value play in the traditional sense - it's more about the potential for renewed retail-driven momentum if technical conditions align.
If there’s still power behind the crowd - this might be one of the most technically compelling entry zones of 2025.

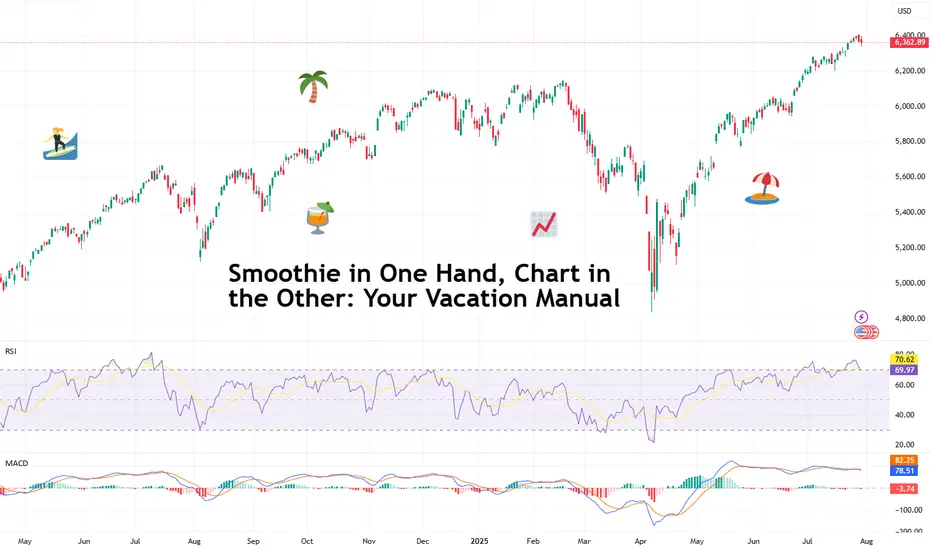
Smoothie in One Hand, Chart in the Other: Your Vacation ManualSome traders bring a beach read. Others bring their TradingView charts.
It’s the heat of the summer and we figured, why not take it easy with a breeze of lightweight lines to pair with your mezcal espresso martini? Let’s talk about how to relax while still watching the markets.
🏄♂️ Market Never Sleeps… But You Should
Vacations are supposed to be about unplugging, but for traders, that’s just code for “I’ll switch to the app instead.”
And we don’t blame you. With all that’s going on — US-EU tariff deal, stocks at record highs, and Ethereum BITSTAMP:ETHUSD outperforming Bitcoin BITSTAMP:BTCUSD in a monster July run — it’s only natural for market participants to be hooked at this time.
But watch for those signs of getting overly attached. Studies show performance suffers when you're overcooked — like your last scalp trade on Powell Day. So yes, that mojito matters. Just don’t place a leveraged position on a pool float.
📅 Timing the Market… and Your Booking
Let’s talk timing. The pros know not to schedule getaways during Nonfarm Payrolls week or FOMC decision day. (Unless your idea of relaxing is explaining yield curves to your kids on a ferry across lake Como.)
Instead, try planning your time off during historically low-volatility periods. Summer often sees volume dry up like your skin without sunscreen. Think August’s fairly dry weeks — when even the algorithms seem to be on holiday. As always, consult with the Economic Calendar to know when these are.
Bonus tip: if you’re flying and you wanna stay wired in, go for premarket or after-hours shifts. Nothing says “seasoned trader” like placing an order while the flight attendant gathers everyone’s attention for the safety demo.
🧴 SPF 50 and the S&P 500: Know Your Risk Exposure
In these scorchers outside, you wouldn’t step out without sunscreen, right? But would you let your positions roast unsupervised?
Use stop losses like you use sunblock: generously and repeatedly. Even better — scale back. Summer’s thin liquidity (and other summer trading traps ) can turn minor market moves into full-on tidal waves. No one wants to explain to their friends why they lost 40% of their portfolio during a snorkeling trip.
Adequate position sizing is your beach umbrella. It doesn’t stop the storm, but it’ll stop the burn.
🧭 Wi-Fi, but Make It Secure
Public Wi-Fi is great for scrolling memes, not executing trades. One accidental login from a beachside café in Mykonos and boom — your brokerage account may become a group project.
Trading from your vacation spot shouldn’t be a flex (no matter how much you want to look cool to the bunch of people around you). Focus on your game, trade in silence, and bask in sunlight and success.
☀️ Pack Light, Trade Lighter
The golden rule? If you’re not at your desk, don’t trade like you are.
Scale back positions, minimize leverage, and don’t try to outperform the market while someone’s kid is throwing a beach ball at your head. This is a maintenance phase, not a moonshot month.
Think: protect capital, avoid drawdowns, maybe sneak in a swing trade between sunscreen applications.
📲 Must-Have Apps for Sand-and-Screen Trading
You’re not bringing a full setup, but your phone can still do the heavy lifting. Load it with TradingView (obviously), your broker, ideally paired with TradingView, and a solid news feed . Bonus points for noise-canceling headphones that can drown out both market panic and crying toddlers.
Set up push notifications smartly — only the alerts you actually need. You don’t want your wrist buzzing every time Nvidia NASDAQ:NVDA moves 0.1%.
Question for the road : What’s your best summer trade… and was it worth checking your phone at dinner to place it?
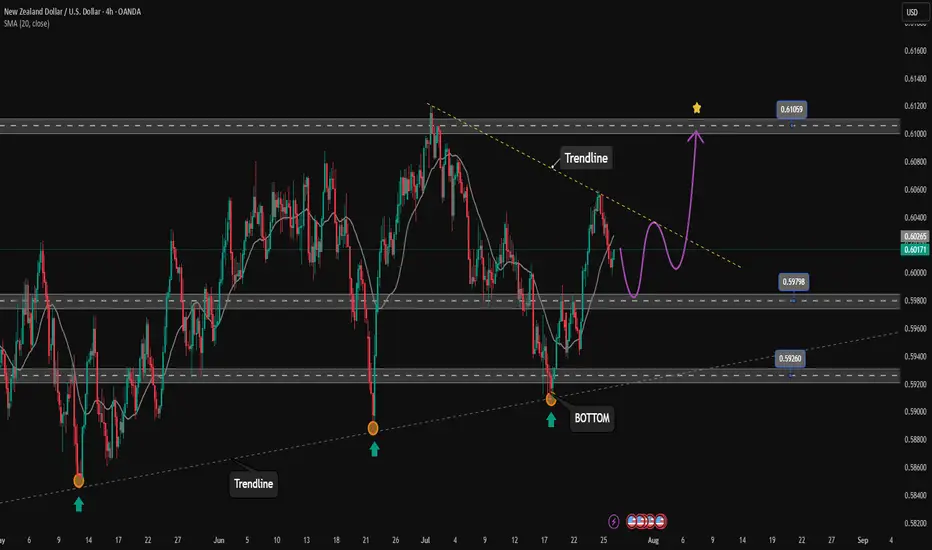
Price is heading towards the upper boundary of the price channel✏️ OANDA:NZDUSD is trading in a bullish wave on H4 chart towards the upper boundary of the ascending price channel. The trendline reaction to the support zone of 0.598 will form a nice corrective wave for the uptrend. If the nearest trendline is broken, the price will soon reach our take profit zone.
📉 Key Levels
Buy trigger: Reject and Trading above 0.598
BUY zone 0.592 ( vùng hỗ trợ biên dưới)
Target: 0.610
Leave your comments on the idea. I am happy to read your views.
Is the gold correction over?✏️Yesterday's D1 candle closed above the Breakout 3363 zone. This shows that the buyers in the US session are still strong. There is a possibility of a liquidity sweep in the Tokyo and London sessions, then in the New York session, Gold will recover and increase again. The uptrend is really broken when Gold confirms a close below 3345. In this case, we have to wait for 3320 to confirm the BUY point. The gold uptrend at this time also needs new momentum to be able to move towards ATH 3500.
📉 Key Levels
Support: 3345-3320
Resistance: 3373-3418
Buy zone: 3345 (bullish wave structure maintained); BUY DCA break 3373
Buy zone: 3320 (Strong support zone)
Target: 3417
Leave your comments on the idea. I am happy to read your views.

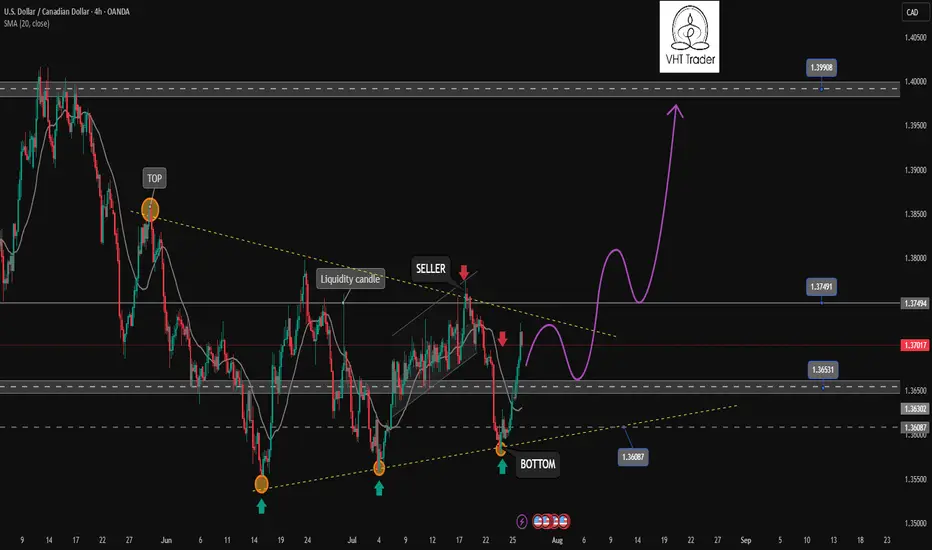
Uptrend is coming. Opportunity for buyers✏️ OANDA:USDCAD is trading close to the upper boundary of the triangle pattern. There is a high possibility that the current bullish momentum will break the upper boundary and form an uptrend for the USDCAD pair. The important price zone for the sellers at the moment is 1.075. If the buyers are strong enough to push the price above 1.075, the sellers will only be really interested in the price zone of 1.340, the high of the pair in May.
📉 Key Levels
Buy trigger: Reject and Trading above 1.365
BUY DCA Break 1.375
Target: 1.400
Leave your comments on the idea. I am happy to read your views.
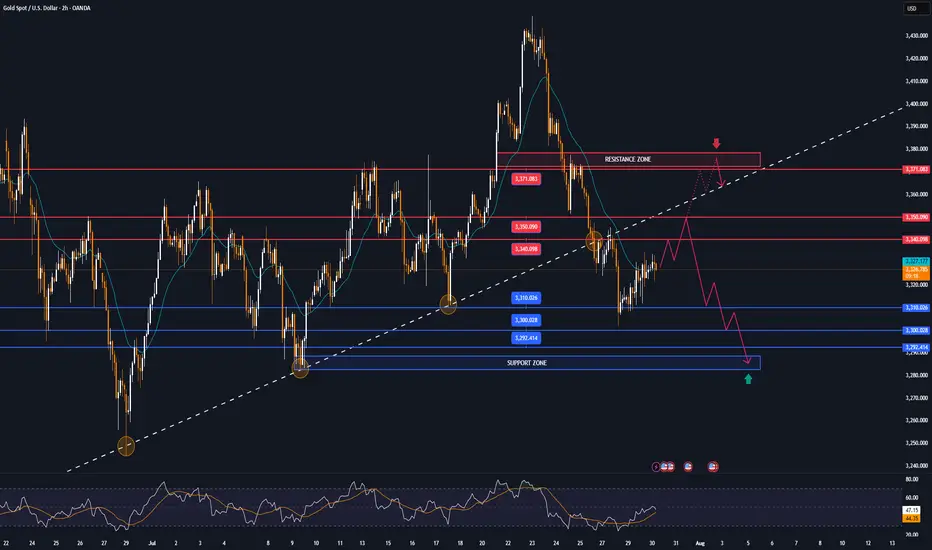
Gold breaks price channel, officially starts falling✏️ OANDA:XAUUSD price has officially broken the bullish wave structure and broken the bullish channel. A corrective downtrend has begun to form. If there is a pull back to the trendline today, it is considered a good opportunity for sell signals.
The liquidity zone 3250 is the target of this corrective downtrend. The 3283 zone also has to wait for confirmation because when the market falls and the momentum of the decline, the number of FOMO sellers will be very strong. The opposite direction is when closing back above 3375, Gold will return to the uptrend.
📉 Key Levels
SELL zone 3343-3345
Target: 3250
BUY trigger: Rejection candle 3285
Buy zone: 3251
Leave your comments on the idea. I am happy to read your views.

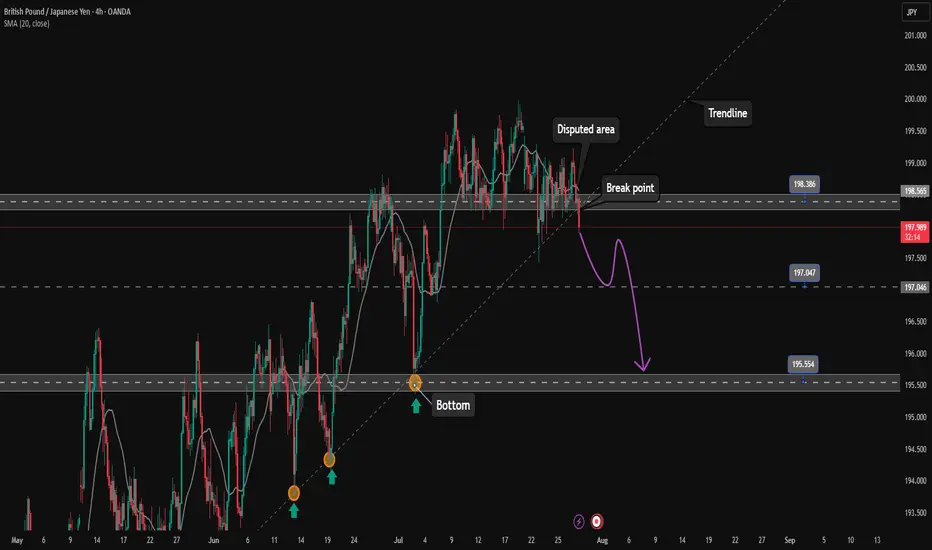
GBPJPY starts corrective downtrend. Ready to SELL✏️ OANDA:GBPJPY has broken the trendline structure and broken the disputed zone. Price is heading towards the support zone ahead around 197.000. This is considered a breakout zone for DCA rather than BUYing at this zone. The downtrend of GBPJPY may extend to the bottom of last week.
📉 Key Levels
SELL now GBPJPY 198.000
SELL trigger: Break support zone 197.000
Target 195.500
Leave your comments on the idea. I am happy to read your views.
7/29/25 - $nxt - Still long and strong7/29/25 :: VROCKSTAR :: NASDAQ:NXT
Still long and strong
- have written a lot about this name since last yr, so won't bore you with more details
- but still MSD++ FCF yields
- mkt still wants to ignore solar
- any credit-related phase-out is acutally likely to pull fwd demand/ beats (that backlog)
- mkt already seems to be pretty conservative on next year, as is
- and w/ software and electrical systems (cross sell) in the mix... i'd guess all else equal, we still report a great quarter
- what's interesting to note is names that have rallied into their prints (electrical/ infra types) have beat... think NYSE:GEV , $cls... stuff like this. I get it, diff zip code... but still, these are well-bid "havens" b/c the mkt likes the backlog in trump economy as "money good and dip-buyable... so just buy moar now"
let's see what dan shug and squad offer. i'm buying any dips sub $60... but all else equal, expect upside
V

What's Nifty Next?With rising tensions between countries, market sentiment is becoming increasingly cautious. This geopolitical uncertainty is likely to weigh heavily on investor confidence in the coming weeks.
Based on the current scenario, a realistic target for Nifty seems to be around 21,000 by July, especially if the negative sentiment continues and foreign institutional investors (FIIs) remain net sellers. Global cues, crude oil prices, and currency fluctuations could further impact the index's performance.
📌 However, if by any chance Nifty manages to close above 25,500, it would indicate an extremely strong bullish breakout, defying current market fundamentals. Given the present conditions, this seems highly unlikely, unless there is a sudden positive catalyst such as:
A major resolution in geopolitical issues
Strong corporate earnings
Aggressive policy support from the government or RBI
🧠 My Take:
For now, it’s wise to remain cautious and watch key support/resistance levels. Volatility may remain high, and short-term traders should manage their positions carefully.
💬 Let me know your thoughts in the comments below. Do you think 21k is coming soon, or can the bulls surprise us all?

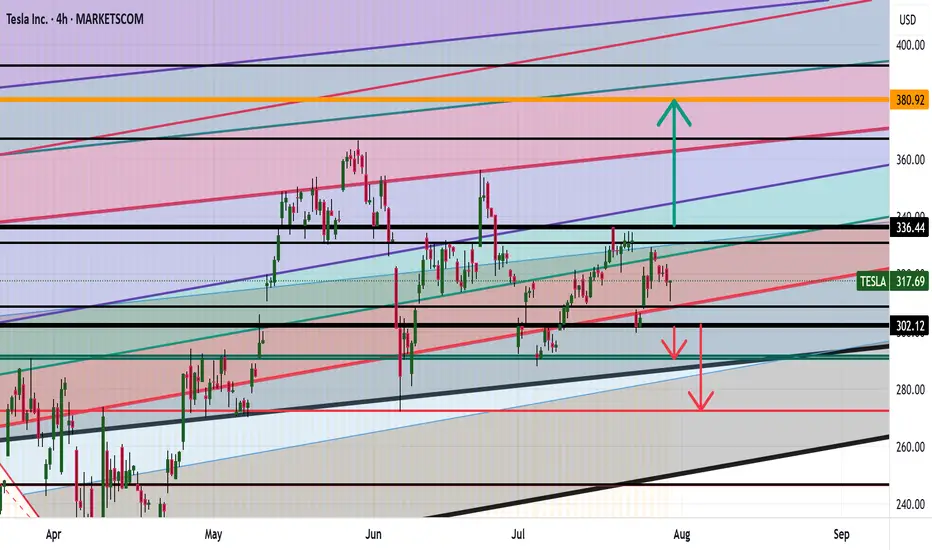
TESLA ANALYSIS CAN WE HIT 380? Evening everyone
Here is the analysis on Tesla currently:
Thesis For Bullish: If we break the highs of 336 then we can hit levels of 380 or higher
Thesis for Bearish: If we break the low at 298 then a drop down to 291 then 275 makes sense
Trade Smarter Live Better
Kris/Mindbloome Exchange
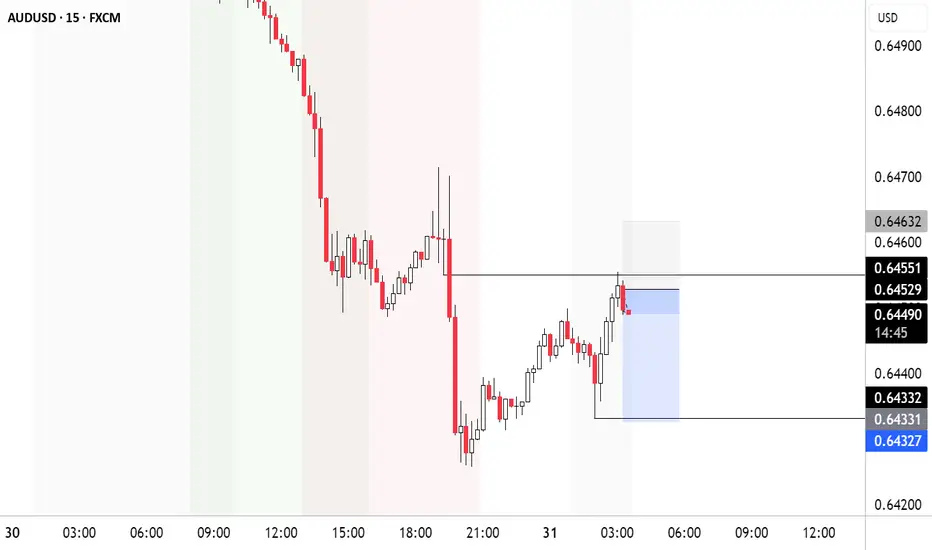
AU ASIA SESSIONI'm currently watching the sell-side liquidity to see if price makes a move in that direction. Given the current structure and momentum, this setup looks like a relatively low-risk opportunity heading into the Asia session. It’s not a guaranteed play, but the risk-to-reward looks favorable if we get confirmation. Let me know what you think about this one — always keen to hear a second perspective.
XAUUSD Expecting Selling Movement After retesting the zone, sellers stepped in again confirming Rejection Selling
Price is now breaking out of the pattern to the downside, signaling potential continuation
Targets
First Target: 3300
Second Target 3275
As long as price stays below the rejection zone, bearish momentum remains valid. Watch for volume confirmation and follow price structure closely

Gold Weekly Outlook (XAUUSD) -28th JulyGold Enters a High-Stakes Week
This week sets the stage for major moves in gold. The charts are signalling liquidity grabs, premium compression, and volatility driven by upcoming macro catalysts.
Key events ahead:
Tuesday: ADP Employment Data
Wednesday: The Fed
Gold is currently consolidating beneath a critical supply zone, suggesting potential for a breakout or rejection. We'll align macro drivers with Smart Money Concepts, ICT methodology, Fibonacci levels, EMAs, RSI, and Fair Value Gaps to craft a precise trading framework.
Technically, price action reflects a corrective phase within a broader uptrend. Confluence support from the ascending trendline and a key horizontal level is in play. As long as price remains above 3342, a bounce toward 3400 remains the preferred scenario.
The broader bullish structure and underlying momentum suggest that once this retracement completes, the uptrend may resume with strength.
🟡 – Summary
🔹 Macro & HTF View:
Bias: Bullish but weakening under premium supply
Key Events: ADP (Tue), FOMC (Wed) → potential for liquidity grabs
Indicators:
RSI divergence (75 → 66)
EMAs flattening
Unfilled FVGs above (3365–3405) and below (3280–3320)
Key Fib targets: 3405 (127%) and 3439 (161.8%)
🔸 Weekly Key Zones
Supply (Short Trap): 3350–3439 → heavy confluence, short bias unless W1 closes above 3439
Primary Demand: 3220–3285 → ideal for news-driven long
Deep Discount (Long Only if Panic): 2960–3050
🎯 Strategy Summary
Short Setup:
Target 3350–3439 → wait for rejection after news
Long Setup:
Target 3220–3285 or deeper
Look for wick rejections + bullish structure reclaim
Avoid: 3285–3350 → indecision zone
🧭 Daily Zones
Sell Zone: 3345–3415 → trap area with FVG + Fib + EMA confluence
Buy Zones:
3290–3320 (primary)
3240–3270 (deeper)
3000–3140 (only if USD spikes)
⏱ H4 + Intraday Bias
Bias: Bearish below 3350
Short Zones:
3365–3405 (rejection only)
3355 (flip zone)
Buy Zones:
3290–3310 (reclaim setup)
3250–3280 (panic flush)
📌 Key Intraday Levels
Resistance: 3405, 3385, 3375–3350, 3350–3340
Support: 3314–3302, 3289–3272, 3260, 3240
⚠️ Final Execution Notes
Stay out of 3340–3326 zone – it’s chop
Wait for confirmation candles (engulfing, pin bars, OB reactions)
Discipline over prediction. Sniper mode only.
Disclaimer: For educational context only.

AACG - Daily - Run-up Into EarningsA notable short squeeze is underway, with most short positions closing on July 24, 2025, potentially aiming to trigger stop-losses for remaining shorts from November 2024. The stock has seen quiet accumulation since August 2024, driven by existing money recycling and new participants. Despite being founded in 1999, the company maintains a $40 million market cap with stable annual revenue growth but consistently negative net income. Its debt is rising, and cash and equivalents are declining, suggesting a potential cash shortfall within five years. While a significant price spike towards $2.40 is anticipated before a gradual decline, unfavorable news could send it below $1, risking delisting.
Not financial advice, always do your due diligence
Leave a like👍 and/or comment💬.
We appreciate and value everyone's feedback!
- RoninAITrader

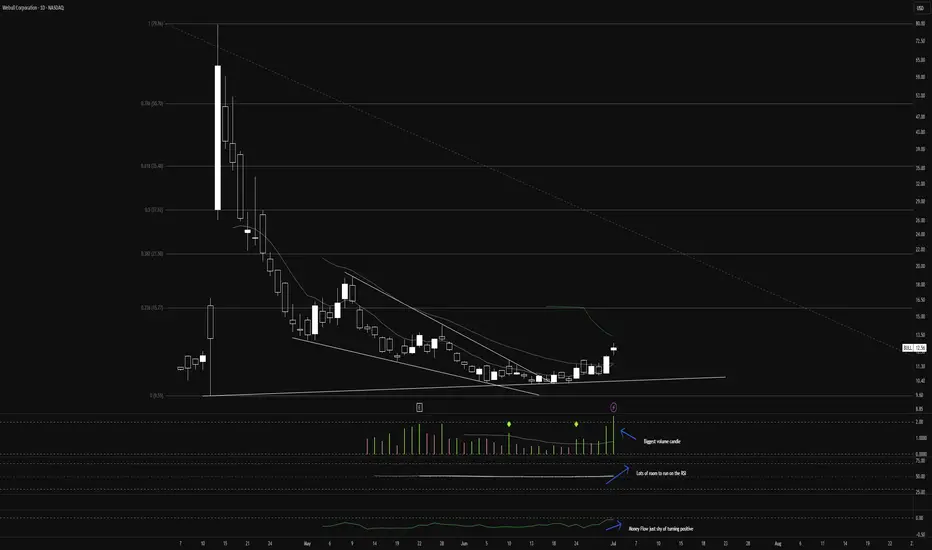
Is the $BULL Ready to Run? A perfect storm of good news here.
June 30 was the last day to redeem $BULLZ warrants. The overhang of insiders dumping shares to arbitrage warrants is gone.
This happened just in time to catch the sector tailwinds from the NASDAQ:HOOD announcement of tokenized public and private assets rolling out in Europe.
WeBull has integrated the NASDAQ:COIN CaaS offering for crypto trading, augmenting its crypto exposure and pairing nicely with Kalshi's integrated hourly crypto contracts. With favorable crypto legislation coming out of the current administration, WeBull is perfectly primed to take advantage of the trend, coupling stock and crypto trading into one neat platform.
Today, July 1, we saw massive volume on call contracts - a 44% increase to average daily volume.
17% YoY growth of user base since Q1 of '24 and a 66% YoY increase in AUM. With revenues on the rise, I would fully expect positive margins this year.
Should be a fun one as we start to catch momentum.
GOLD recovers after many days of declineOANDA:XAUUSD has recovered after several days of declines. Investors will focus on the Federal Reserve's interest rate decision on Wednesday, which is expected to cause significant market volatility.
Gold hit a three-week low of $3,301 an ounce on Monday, before recovering somewhat on Tuesday after falling for a fourth straight day as the dollar erased some of its earlier gains, boosting demand for the precious metal.
Falling US Treasury yields and a weak US jobs report also prompted investors to buy gold.
Data released by the U.S. Labor Department on Tuesday showed the number of jobs added fell in June after two straight months of gains.
The number of jobs added in June fell to 7.44 million from a revised 7.71 million in May. The median forecast of economists in a survey was 7.5 million.
Focus on the Federal Reserve's decision
The Federal Reserve will announce its interest rate decision at 01:00 IST on Thursday; Federal Reserve Chairman Powell will hold a press conference on monetary policy at 01:30 IST on the same day.
The market generally expects the Federal Reserve to keep interest rates unchanged, with the focus on whether Fed Chairman Powell's speech will provide any clues about the timing or pace of future rate cuts.
The market sees a very low chance of a rate cut in July and a roughly 40% chance of another rate cut in September, up from about 10% last month, according to the Chicago Mercantile Exchange's FedWatch tool. Investors will be closely watching the statement and Fed Chairman Powell's remarks at his post-meeting press conference for fresh clues on the timing of the next rate cut.
- If Powell opens the door to a rate cut in September, citing the recent trade deal as a reason to ease uncertainty, US Treasury yields could fall immediately, paving the way for gold prices to rise.
- On the other hand, if Powell avoids committing to a rate cut at this meeting, citing recent rising inflation data, gold prices could fall.
Gold typically performs well in low-interest-rate environments because it does not pay interest and its appeal increases when returns from other assets decline.
Technical Outlook Analysis OANDA:XAUUSD
Gold has recovered from the key $3,300 price point and is holding above $3,310, which is also the nearest support. However, the current recovery is not technically enough to create a short-term uptrend, or conditions for a sustained price increase. In terms of position, gold is under pressure with the 21-day EMA as the nearest resistance at around $3,340 – $3,350. If gold falls below the 0.382% Fibonacci retracement level, it will be eligible to open a new downtrend with a target of around $3,246 in the short term, more than the 0.50% Fibonacci retracement level.
On the other hand, RSI is below 50, and the current 50 level acts as momentum resistance in the short term. If RSI slopes down, it will signal bearish momentum with more downside ahead. For gold to qualify for bullish expectations, it needs to at least push price action above EMA21, then retrace back to the price channels and finally break above the 0.236% Fibonacci retracement level to confirm bullish conditions. The upside target could be towards $3,400 in the short term, more like $3,430 – $3,450.
For the day, the technical outlook for gold prices tends to lean more towards the downside, with the following notable points listed.
Support: 3,310 – 3,300 – 3,292 USD
Resistance: 3,340 – 3,350 – 3,371 USD
SELL XAUUSD PRICE 3376 - 3374⚡️
↠↠ Stop Loss 3380
→Take Profit 1 3368
↨
→Take Profit 2 3362
BUY XAUUSD PRICE 3280 - 3282⚡️
↠↠ Stop Loss 3276
→Take Profit 1 3288
↨
→Take Profit 2 3294
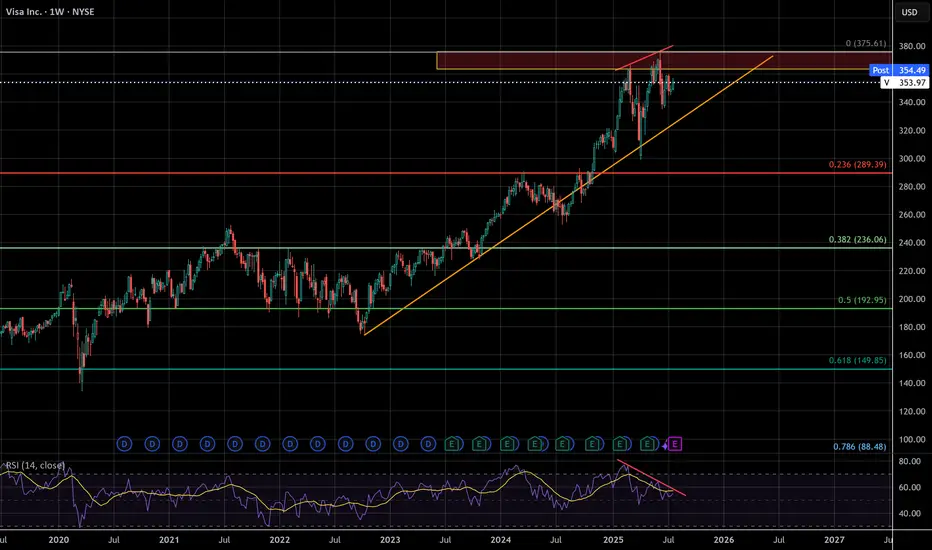
VISA - The missing puzzle piece - Suffering from successI've seen a lot of negative sentiment online lately about the impending bubble, but even with social media, crude AI, and the US dollar being the peak of that negativity this whale has been dying slowly and few have taken notice.
VISA has begun to censor what can be bought, overcharge merchants, and short change banks on interchange fees. These are acts of desperation as growth reaches diminishing returns, the beginning decline of a massive company. Think about it, who isn't using visa already? They have to wait for new users to be born. There will only ever be more competition, competition that has superior speed, accuracy, efficiency, and cost.
VISA may not lead this crash, but it's days look to be numbered unless they make radical changes . According to google results, antitrust violations can carry 3 times the monetary penalty gained from illegal activity. I don't think this will happen, but it's a TON of leverage for a massive settlement. The cracks are just beginning, but this company is made of glass
Messy Cup and HandleURA continues to pump as nuclear energy speculation goes wild but be careful, if tech goes down it may just take down nuclear with it. Tariffs can also cause a massive price swing, my guess is that if Canada is tariffed the cost of URA will go through the roof

STELLAR LUMENS - DOLLAR COST AVERAGE FOR LONG TERM GAINSSTELLAR LUMENS (XLM) has taken off late 2024 from under .10 cents and now trading at .40 cents for a 400% Gain in 6 months so far, and there is much more upside to come potentially. It hit all time highs around .50 cents and now the token seems to want to test those highs in the near term 2025, we can easily see XLM approach $1.00 towards 2026 for a 100% gain and even higher longer term. Overall, XLM moves with XRP and we all know XRP is a blue chip project, it has all the funds and institutional backing, and so does XLM.
Both projects share a common creator in Jed McCaleb, however they have different focuses. Ripple, and its native token XRP, was initially designed to facilitate cross-border payments for financial institutions. Stellar, on the other hand, focuses on financial inclusion and aims to provide accessible financial services for individuals, including remittances and access to banking services.
CAN WE SAY BULLISH?! TO THE MOON!!!

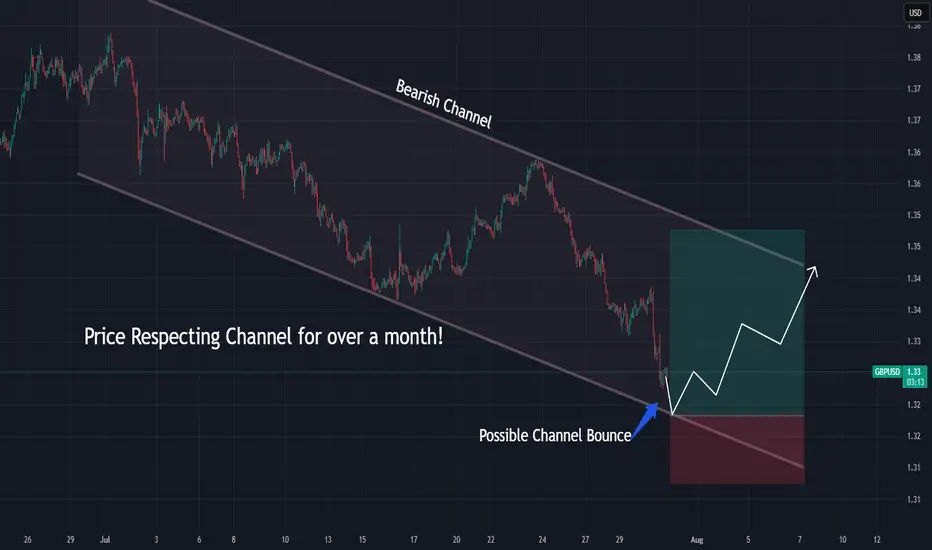
GBPUSD Approaching Channel Support — Rebound Ahead?GBPUSD is nearing the bottom of a well-defined bearish channel while Stoch RSI begins to curl upward.
📌 Bearish channel structure intact
📌 Possible bounce off ~$1.322 zone
⏱️ Timeframe: 1H
#gbpusd #forex #tradingstrategy #channeltrading #technicalanalysis #quanttradingpro #tradingview
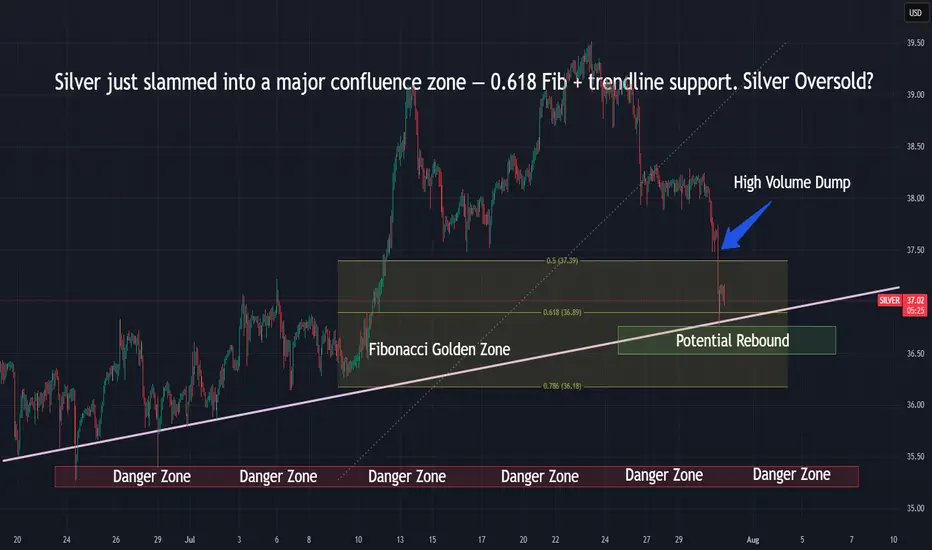
Silver Hits Fibonacci Support — Rebound or Dump?Silver just slammed into the 0.618 Fib — a key reversal zone.
📌 Eyes on bounce or breakdown toward the danger zone below $36
⏱️ Timeframe: 1H
#silver #xagusd #fibonacci #commodities #tradingstrategy #tradingview #quanttradingpro