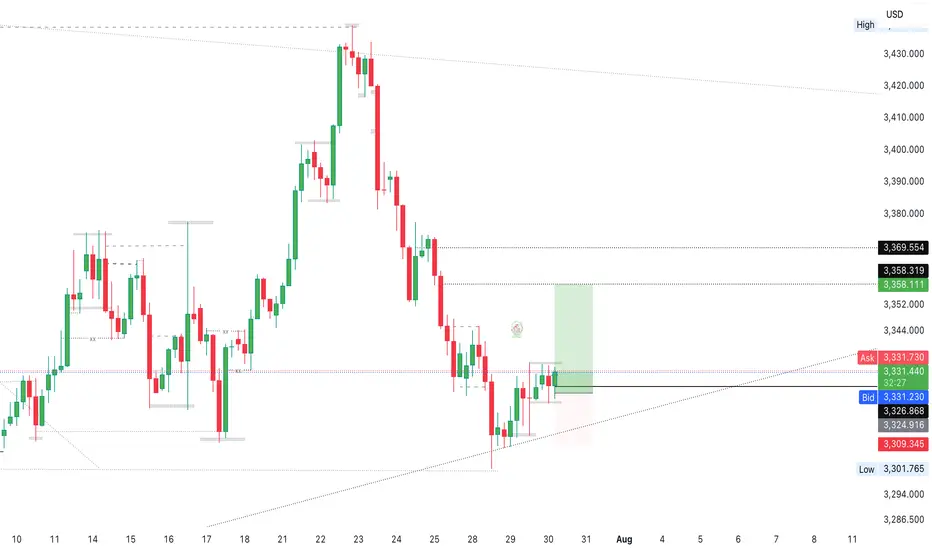
Gold Market Builds Momentum Toward 3358 Supply ZoneGold market continues to build momentum gradually, with price action targeting supply mitigation at 3358.
The duration of this stance depends on whether price can clear this zone decisively; failure may lead to short-term consolidation before the next stance.comment ,boost idea and follow for more informed decisions on gold market
Fundamental Analysis
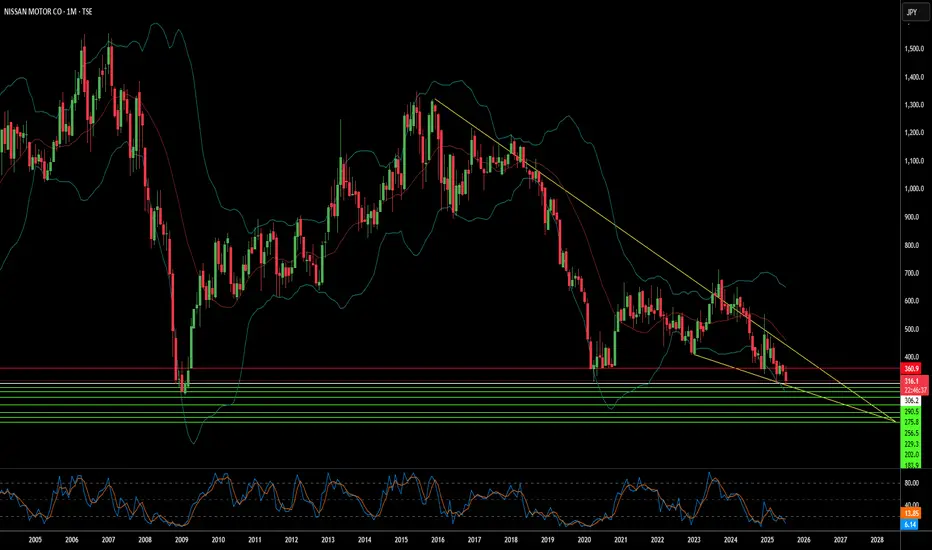
Is Nissan's Future Fading or Forging Ahead?Nissan Motor Company, once a titan of the global automotive industry, navigates a complex landscape. Recent events highlight the immediate vulnerabilities. A powerful 8.8-magnitude earthquake off Russia's Kamchatka Peninsula on July 30, 2025, triggered Pacific-wide tsunami alerts. This seismic event prompted Nissan to **suspend operations at certain domestic factories in Japan**, prioritizing employee safety. While a necessary precaution, such disruptions underscore the fragility of global supply chains and manufacturing, potentially impacting production targets and delivery schedules. This immediate response follows a period of significant operational adjustments as Nissan grapples with broader economic, geopolitical, and technological headwinds.
Beyond natural disasters, Nissan faces substantial financial and market share challenges. Although Fiscal Year 2023 saw operating profit and net income increases, global sales volume remained largely stagnant at 3.44 million units, signaling intensified market competition. Projections for Fiscal Year 2024 indicate a **forecasted revenue decline**, and recent U.S. sales figures show an 8% year-on-year drop in Q1 2025. Macroeconomic pressures, including inflation, volatile currency fluctuations, and a significant hit from **billions of dollars in lease losses** due to plummeting used car values, have directly impacted profitability. Geopolitical tensions, particularly the threat of a 24% U.S. tariff on Japanese auto exports, further threaten Nissan's crucial North American market.
Nissan's struggles extend into the technological arena and its innovation strategy. Despite holding a **remarkable patent portfolio** with over 10,000 active families, the company faces criticism for **lagging in electric vehicle (EV) adoption** and perceived technological stagnation. The slow rollout and underwhelming market impact of new EV models, coupled with a notable absence in the booming hybrid market, have allowed competitors to gain significant ground. Moreover, the brand has contended with **multiple cybersecurity breaches**, compromising customer and employee data, which damages trust and incurs remediation costs. Internal factors, including the lingering effects of the **Carlos Ghosn scandal**, management instability, and costly product recalls—like the recent July 2025 recall of over 480,000 vehicles due to engine defects—have further eroded investor confidence and brand reputation. Nissan's journey ahead remains uncertain as it strives to regain its competitive edge amidst these multifaceted pressures.
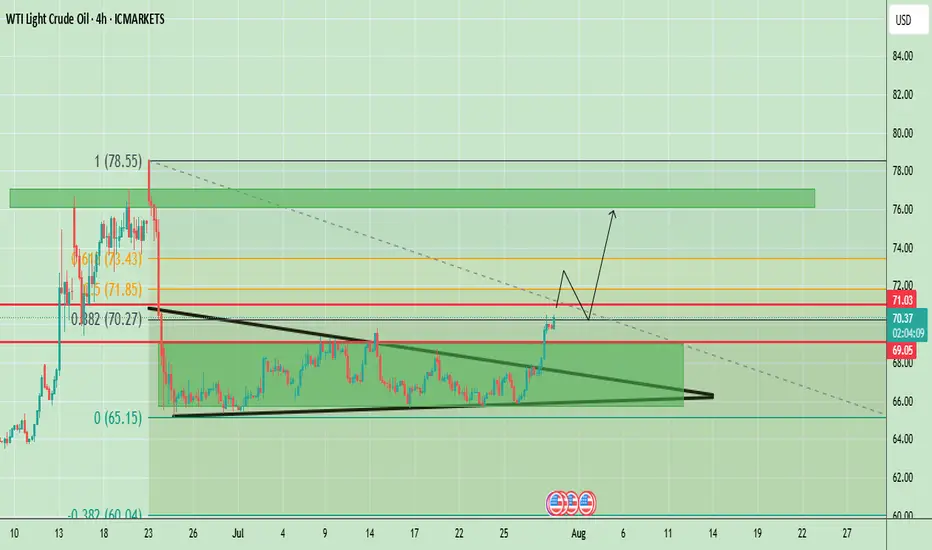
WTI Crude Oil Breaks Out of Symmetrical Triangle, $73-$76 ZoneThe WTI Crude Oil chart shows a strong breakout from the symmetrical triangle pattern that was forming for several weeks. Price has decisively broken above the descending resistance trendline and is now testing the $70–$71 area, which aligns with the 0.382 Fibonacci retracement level (around $70.27) and an important horizontal resistance ($71.03). This breakout indicates strong bullish momentum, supported by the recent series of higher lows and a sharp upward move in recent sessions.
If price sustains above $69.05 (previous breakout zone), we could see a bullish continuation towards $73.40 (0.118 Fibonacci) and potentially to $76.00–$76.50, which is the upper resistance block marked on the chart. However, if the price fails to hold above $69.00, there could be a pullback to retest the broken triangle resistance around $67–$68 before any next bullish leg.
Weekly Chart
The weekly chart of WTI Crude Oil is showing a long-term downtrend channel, where price has been consistently making lower highs and lower lows since mid-2023. Currently, oil is trading around $69.96, showing a sharp bullish push of 6.13% for the week. However, the price is still inside the broader descending channel, which keeps the long-term trend bearish unless a confirmed breakout occurs.
Key Resistance Levels:
- $70.27, $71.03, $73.43
Support Levels:
- $69.05 (previous breakout zone)
- $67.00–$68.00 (triangle retest area)
Trend Outlook:
- Short-Term: Bullish momentum; pullbacks likely to hold above $69.05.
- Medium-Term: If $71.85 breaks, price may target $76.00–$76.50 resistance.
Note
Please risk management in trading is a Key so use your money accordingly. If you like the idea then please like and boost. Thank you and Good Luck!
DAX 24.07.2025~+ Post-trade deal risk-on seems to be subsiding
~+ Profit taking towards the ECB Rate decision

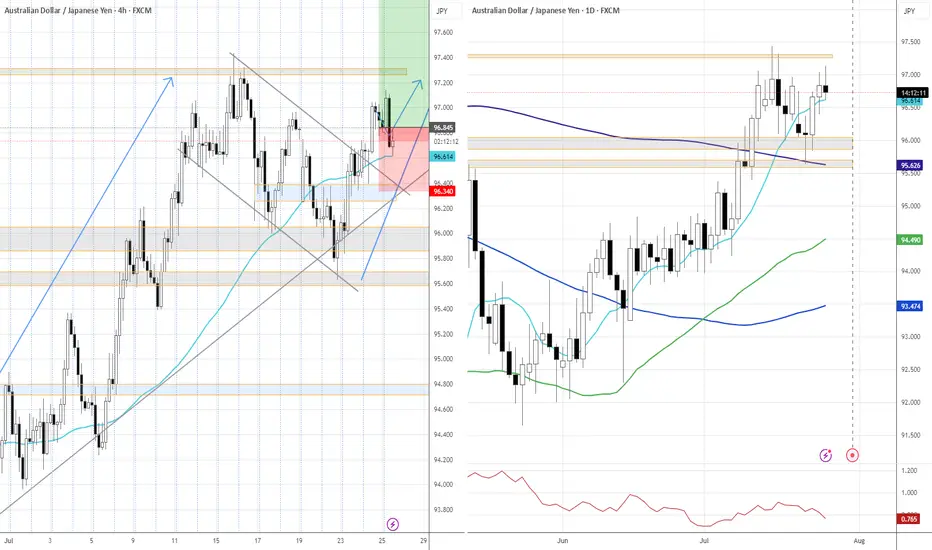
AUDJPY 24.07.2025+~ RBA is relatively hawkish
+~ Political uncertainty around JPY
+~ Positive trade deals anticipation
*Swing trade; giving a room for a reasonable pullback; will potentially look to scale in at the resolve of a newly-formed structure.

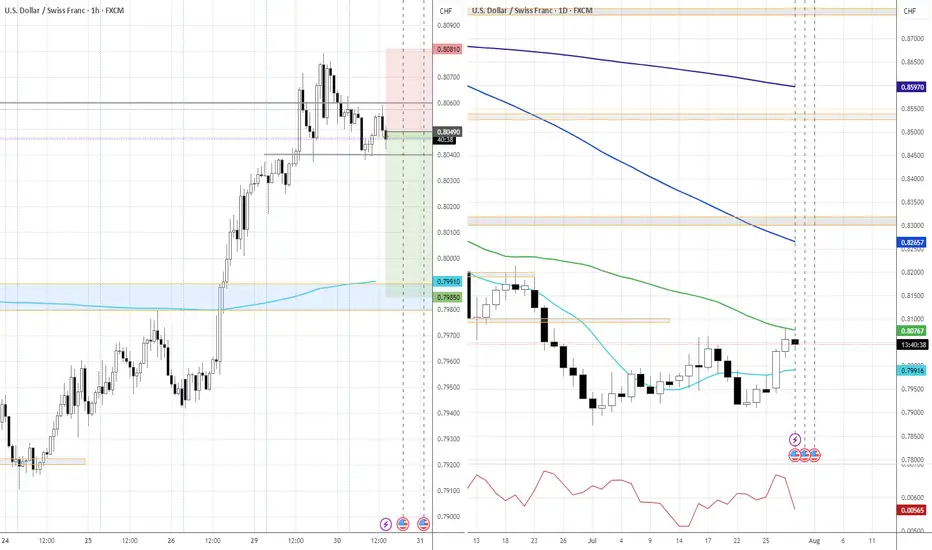
USDCHF 30.07.2025~+ Lack of credibility, general narrative around the USD & Fed, shaky geopolitics
~+ Timing: dollar bulls' profit-taking into the Fed Rate Decision
~+ Swiss KOF Beat
* USD move from the US-EU trade deal looks overdone against multiple assets
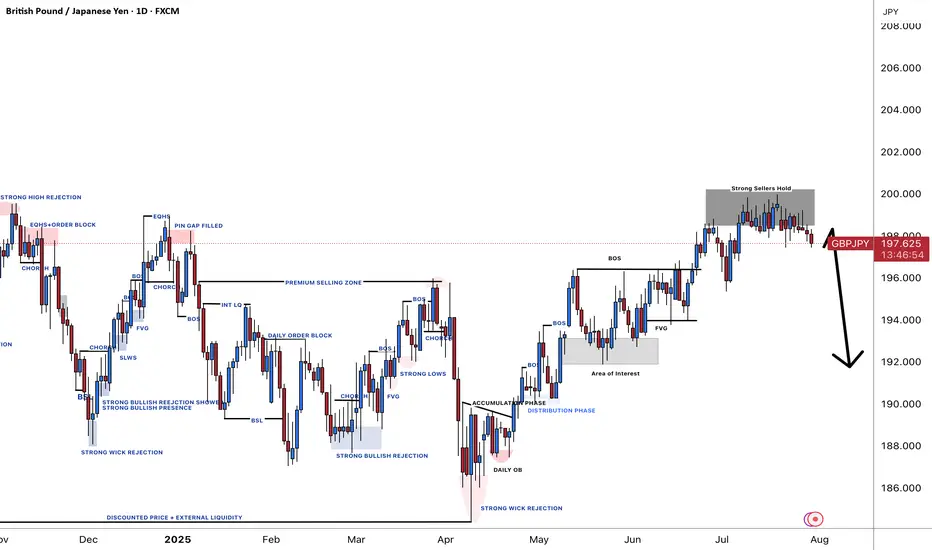
GBPJPY; 600+ PIPS Possible Selling Opportunity GBPJPY has failed to breakthrough 200 price region, suggesting a strong sellers hold. Price behaviour and volume show the same thing. Our target is at 191 which will be a 600 to 700 pips move.
Good luck and trade safe
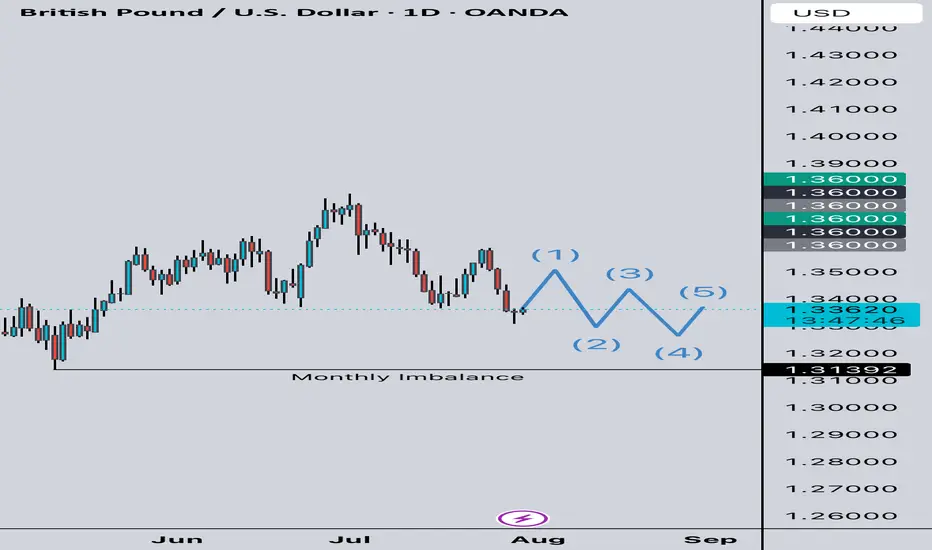
GBP USD Long Term SellAs we are approaching NFP and FOMC, the outlook for me will be a no rate change and with the consensus being USD Long, it makes sense for GBP USD to sell off. Monthly, Weekly and Daily looking like it wants to continue down after a manipulation bringing GBP USD higher in the short term. A lot of pips to the downside into the end of this week and next week. Definitely one to keep an eye on.
Gold Price Analysis July 30Gold (XAUUSD) Consolidating in a Triangle Pattern – Preparing for a Big Breakout
Currently, gold is moving within a triangle consolidation pattern, reflecting the market’s indecision as investors await a series of important economic data from the US this week. This hesitation suggests that a breakout from the triangle pattern could trigger a strong FOMO effect, creating a significant price movement in either direction.
The current price action is similar to a “bull flag” or “pennant” pattern, where a breakout could lead to a clearer and more decisive trend. If the support zone in the pattern fails to hold, the possibility of a sell-off is high.
Trading scenario:
🔻 Activate SELL order:
When price breaks the triangle bottom around 3324
Downside target: 3285, further is the strong support zone at 3250
🔺 Activate BUY order:
When price breaks and holds above the resistance zone 3333
Or: when there is a bearish rejection signal and candle confirmation at the area 3385

EUR/USD: ECB Pauses Amid UncertaintyBy Ion Jauregui – Analyst at ActivTrades
The European Central Bank has decided to pause its rate-cutting cycle after seven consecutive reductions over the past twelve months, leaving the deposit rate at 2%, the refinancing rate at 2.15%, and the marginal lending facility at 2.4%. This move, largely priced in by the markets, reflects the ECB’s growing caution in the face of inflation that has officially reached its 2% target but may rebound if certain fiscal and geopolitical risks materialize.
Christine Lagarde’s message has been interpreted with a hawkish tone. Although both headline and core inflation have eased — the latter standing at 2.3% — the ECB warns that surprises may still occur. Massive defense spending, fiscal imbalances, and international trade tensions (such as tariffs recently signed by Trump with Japan) could disrupt the current equilibrium.
Markets have reacted calmly: the EUR/USD barely moved a tenth of a percent after the decision, while implied interest rates in the money markets have lowered the odds of another rate cut in September. Now, only a symbolic 5 basis point cut is priced in at most.
Technical Analysis
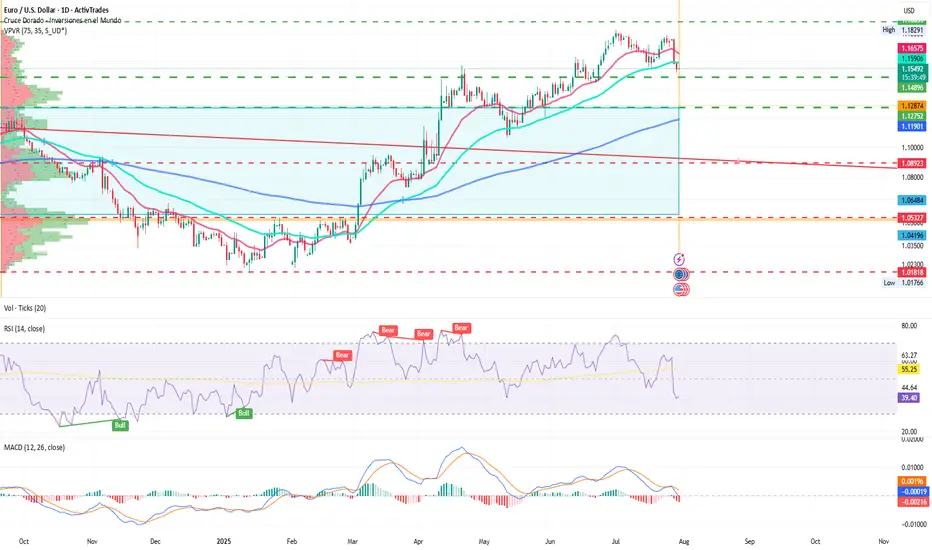
Overall trend: Sideways to bearish in the short term; bullish in the long term.
Key support levels:
1.1488: technical and psychological reference level
1.1275: recent July low
Key resistance levels:
1.8291: short-term high
1.2278: next resistance level
The pair attempted to break higher last week but failed, starting this week with a bearish tone. As long as the price holds above key support, the bullish trend may continue. A daily close below the first support could trigger a move toward the point of control (POC) zone at 1.0419. The daily RSI is in oversold territory at 38.95%, while the MACD shows signs of turning lower, indicating a loss of bullish momentum.
There is growing speculation that the ECB's rate-cutting cycle may be over. Within the ECB, figures like Isabel Schnabel are calling for patience, while others, such as Philip Lane and Luis de Guindos, still don’t rule out a final adjustment if September projections show economic weakness.
In this context, the price range that began from the point of control zone toward recent highs appears to be losing steam. Going forward, the evolution of the EUR/USD will depend on inflation trends, European fiscal policy, and the ECB’s response to tariff tensions with the United States and other global challenges as summer draws to a close.
*******************************************************************************************
The information provided does not constitute investment research. The material has not been prepared in accordance with the legal requirements designed to promote the independence of investment research and such should be considered a marketing communication.
All information has been prepared by ActivTrades ("AT"). The information does not contain a record of AT's prices, or an offer of or solicitation for a transaction in any financial instrument. No representation or warranty is given as to the accuracy or completeness of this information.
Any material provided does not have regard to the specific investment objective and financial situation of any person who may receive it. Past performance and forecasting are not a synonym of a reliable indicator of future performance. AT provides an execution-only service. Consequently, any person acting on the information provided does so at their own risk. Political risk is unpredictable. Central bank actions can vary. Platform tools do not guarantee success.
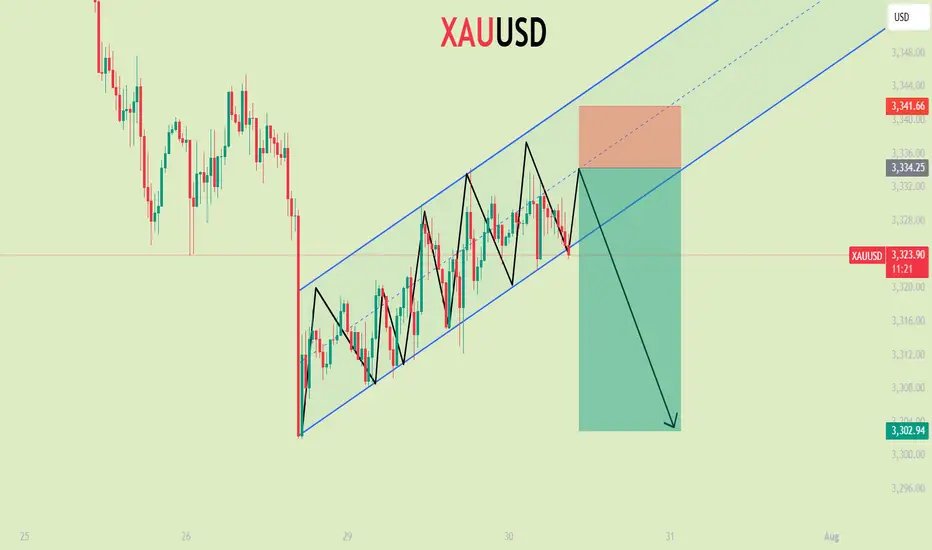
XAUUSDXAUUSD Updated in 30M :
The gold signal is marked on the chart based on the latest price changes and the supply and demand in the market. These points include the entry point, stop loss, and take profit
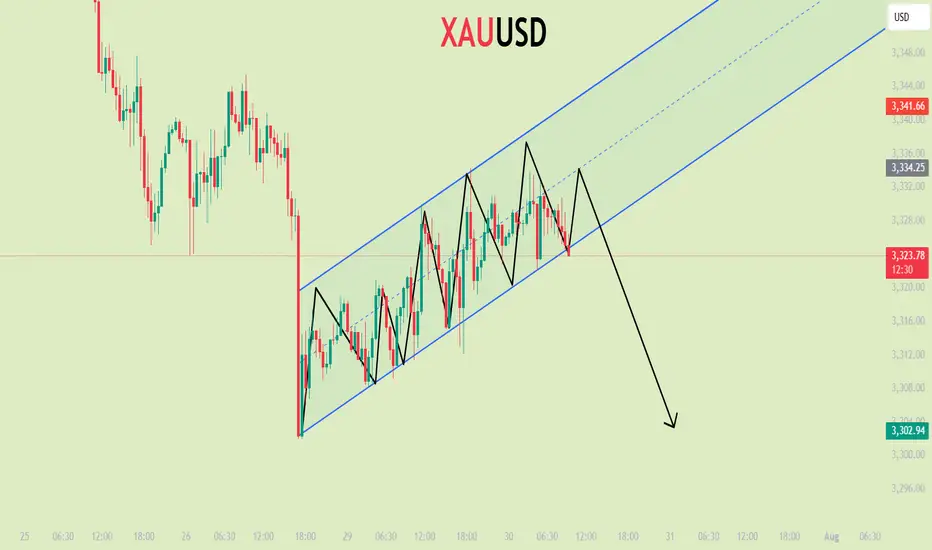
XAUUSDXAUUSD Updated in 30M :
The gold signal is marked on the chart based on the latest price changes and the supply and demand in the market. These points include the entry point, stop loss, and take profit
Bitcoin Passes Stress TestOn July 25, 2025, Galaxy Digital executed one of the largest Bitcoin sales ever recorded: 80,000 BTC, valued at approximately $9 billion , on behalf of a Satoshi-era investor.
Despite the size, the market absorbed the flow with minimal volatility—Bitcoin dipped from around $119,000 to $115,000, then rebounded above $119,000.
Liquidity Maturity in Motion
Analysts called the trade a significant demonstration of market maturity, noting that 80,000 BTC was absorbed in days with barely a market blip.
Crypto infrastructure has also evolved: algorithmic liquidity providers, institutional desks, and OTC channels handled the load without triggering cascading funding rate hikes or forced liquidations.
Ongoing Risks
Event-Driven Stress: During macro shocks or sharp sell-offs, liquidity may thin, and the same level of absorption might not persist.
OTC vs Exchange: This large sale was managed mostly off-exchange. A similar-sized on-exchange dump could still trigger stop-run cascades.
Retail Complacency Risk: The stability seen now can be deceptive, as retail may misinterpret low volatility as a safe leverage zone, only to be caught off-guard.
Projections:
Watching the 23.6% fib retracement level in line with the $116,600 price level. Anticipate the resistance level of $120,000 to be retested.
If price breaks above $120,000, we could see a significant move toward $130,000
The $9B BTC sale went through without materially impacting price is considered a milestone in crypto market evolution. It reflects institutional-grade liquidity and sentiment maturity.

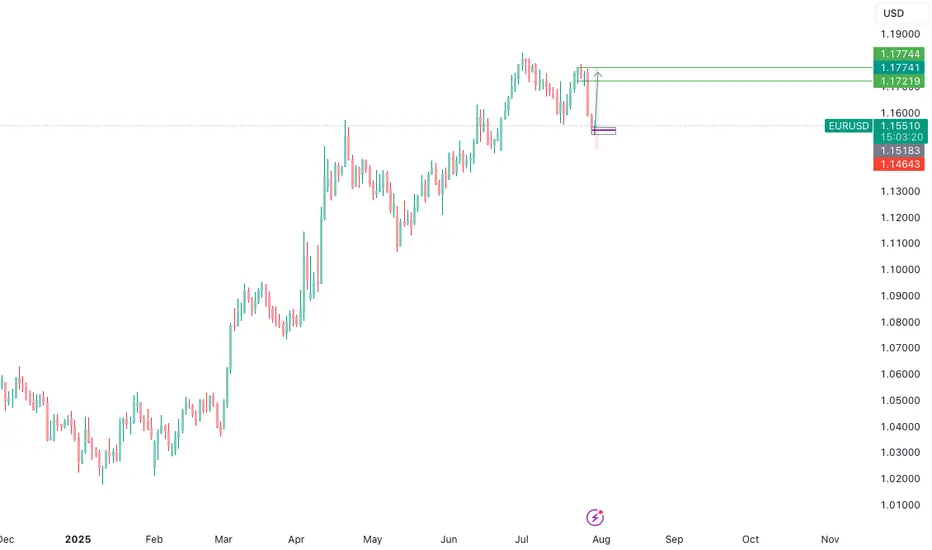
EURUSD Long Setup – Liquidity Sweep + Distribution Opportunity**📍 EURUSD Long Setup – Liquidity Sweep + Distribution Opportunity**
Currently monitoring EURUSD as price consolidates near a potential short-term demand zone. The recent price action suggests that we may observe a **liquidity grab below previous session lows**, possibly during the **London session**, before a directional move.
My focus remains on **how New York session will react** — potentially stepping in as a **distribution phase**, which could initiate the bullish leg toward the upper imbalance zones.
Key confluences:
* Anticipated liquidity below previous session lows (Asia & London).
* Bullish FVG aligned with higher timeframe structure.
* Targets at **1.17219** and extension toward **1.17744**, matching daily imbalance and previous supply area.
Patience is key here. Waiting for **clear confirmation post-sweep**, ideally via a CHoCH or bullish engulfing on the lower timeframe, before executing.
`DO NOT USE THIS AS SIGNAL OR ANY OF A KIND´
Emerson Massawe
COO | FINANCIAL MARKET ANALYST|
S&P 500 as expensive as at the end of 2021 in valuation terms !Two weeks ago, I shared a technical analysis of the S&P 500 across all timeframes. This analysis outlines price targets for the end of 2025 based on technical and fundamental criteria. You can revisit this analysis by clicking the first chart below.
WARNING: A major bullish target I previously mentioned is close to being reached—6,475 points on the S&P 500 futures contract. The market may soon enter a consolidation phase.
Given this week's packed fundamentals, it's wise to start locking in your gains by moving up your stop-loss levels—especially as the S&P 500 has now returned to its end-2021 valuation peak.
Click on the table below to access details on this week's significant fundamental developments:
1. Caution: The S&P 500 has reached its end-2021 valuation record!
While technical market analysis is important, valuation metrics are even more so. The S&P 500 has just reached its previous valuation peak from the end of 2021—historically the starting point of the 2022 bear market. While the current macro context is different, this level could trigger a short-term market pause.
Chart showing S&P 500 valuation via the CAPE Ratio (Shiller PE):
2. S&P 500 seasonality is weaker in August and bearish in September
Another cautionary factor is seasonality. A statistical look at average S&P 500 performance by month highlights a weaker period in August and a typically negative one in September.
In summary, technical, fundamental, and seasonal analysis all point to securing gains as we approach August/September—without questioning the underlying long-term uptrend.
Chart showing S&P 500 seasonality since 1960:
DISCLAIMER:
This content is intended for individuals who are familiar with financial markets and instruments and is for information purposes only. The presented idea (including market commentary, market data and observations) is not a work product of any research department of Swissquote or its affiliates. This material is intended to highlight market action and does not constitute investment, legal or tax advice. If you are a retail investor or lack experience in trading complex financial products, it is advisable to seek professional advice from licensed advisor before making any financial decisions.
This content is not intended to manipulate the market or encourage any specific financial behavior.
Swissquote makes no representation or warranty as to the quality, completeness, accuracy, comprehensiveness or non-infringement of such content. The views expressed are those of the consultant and are provided for educational purposes only. Any information provided relating to a product or market should not be construed as recommending an investment strategy or transaction. Past performance is not a guarantee of future results.
Swissquote and its employees and representatives shall in no event be held liable for any damages or losses arising directly or indirectly from decisions made on the basis of this content.
The use of any third-party brands or trademarks is for information only and does not imply endorsement by Swissquote, or that the trademark owner has authorised Swissquote to promote its products or services.
Swissquote is the marketing brand for the activities of Swissquote Bank Ltd (Switzerland) regulated by FINMA, Swissquote Capital Markets Limited regulated by CySEC (Cyprus), Swissquote Bank Europe SA (Luxembourg) regulated by the CSSF, Swissquote Ltd (UK) regulated by the FCA, Swissquote Financial Services (Malta) Ltd regulated by the Malta Financial Services Authority, Swissquote MEA Ltd. (UAE) regulated by the Dubai Financial Services Authority, Swissquote Pte Ltd (Singapore) regulated by the Monetary Authority of Singapore, Swissquote Asia Limited (Hong Kong) licensed by the Hong Kong Securities and Futures Commission (SFC) and Swissquote South Africa (Pty) Ltd supervised by the FSCA.
Products and services of Swissquote are only intended for those permitted to receive them under local law.
All investments carry a degree of risk. The risk of loss in trading or holding financial instruments can be substantial. The value of financial instruments, including but not limited to stocks, bonds, cryptocurrencies, and other assets, can fluctuate both upwards and downwards. There is a significant risk of financial loss when buying, selling, holding, staking, or investing in these instruments. SQBE makes no recommendations regarding any specific investment, transaction, or the use of any particular investment strategy.
CFDs are complex instruments and come with a high risk of losing money rapidly due to leverage. The vast majority of retail client accounts suffer capital losses when trading in CFDs. You should consider whether you understand how CFDs work and whether you can afford to take the high risk of losing your money.
Digital Assets are unregulated in most countries and consumer protection rules may not apply. As highly volatile speculative investments, Digital Assets are not suitable for investors without a high-risk tolerance. Make sure you understand each Digital Asset before you trade.
Cryptocurrencies are not considered legal tender in some jurisdictions and are subject to regulatory uncertainties.
The use of Internet-based systems can involve high risks, including, but not limited to, fraud, cyber-attacks, network and communication failures, as well as identity theft and phishing attacks related to crypto-assets.

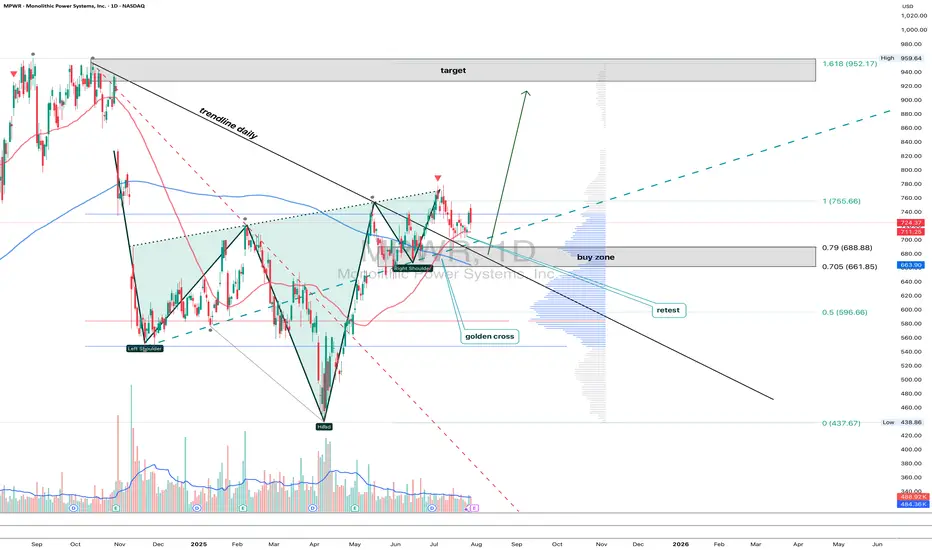
MPWR 1D: shoulders are squared and the battery's still fullMonolithic Power Systems broke out of a long-term descending trendline after completing a clean inverse head and shoulders. Now the price is pulling back into the 705–688 zone — a textbook retest area that combines the neckline, the 0.705–0.79 Fib levels, and a major volume shelf. Add to that a golden cross (EMA50 crossing EMA200 from below) and we have a solid technical foundation for continuation. Volume on the pullback is low, indicating no panic, just rotation. If 688 holds, the next levels to watch are 755.66 and 952.17 — the latter being the 1.618 Fib extension. Tactical setup: look for a reversal signal between 705–688, with a stop just below 661. As long as price holds this zone, the bullish structure remains intact.
Fundamentally, MPWR remains one of the strongest names in the semiconductor space. With over $1.5B in annual revenue and industry-leading margins, the company continues to see strong demand from data center and EV sectors. In its latest report, management highlighted accelerating orders from Tier‑1 manufacturers. The balance sheet is clean, with zero debt, and ongoing buybacks provide downside support. In a sector full of volatility, MPWR stands out with both structural reliability and technical clarity - making it a strong candidate for long-term positioning.
If this textbook pattern plays out, the train’s just leaving the station. The best seat is usually the one taken before the doors close.
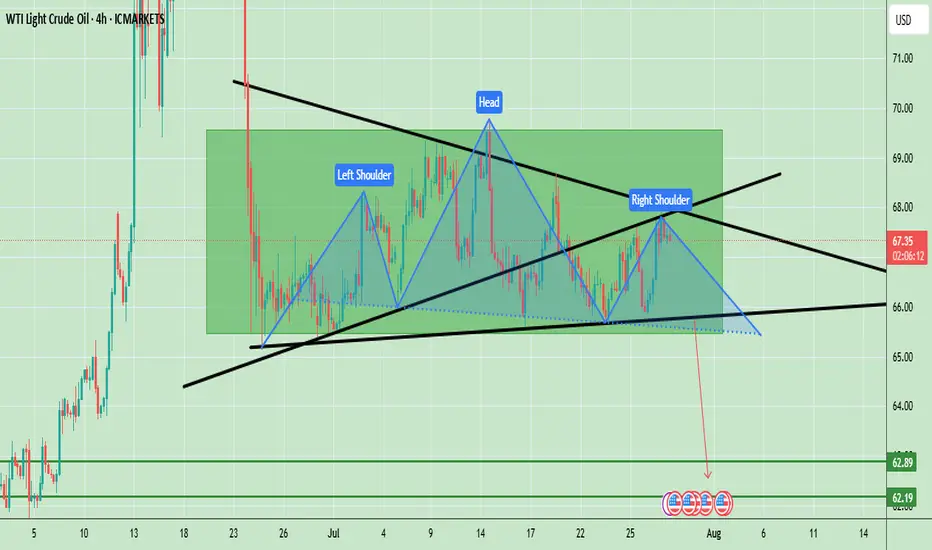
Oil Prices Form Bearish Head & Shoulders – Key Neckline in FocusWTI crude oil is showing a clear Head and Shoulders (H&S) pattern, which is a strong bearish reversal signal. The left shoulder formed in early July, followed by a higher peak forming the head in mid-July, and finally the right shoulder near the current levels, which is lower than the head. The neckline is positioned around $66.00, acting as a key support level. Currently, the price is trading at $67.34, hovering slightly above this neckline, indicating that the market is at a critical decision point. A confirmed break below the neckline could accelerate bearish momentum, targeting the $62.20 – $62.80 zone based on the pattern’s measured move. However, if the neckline holds, a possible bounce toward $68.50 – $69.00 could occur, but overall bias remains bearish unless the price can break and sustain above $69.00.
Key Price Levels:
- Resistance: $68.50 – $69.00
- Neckline Support: $66.00
- Bearish Target (if confirmed): $62.20 – $62.80
Note
Please risk management in trading is a Key so use your money accordingly. If you like the idea then please like and boost. Thank you and Good Luck!
GBPUSD LONG im buying GBPUSD because structure break shows buyer control Imbalance creates a natural magnet Lower timeframe confirms the energy
USDTHB 30 July 2025Despite ongoing geopolitical tensions between Thailand and Cambodia, the recent mild depreciation of the Thai baht is largely attributable to dollar strength. Accordingly, we have revised the USD/THB trading range slightly lower.
Monthly Target: 31.50-33.05 thb/usd

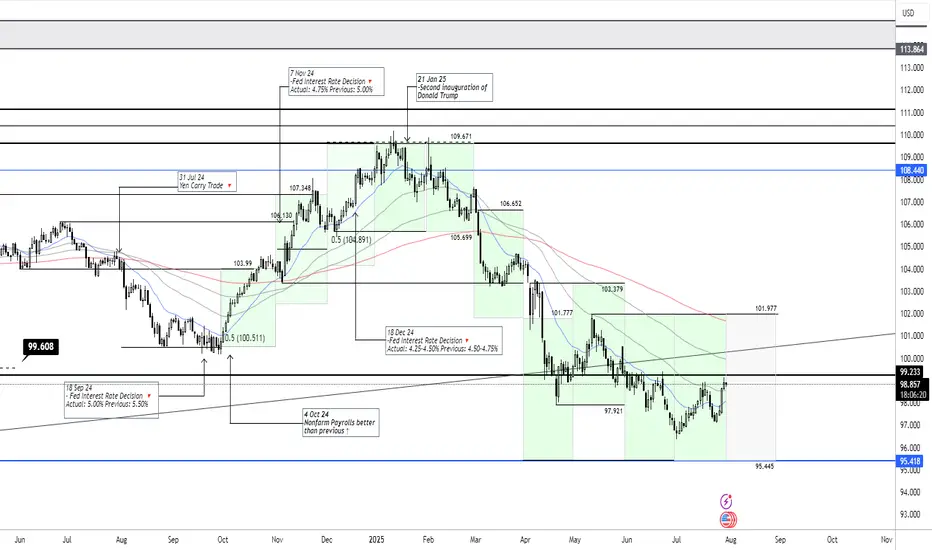
DXY July 30 2025The US dollar remains within the projected trading band, and we expect it to continue fluctuating within this range over the coming month.
Monthly Target: 95.445-101.977
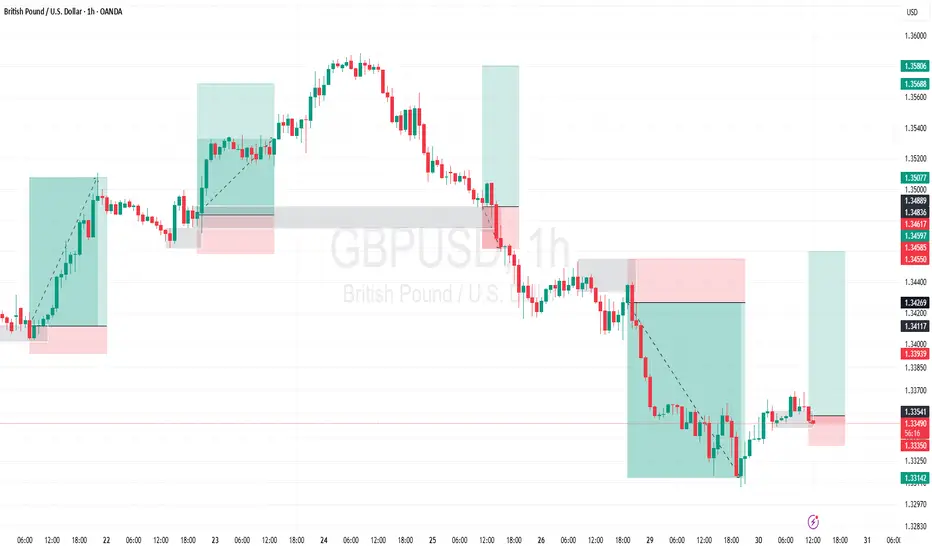
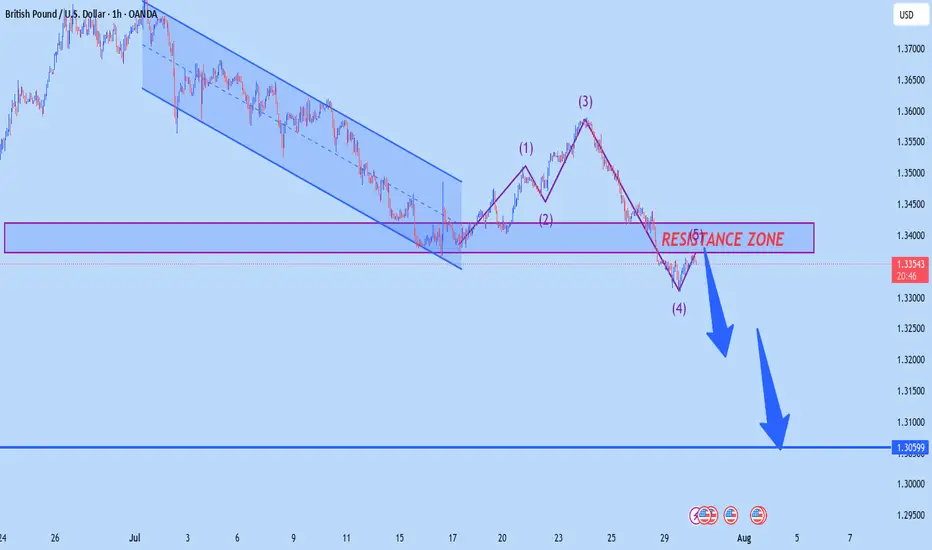
GBPUSD H1 OUTLOOKaccording to H1 analysis GBP market is at RESISTANCE LEVEL so we have great chance to go short from RESISTANCE LEVEL dont be greedy use money management
TRADE AT YOUR OWN RISK
REGARD ALBERT
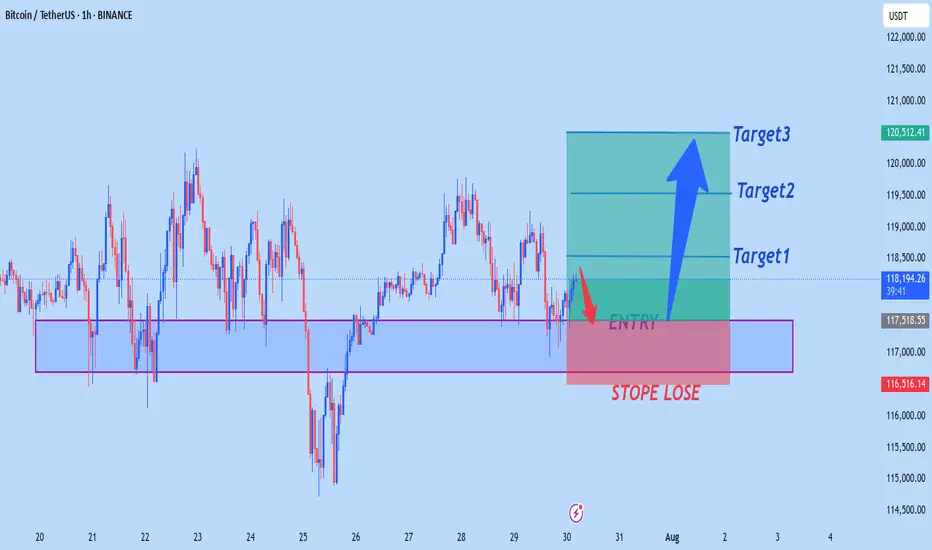
BTCUSD NEW OUTLOOKBtcusd buy from 117,500
Target1 118,500
Target2 119,500
Target3 120,500
Stope Lose 116,500
TRADE AT YOUR OWN RISK