XAUUSD CAN FLY HIGHXauusd market running in side from last few days now market will touch the support zone so if you to buy gold then you have to good oppourtanity to buy from support level
TRADE AT YOUR OWN RISK
REGARD ALBERT
Fundamental Analysis
Are you ready for the BUY BTCUSD signal?✏️ The pennant pattern is forming. After BTCUSD reached a new peak, the past 1 week, BTC price has been accumulating to form a bullish pennant pattern. This is a bullish continuation pattern that signals when breaking the upper boundary of the flag pattern.
📉 Key Levels
BUY Trigger: Break and trade above 199000
Target 128000
Leave your comments on the idea. I am happy to read your views.

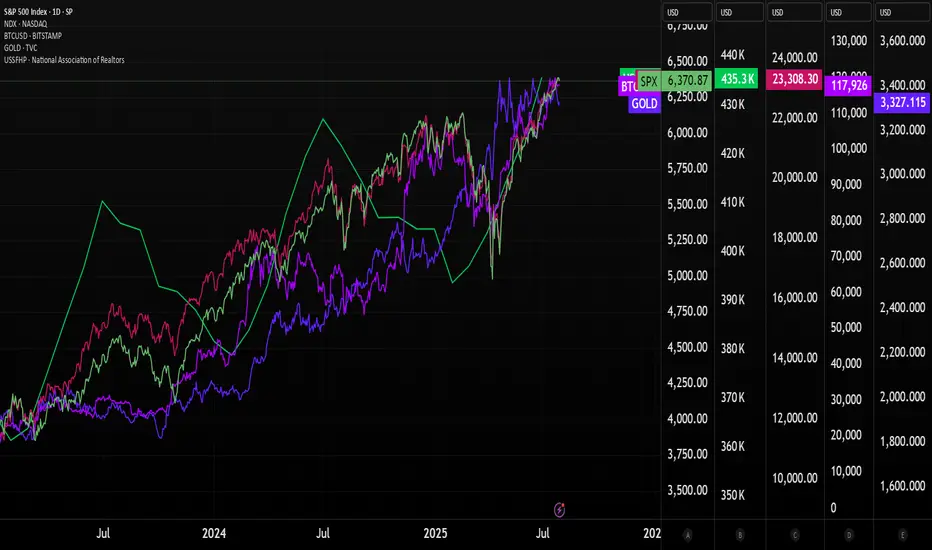
Nasdaq and S&P 500 higher than ever. Crash incoming??The stock market is now more expensive than ever.
Some people are calling the top, saying that the market is overbought and too high.
There are indicators that show that the market is overheated, but NO ONE KNOWS whether it's going to crash next week or continue running up for months.
Since April, Nasdaq has gained 40%, which is a lot. Congrats if you bought some QLD and TQQQ back in April when I posted about it.
SP:SPX : All-time high. NASDAQ:NDX : All-time high. BITSTAMP:BTCUSD : All-time high. TVC:GOLD : All-time high HOME PRICES ( ECONOMICS:USSFHP ): All-time high. Sounds a bit like a bubble.
The S&P 500’s market cap now equals 28x real disposable personal income — a record.
The stock market Shiller PE ratio is at its highest in 20 years.
Nasdaq companies, especially the MAG7, are strongly outperforming small-cap companies. The last time this happened at this speed, we had the dot-com crash.
The top 10 stocks in the S&P 500 account for 40% of the index.
So, saying this, is the market going to crash?
I don't know, but I know that it's more likely to crash now than it was 3 months ago. It might continue running higher, too, as the FED is expected to cut rates. Really, no one knows. 😊
Here's what I'm doing:
I trimmed down some overpriced stocks from my portfolio: Lemonade, Coupang, Shopify, and Crowdstrike
I trimmed down some of my crypto, especially Bitcoin and Ethereum
I stopped DCA'ing into leveraged ETFs
I'm accumulating cash
I'm still investing (added more healthcare stocks to the portfolio)
Quick note: I'm just sharing my journey - not financial advice! 😊
Surely the RBA Must Cut Rates Now?The RBA defied expectations of a cut in July, despite soft trimmed mean inflation figures in the monthly CPI report. The quarterly figures have now dropped, which I suspect leaves little wriggle room to hold at 2.85% in August. I 6ake a look at the quarterly and monthly inflation prints that matter, then wrap up on AUD/USD.
Matt Simpson, Market Analyst at City Index and Forex.com

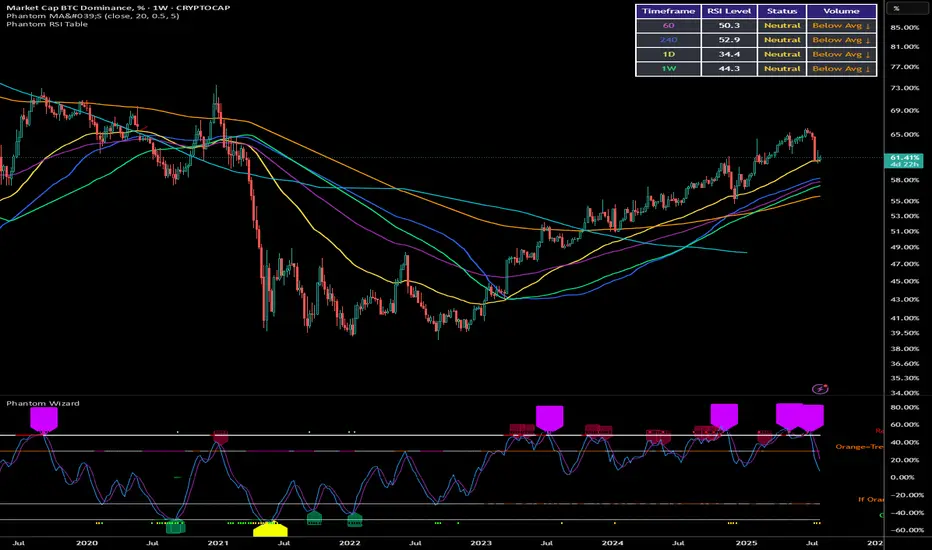
Bitcoin Dominance Analysis: Data-Driven Perspective Through 2025Current State of Bitcoin Dominance
As of the latest data point (July 2025), Bitcoin dominance stands at approximately 61.45%, showing a significant recovery from earlier periods. This represents Bitcoin's continued strong position as the dominant cryptocurrency in the market.
Key Trend Analysis
Long-Term Trend (2023-2025)
The data reveals a clear cyclical pattern in Bitcoin's market dominance:
Recovery Phase (Late 2023 - Early 2024): BTC.D increased from around 52% to approximately 64%, demonstrating a strong recovery in Bitcoin's market position.
Consolidation Period (Q1-Q2 2024): Dominance stabilized in the 63-65% range, indicating a period of relative stability in market composition.
Volatility Phase (Q2-Q3 2024): A notable decline occurred, with dominance dropping to approximately 60%, suggesting a period where altcoins gained market share.
Recent Strengthening (Q4 2024 - Q2 2025): BTC.D recovered and established a range between 64-66%, showing Bitcoin's resilience and continued market leadership.
Current Correction (Q2-Q3 2025): The most recent data shows a decline from the 65% peak to around 61%, indicating a potential shift in market dynamics.
Medium-Term Pattern (4-Hour and Daily Charts)
The 4-hour chart data reveals more granular movements:
Multiple instances of rapid 1-2% shifts in dominance over short periods
A pattern of higher lows from January to May 2025
A notable peak in dominance in mid-May 2025 (around 65.9%)
A subsequent correction through June-July 2025
Technical Indicators
Support and Resistance Levels
Major Resistance: 65.9-66.0% (tested in May 2025)
Current Support: 60.5-61.0% (tested multiple times in 2025)
Critical Level: 63.5% (acted as both support and resistance throughout 2024-2025)
Trend Structure
The data shows a series of higher lows from late 2023 through early 2025, followed by what appears to be a potential trend change in Q2 2025. The weekly chart demonstrates that despite short-term fluctuations, Bitcoin has maintained dominance above 60% for most of 2024-2025, significantly higher than the 40-50% range seen in earlier periods.
Market Cycle Analysis
The dominance data suggests we may be witnessing a shift in the typical Bitcoin-altcoin cycle:
Bitcoin's dominance typically rises during uncertain market conditions and early bull markets
Dominance tends to fall during the later stages of bull markets as capital rotates into altcoins
The current pattern (rising dominance followed by recent decline) may indicate we're in a transition phase where capital is beginning to explore higher-risk assets
Comparative Market Analysis
When examining Bitcoin dominance alongside the broader market:
Periods of declining dominance often coincide with increased altcoin market capitalization
The recent decline from 65% to 61% suggests approximately 4% of the total crypto market cap has shifted from Bitcoin to other cryptocurrencies
This rotation typically indicates increased market risk appetite
Forecast and Implications
Based purely on the data patterns observed:
Short-term (1-2 months): The current downtrend in dominance suggests continued pressure, potentially testing the 60% support level.
Medium-term (3-6 months): Historical patterns suggest a potential stabilization and bounce from major support levels, possibly returning to the 63-64% range.
Long-term considerations: The overall strength in Bitcoin dominance (maintaining levels above 60%) indicates Bitcoin remains the market's primary store of value and investment vehicle.
Conclusion
The Bitcoin dominance data presents a nuanced picture of the cryptocurrency market structure. While Bitcoin clearly maintains its position as the dominant cryptocurrency, the recent decline in dominance suggests a potential shift in market dynamics that bears watching.
The data does not support extreme narratives in either direction - neither an imminent "flipping" scenario where Bitcoin loses its dominant position, nor a scenario where Bitcoin completely reclaims its historical dominance highs above 70%.
Instead, the most data-supported conclusion is that we're witnessing normal cyclical behaviour within a market where Bitcoin maintains leadership but allows for periodic capital rotation into and out of alternative cryptocurrencies based on market conditions and investor risk appetite.
AUS200/ASX200 - ANOTHER OPPORTUNITY TO SHORT AUS200Team, today, good data came out from the AUS200
The market has given some steroids
Time to put an end to this
SHORTING AUS200 at 8761 toward 8772 with stop loss at 8810
Target 1 at 8732-8726 - take 50% volume and bring stop loss to BE
TARGET 2 at 8712-8696
ENJOY YOUR DAY!

Smart money concepts (SMC)1. Market Structure:
• Correctly detected a previous CHoCH and BOS, indicating a potential downward structural change.
• The resistance zone is marked; the price has reacted there several times, showing rejection.
2. Trend Line:
• The dynamic support (trend line) drawn. The ability to wait for a breakout with a possible pullback (retest) before continuing the decline is solid and reduces the risk of false entries.
3. Bearish Confluences:
• The presence of unmitigated FVG on higher timeframes reinforces the bearish projection.
• The entry coincides with the fake-out and resistance zones, which is typical of liquidity traps.
4. TP and SL:
• The target at 3.301–3.317 is realistic because it coincides with previous liquidity zones and the closing of inefficiencies.
• The SL is well-positioned, above the resistance and the wick of the last CHoCH, protecting against potential stop hunts.
5. Trade Management:
• Consider taking partial positions at 3.317 (first target) and letting the rest run to 3.301, securing profits and reducing exposure.
GOOD LUCK TRADERS….;)

NH SWING TRADE IDEA (2025-07-29)
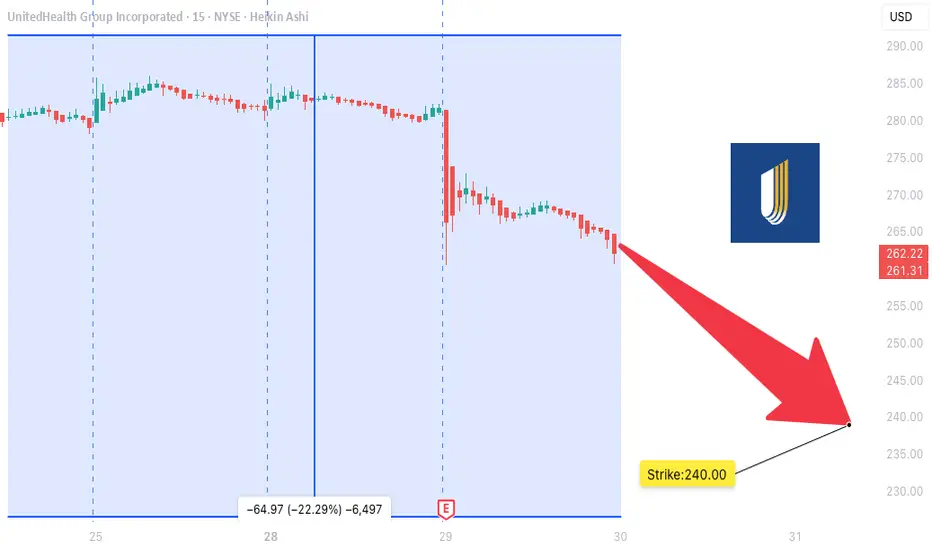
### 🩻 UNH SWING TRADE IDEA (2025-07-29)
**UnitedHealth Group – Bearish Setup**
📉 **Sentiment:** Moderately Bearish
📊 **Daily RSI:** 28.9 (Oversold!)
📉 **Momentum:** 5D/10D bearish
🔇 **Volume:** Weak (1.0x avg = low conviction)
💬 **Options Flow:** Neutral (C/P = 1.00)
🌬️ **VIX:** 15.71 — calm, tradable
---
### 🔻 Trade Setup
* **Play Type:** Naked PUT
* **Strike:** \$240.00
* **Expiry:** 2025-08-15
* **Entry:** \$0.85
* **Target:** \$1.35
* **Stop:** \$0.60
* **Risk Size:** 1 contract
* **Entry Timing:** Market Open
* **Confidence:** 75% 📉
---
### 🤖 Model Consensus (5 Models)
✅ All agree: **Bearish RSI + Downward Momentum**
⚠️ Disagree on *strength* of the trend: moderate vs strong
💡 Models: Claude, Grok, Gemini, LLaMA, DeepSeek
---
### ⚠️ Key Risks
* Neutral options flow = no crowd confirmation
* Weak volume = price may stall or fake out
* Watch for VIX spikes — could flip sentiment fast
---
### 🔎 Summary for Swing Traders
**UNH \$240P → \$0.85 → \$1.35**
🧠 RSI confirms downside
⛔ Low volume = trade light, manage risk
📅 Target expiry: Aug 15
🧲 Key level: \$247.13 — if broken, ride lower
MU WEEKLY TRADE IDEA (2025-07-29)
### 🚀 MU WEEKLY TRADE IDEA (2025-07-29)
**Micron Technology (MU) – Bullish Call Play**
🔹 **Sentiment:** Moderate Bullish
🔹 **C/P Ratio:** 2.91 (Bullish Flow)
🔹 **RSI (Weekly):** 53.6 📈
🔹 **Volume:** Weak (⚠️ caution — low conviction)
---
### 🎯 Trade Setup
* **Strike:** \$116.00
* **Type:** CALL (LONG)
* **Expiry:** 2025-08-01
* **Entry:** \$0.62
* **Target:** \$0.89
* **Stop:** \$0.31
* **Risk:** 2–4% of account
* **Confidence:** 65% 🧠
* **Entry Timing:** Market Open
---
### 🤖 Multi-Model Consensus
5 AI Engines Agree:
✅ Buy \$114–\$116 Calls
🧠 Models: Grok, Gemini, Claude, Llama, DeepSeek
📉 Main Risk: Weak volume divergence despite strong options flow
---
### ⚠️ Key Notes
* 📊 Institutional call buying ✅
* ⚠️ Low volume = reduced confirmation
* 🎯 Play is short-dated — gamma spikes expected
* 💥 Manage exits actively near target zones
---
### 🧠 Quick Recap (for speed-readers)
**MU 116C ➜ \$0.62 → \$0.89**
💥 Weekly flow supports upside
⚠️ Volume = weak, but RSI rising
⏱️ Hold short-term with stops

HIMS WEEKLY TRADE IDEA (7/29/25)*
**💊 HIMS WEEKLY TRADE IDEA (7/29/25)**
**🔥 Bullish Flow + Rising RSI + Institutional Volume**
**📈 Trade Setup**
• **Stock**: \ NYSE:HIMS
• **Direction**: CALL (LONG)
• **Strike**: \$64.00
• **Entry**: \$0.92
• **Target**: \$1.38
• **Stop**: \$0.46
• **Size**: 2 contracts
• **Expiry**: Aug 1, 2025 (3DTE)
• **Confidence**: 80%
• **Entry Timing**: Market Open
---
**🧠 Why This Trade?**
✅ **Call/Put Ratio = 1.37** → Bullish sentiment
✅ **RSI Daily: 65.2 / Weekly: 61.3** → Momentum building
✅ **1.8x Weekly Volume Surge** → Institutional accumulation
✅ **\$64C OI = 2,616** → High liquidity + interest
⚠️ **Gamma Risk + Fast Decay** → Time-sensitive play
---
**🎯 Strategy**
→ Play the momentum spike into expiry
→ Exit quickly on profit target or 50% stop
**#OptionsTrading #HIMS #SwingTrade #EarningsPlay #TradingViewSetup #FlowTrade**

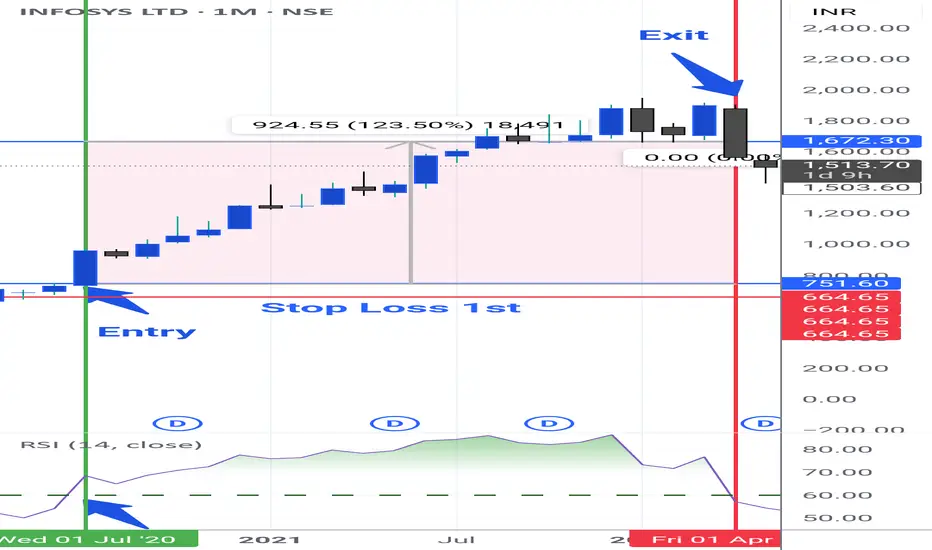
Swing & Positional Trading and Stock Options Setup _ High Beta✅ Final Setup for Positional and Swing Trades (High Beta Liquid Stocks for Cash and Options)
This trading guide outlines a simple and effective setup for both positional and swing trades, focused on high beta, highly liquid stocks. Follow the rules strictly for better consistency and profitability.
🔹 Positional Trade Setup
Chart Setup:
• Open the Monthly Chart of the stock.
• Add the RSI (Relative Strength Index) indicator.
• Uncheck all levels (30, 50, 70) and only keep one level at 60.
• Edit the level from 70 to 60 and highlight it in green.
Entry Criteria:
• Stock must cross the 60 RSI level on the monthly chart.
• Entry is only triggered if the price breaks the previous month's high.
Stop Loss:
• Place the initial stop loss below the previous month's low.
Trailing Stop Loss:
• Trail the stop loss to the current month’s low, but only after the monthly candle closes.
• Continue trailing the stop loss every month using this method until exit.
Exit Rule:
• Exit the positional trade only if the current month’s candle closes below the previous month’s low.
⚡ Note: The RSI 60+ setup is a powerful momentum strategy with high reward probability.
🔹 Swing Trade Setup
Precondition:
• Monthly RSI must cross above the 60 level.
• Switch to the Daily Chart of the stock.
• Entry Criteria:
• Identify the current swing high on the daily chart.
• Entry is triggered only when the stock breaks the swing high.
Stop Loss:
• Place the stop loss below the current swing low.
• If unsure how to mark swing low, then use a daily close below RSI 60 as your stop.
Trailing Stop Loss:
• If the trade moves in your favor, trail the stop loss to each day’s low.
Exit Rule:
• Exit the swing trade only if RSI crosses back below 60 with a daily candle close.
🔥 Stock Options Trading Strategy – Built on Core Swing/Positional Principles (75% Win Rate Setup)
I’m now sharing a Stock Options Trading Concept that follows the same core principles but is tailored specifically for liquid stock options.
For this strategy, you will strictly focus only on those High Beta Liquid Stocks provided below-
✅ Strategy Setup
🔹 Timeframe Filters:
• Monthly RSI > 60 (RSI has crossed and is holding above 60)
• Weekly RSI > 60 (same condition as above)
• Daily RSI: RSI must be crossing 60 or on the verge of crossing
Now, on the Daily Chart, mark the current swing high and swing low.
📌 Two Entry Approaches:
Approach 1: Breakout Entry
• Entry: When swing high is broken.
• Stop Loss (SL): Swing low or previous week’s low.
Approach 2: Pullback Entry
• Wait for a retracement from swing high (should not exceed 50% retracement).
• Confirmation of pullback weakness: Volume bars should be shrinking/decreasing.
• Entry: On breakout of the last candle high of the pullback.
• Stop Loss: Swing low or previous week’s low.
Once in the trade, trail your stop loss to cost after 3 consecutive bullish candles.
📤 Exit Rules
• Exit the Stock Options position only if the Daily RSI closses below 60 level.
⚠️ Important Guidelines for Stock Options
• 💡 Trade with only 1 lot. Never exceed your lot size.
• 📅 Enter after 2 days of the monthly expiry and exit before 2 days of next monthly expiry to avoid smart money manipulation.
• 🎯 Choose strike prices in multiples of 25, 50, 75, or 100 for better liquidity.
Example: If stock is at 1564, choose 1550 ITM or 1575 ATM.
• ⏱️ For quick exits, always place exit orders at round numbers like 5 or 10 levels.
• Example: If you entered at ₹70 and the option is at ₹144, place an exit at ₹140 or ₹145—not any random price.
For PE buying-
Monthly RSI < 40
Weekly RSI < 40
Daily RSi crossing 40 or below
Same process for PE with 2 approach as you like but in reverse form.
📊 75 High-Beta, Highly Liquid NSE Stocks
These stocks are liquid, fundamentally strong, and mostly traded in the F&O segment — giving you both flexibility and depth.
🚗 Auto
• Bajaj Auto
• Bosch Ltd
• Eicher Motors
• Hero Motocorp
• Maruti Suzuki
• TVS Motors
• Tata Motors
🏦 Banking & Financial Services
• Bank of Baroda
• Kotak Mahindra Bank
• Axis Bank
• ICICI Bank
• HDFC Bank
• IndusInd Bank
• Bajaj Finserv
• Bajaj Finance
• SBI
🧪 Chemicals
• Aarti Industries
• Atul Ltd
• Navin Fluorine
• UPL
• Tata Chemicals
🍫 FMCG
• Britannia Industries
• Godrej Consumer
• Tata Consumer
• DMart
• Hindustan Unilever
• Dabur
💊 Pharma & Healthcare
• Apollo Hospitals
• Alkem Labs
• Biocon
• Divis Labs
• Dr. Reddy’s
• IPCA Labs
• Laurus Labs
• Lupin
• Aurobindo Pharma
• Sun Pharma
• Cipla
💻 IT Sector
• HCL Technologies
• Infosys
• LTIMindtree
• TCS
• Tech Mahindra
• Wipro
⛓️ Steel & Metals
• APL Apollo Tubes
• JSW Steel
• Jindal Steel
• Tata Steel
• Hindalco
• L&T
🛢️ Oil & Gas
• Reliance Industries
• Gujarat Gas
• Indraprastha Gas (IGL)
• Mahanagar Gas (MGL)
• Tata Power
🏢 Realty
• DLF Ltd
• Godrej Properties
• Lodha (Macrotech Developers)
• Oberoi Realty
• Phoenix Mills
🛋️ Durables & Others
• Sona BLW (Sona Comstar)
• Amber Enterprises
• Bata India
• Crompton Greaves
• Dixon Technologies
• Titan Company
• ACC Cement
• Ambuja Cement
• Ultratech Cement
• Voltas Ltd
• Polycab India
• Mazagon Dock (Mazdock)
• Asian Paints
• Berger Paints
📝 Final Thoughts
This is not just a strategy — it’s a framework to reprogram your trading mindset. Use higher timeframes, respect structure, and focus only on high-probability setups. You’re not here for noise. You’re here for moves that matter.
If this helped you, prepare a trading journal based on this strategy. Stay focused. Be consistent. Trade less, but trade right.
Midcap and Small cap stocks are only used for Positional Trading Long Setup for longer periods ex 6 months to a year.
Daily Analysis- XAUUSD (Wednesday, 30th July 2025)Bias: Bullish
USD News(Red Folder):
-ADP Non-Farm Employment Change
-Advance GDP q/q
-Federal Funds Rate
-FOMC Statement
-FOMC Press Conference
Notes:
- Bullish closure after daily liquidity sweep
- Looking for price to respect 0.618 fib level
- Potential BUY if there's
confirmation on lower timeframe
- Pivot point: -
Disclaimer:
This analysis is from a personal point of view, always conduct on your own research before making any trading decisions as the analysis do not guarantee complete accuracy.

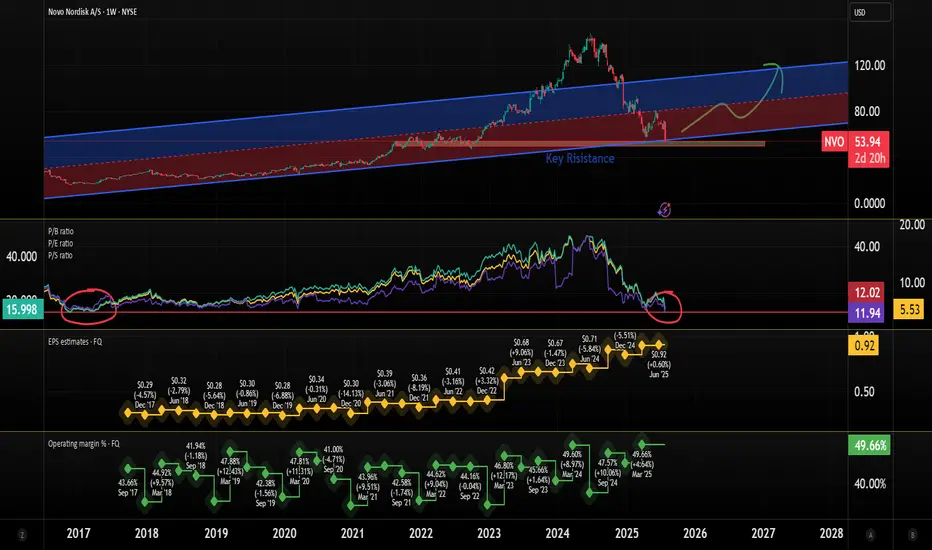
Is Novo Nordisk a buy? Novo Nordisk $NYSE: NVO plummets 22% on July 29, wiping out $57.5B in market value!
Here's what's happening and how I see it.
Here’s the breakdown on why the stock hit its lowest since Nov 2022:
Slashed 2025 Guidance: Sales growth cut to 8–14% from 13–21%, operating profit to 10–16% from 16–24%. Weak U.S. demand for Wegovy & Ozempic, plus competition from cheaper compounded GLP-1 drugs (i.e. grey market), cited as key issues.
CEO Shake-Up: Lars Fruergaard Jørgensen out, Maziar Doustdar in as CEO effective Aug 7. Investors worry Doustdar’s limited U.S. experience could hurt Novo’s edge in its biggest market (57% of sales).
Competition: Eli Lilly’s Zepbound (20.2% weight loss vs. Wegovy’s 13.7%) & Mounjaro are stealing market share. Compounded GLP-1s from Hims & Hers add pricing pressure.
Here's what I see:
There's a strong bearish sentiment, but the stock is very underpriced.
Considering the current stock price, EPS is at an all-time high. This means investors get more earnings for their stock.
P/B, P/E, and P/S ratios are at the lowest level since 2017! This is despite revenue growth of 25%+ for 3 consecutive years.
Operating margins are still quite healthy.
The company still has a very significant share (over 50%) of the GLP1 drugs worldwide.
The valuation of this company is now at the best level of the last 7-8 years.
There might be more volatility ahead, but I see the recent price drop as an opportunity to buy a pharma giant at a big discount, giving investors a margin of safety.
Quick note: I'm just sharing my journey - not financial advice! 😊
Potential transitionThe S&P 500 daily chart has gotten down to levels that buyers have entered this market previously. This means be cautious on the short side and be aware of the fundamentals that will be released on Wednesday.

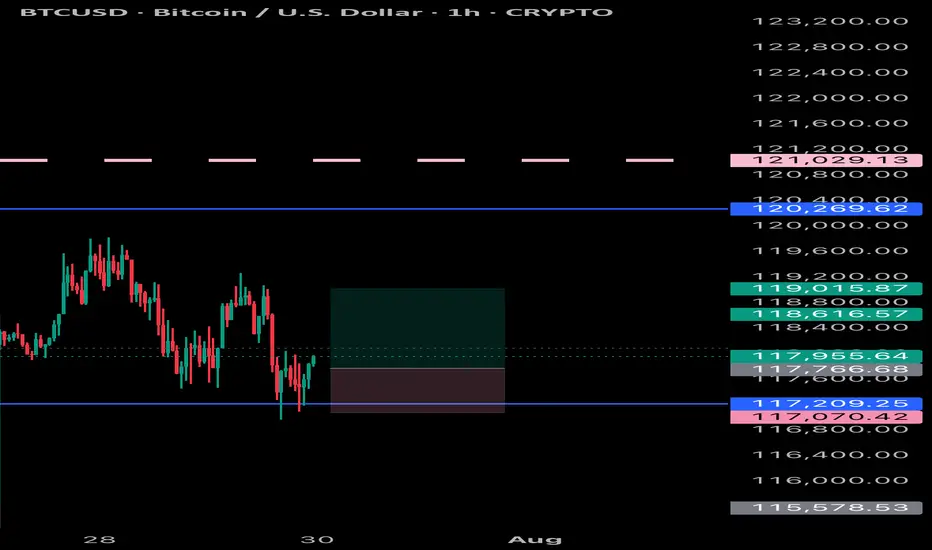
BITCOIN BULLYING Bitcoin hit take profit previously and now I will be looking at another buy within this trend and price action combined with patterns
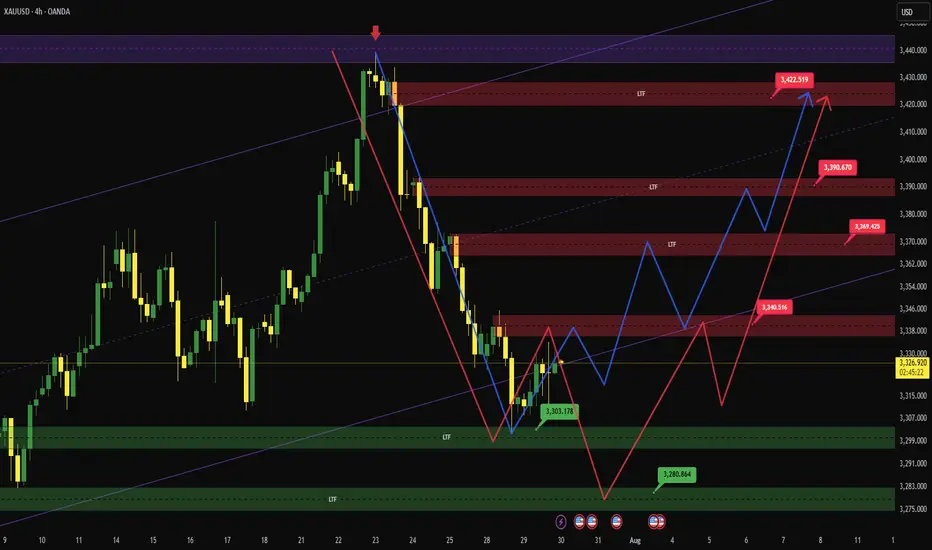
XauUsdThere are two analyses.
As you can see, the overall trend is bullish and long positions have more chances, the important market points are drawn accurately and have high validity.
The red arrow has a 60% chance of occurring and the blue arrow has a 40% chance.
Important market points:
Resistance:
3340
3369
3390
3422
Support:
3303
3280
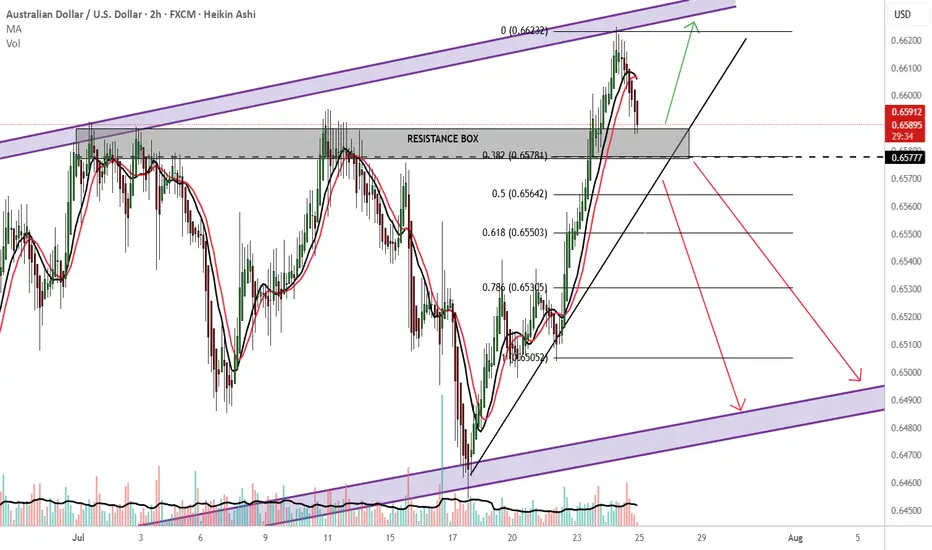
AUDUSD Still early days
20% in me:
Unless strong bullish fundamentals present themselves or the big boys with the big bucks drive a bullish push anywhere from 0.65784 or resistance, I would be looking to sell.
Buy outside the resistance box
TP:0.66600 new immediate high?
Please also consider price action as there are 2 previous rejections in the 0.65784 price area.
80% in me:
-Australia is heavily tied to China via exports
RBA rate cuts?
Falling iron ore prices...
-Perfect price action channel trade. SELL at resistance BUY at support. Bullish long term, bearish short term.
-fib 0.382 downward continuation and close below 0.65784
-Looking for a break below the upward sloping trendline HARD sell
-safer option: wait for a 0.65780 retest, below the upward sloping trendline sells and make bank.
TP: 0.6500
THOUGHTS?
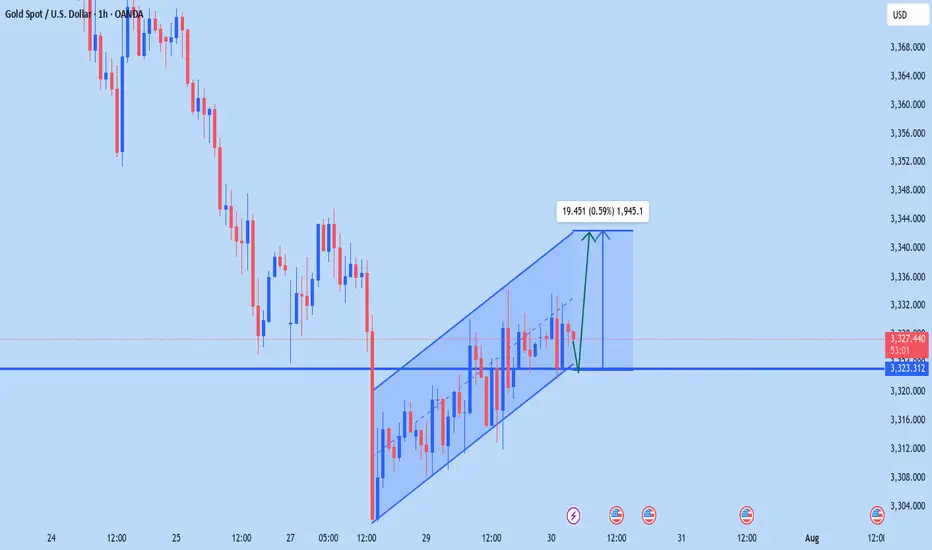
7/30: Watch for Sell Opportunities in the 3352–3363 ZoneGood morning, everyone!
After a period of consolidation and decline, gold has found preliminary support near the 3300 level, and early signs of a bottom formation are emerging. The key technical level now lies around the 3332–3337 resistance zone. Based on current price structure, a breakout is likely, with major resistance seen at 3352–3358, while 3323–3316 serves as the primary support range.
However, caution is warranted as today’s ADP employment data may significantly influence short-term price action. Whether gold can hold above the 3337–3343 level depends on the data's impact.
From a broader perspective:
On the weekly chart, the 20-period moving average (MA20) has climbed to around 3276, yet the overall structure remains bearish for bulls
On the daily chart, gold is still trading below the MA60, facing notable resistance
This week's key events — ADP (Wednesday), jobless claims, and NFP (Thursday and Friday) — will likely shape gold’s medium-term trend
Trading Strategy for Today:
Focus on the 3313–3353 trading range, and be highly responsive to data-driven volatility.
Important note: If gold rises to 3343–3358 before the ADP release, then regardless of whether the data is bullish or bearish, the preferred approach is to sell into strength, as a post-data pullback is a likely scenario.

New Highs Will Be DelayedThis is how it's going to be. You can disagree and be against it all you want, but much more consolidation in price will occur first over the long term, before a proper bull run returns.

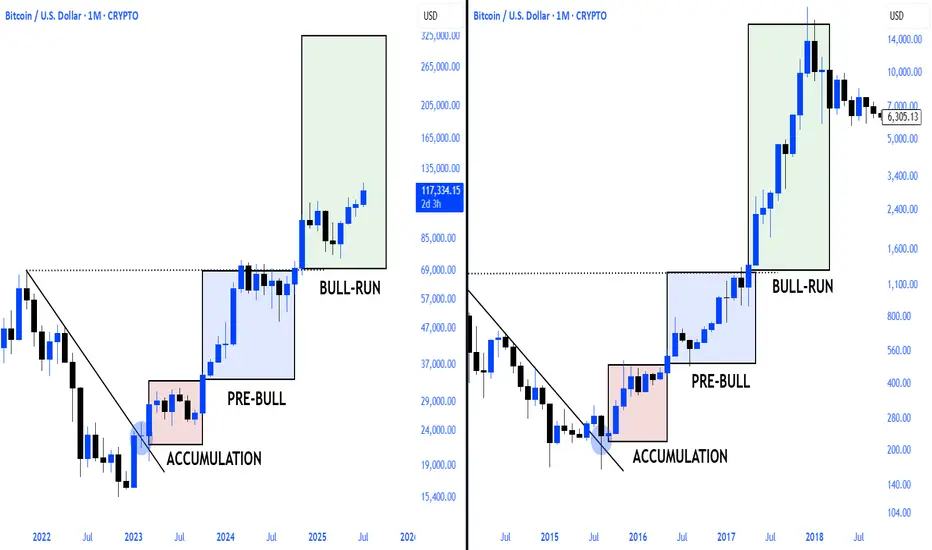
$BTC 2013\2017 vs. 2021\2025bitcoin is exactly repeating the reflection of the 2013-2017 period
zoom out!
WING Earnings Play (2025-07-29)
**🍗 WING Earnings Play (2025-07-29)**
**🔥 Oversold Setup + 88% Beat Rate = Opportunity**
**🎯 Trade Plan**
• **Stock**: \ NASDAQ:WING
• **Type**: Call Option (LONG)
• **Strike**: \$290
• **Entry**: \$19.20
• **Target**: \$38.40
• **Stop**: \$9.60
• **Expiry**: Aug 15, 2025
• **Entry Time**: Before earnings (AMC 7/30)
• **Confidence**: 72%
• **Expected Move**: ±5%
• **IV Rank**: 75 (Elevated)
**📊 Why WING?**
✅ **RSI = 19** (deeply oversold)
✅ 88% earnings **beat rate** (last 8 Qs)
✅ 17.4% **YoY rev growth**
✅ Volume up 1.28x avg
📈 Setup for **volatility crush + upside surprise**
**⚠️ Risk/Reward = 2:1+**
Cut below 50% premium loss. Target double on upside earnings breakout.

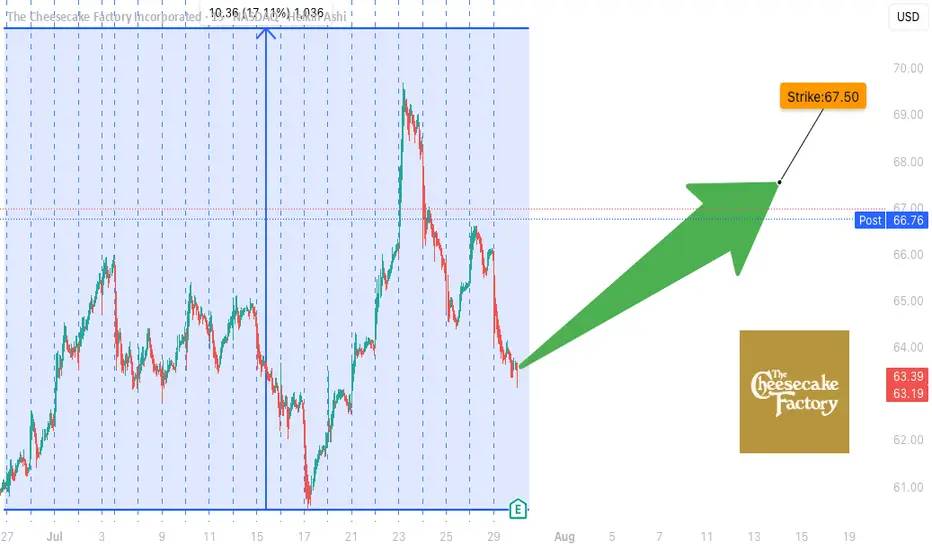
CAKE Earnings Trade Setup (2025-07-29)
**🍰 CAKE Earnings Trade Setup (2025-07-29)**
🎯 **Bullish Bias** | Confidence: **72%**
💡 **Historical Beat Rate: 88%** | Strong pre-earnings drift
**📊 TRADE DETAILS**
• **Instrument**: \ NASDAQ:CAKE
• **Strategy**: Buy CALL
• **Strike**: 67.50
• **Entry**: \$1.45
• **Target**: \$2.90+
• **Stop**: \$0.72
• **Expiry**: 2025-08-15
• **Timing**: Pre-earnings close (AMC)
**📈 Setup Rationale:**
✅ History of positive earnings surprises
✅ Stock above key MAs with room to run
⚠️ Margin pressure & mixed options flow = manage risk closely
**🔥 Risk/Reward: \~2:1+**
Cut early if earnings miss. Target 200%+ return on surprise beat.
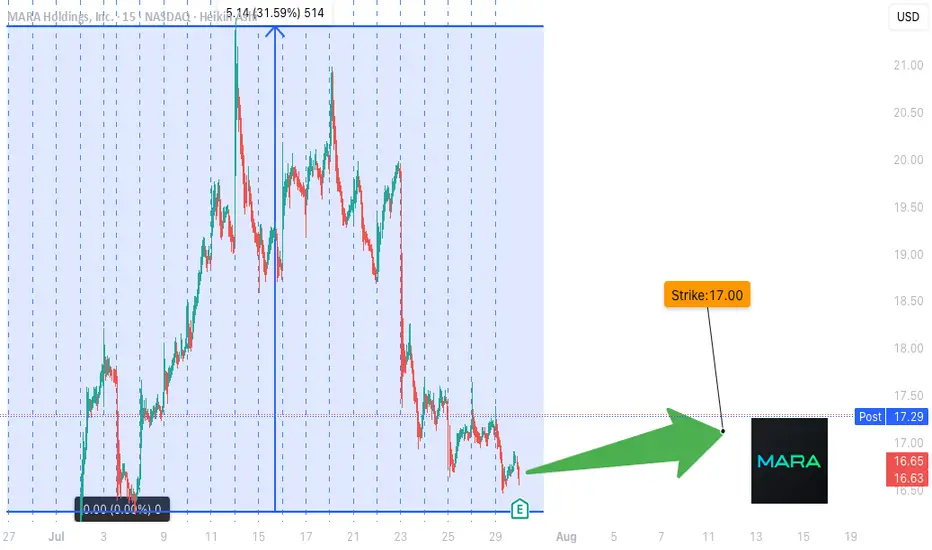
**MARA Earnings Setup – TradingView Breakdown**
🚨 **MARA Earnings Setup – TradingView Breakdown** 🚨
📅 *Earnings Play for 07/29/2025*
🎯 *Strike: \$17.00 Call | Exp: 08/01/2025*
💰 *Premium: \$0.59 | Target: \$1.18*
📈 *Conviction: 75% Bullish*
🔹
---
🧠 **What’s the Setup?**
MARA just raised \$950M to expand BTC holdings 💥
Revenue YoY growth: **+29.5%** 📊
Margins still rough: **-46.7% profit**, but potential catalyst is 🔥 if BTC pumps.
---
🧨 **Options Flow Is Heating Up**
👀 Massive open interest on **\$17 Calls**
🤏 Put/Call Skew slightly bullish
🧮 IV low despite high beta (6.55) = **cheap volatility play**
---
📉 **Oversold + Coiled Tight**
📉 RSI: 38.57 (Oversold)
📍 Support: \$16.50 | Resistance: \$17.50
💣 Sitting at key technical inflection pre-earnings.
---
🔮 **Trade Idea**
🎯 *Buy \$17C @ \$0.59*
🚀 Target: \$1.18 (2x gain)
🛑 Stop: \$0.30
📆 Exit within 2 hrs post-ER to avoid IV crush
---
📊 **Risk/Reward**
💰 Max Loss: \$59
📈 Potential Gain: \$118
⚖️ R\:R = 2:1
---
🔥 **Why It Could Go Viral**
✅ Bitcoin bullish narrative
✅ High beta + cheap IV = explosive setup
✅ Oversold technicals + earnings catalyst
---
🔁 **Like & Save this if you're playing MARA ER 🔥**
\#MARA #EarningsPlay #OptionsTrading #BitcoinStocks #TradingView #ShortSqueeze #CallOptions #HighBetaSetup #CryptoStocks #EarningsSeason #MARAAnalysis #TradingStrategy #Fintok #Finfluencer