INTC: Intel turnaround will take timeAs we have Intel earnings report released on Thursday, it miss on on EPS, but beat on revenue.
as Intel lag the industry, we still waiting some confirmations of positive turnaround, once we get it, we may get it long from this competitive level since P/B below $1.
Disclaimer: This content is NOT a financial advise, it is for educational purpose only.
Fundamental Analysis

Report - 29 jully, 2025Summary
Initial optimism following the historic US–EU trade agreement has swiftly eroded as France and Germany openly criticized the deal, warning it undermines EU sovereignty and economic stability. The euro fell sharply, carmakers led equity declines, and political fractures within the bloc widened. While the deal averted a full-blown trade war, concerns over inflation, competitiveness, and regulatory submission have shifted sentiment. The perception of European capitulation under pressure from Trump has reignited transatlantic tensions and injected fresh volatility into global markets.
This retreat in EU support underscores the precarious nature of transatlantic cooperation under Trump’s economic nationalism. Meanwhile, signs of tech decoupling, tariff expansion beyond the EU, and deferred retaliation signal a fractured global trade order. European fiscal policy, particularly Germany’s defense-driven deficit expansion, is now under heightened scrutiny amid market volatility and FX pressure.
Market Reactions
Equity markets across the EU opened higher on tariff relief expectations but reversed course as Germany’s Chancellor Merz and France’s Prime Minister Bayrou denounced the deal. The DAX fell 1.1%, CAC 40 slipped 0.4%, and eurozone auto stocks plunged 1.8%. The euro lost over 1% against the dollar in its second-largest daily drop this year, reflecting concern over structural imbalance and political subordination.
In contrast, semiconductor stocks surged, with ASML and BE Semiconductor rising over 4% as the tech sector escaped tariffs. Wall Street remained relatively stable, buoyed by optimism around defense, energy, and tech sectors gaining from the deal. The dollar index (DXY) rose 0.9%, reflecting both euro weakness and expectations that inflationary tariffs could keep Fed rates elevated.
Fiscal and Political Implications
The backlash from Berlin and Paris lays bare deep fractures within the EU regarding its posture toward Washington. Chancellor Merz’s warning of "considerable damage" and Bayrou’s reference to EU “submission” cast doubt on Ursula von der Leyen’s negotiation strategy. The deal’s imposition of a 15% baseline tariff—triple the pre-deal weighted average—exposes Europe to substantial cost increases without achieving reciprocal liberalization.
Internally, the European Commission is accused of caving to U.S. pressure while undermining its own credibility. Documents and diplomatic leaks suggest that more aggressive retaliatory planning was watered down due to fears of a broader security rupture, particularly concerning NATO and U.S. arms support to Ukraine. This reinforces the EU’s strategic dependency, limiting its ability to resist U.S. economic coercion.
Germany’s effort to shield its auto industry via offset schemes largely failed, while Brussels’ “trade bazooka” was shelved in favor of “strategic patience.” This perceived capitulation may embolden further unilateral action from the U.S., especially as Trump eyes tariffs on pharmaceuticals and rest-of-world imports up to 20%.
Strategic Forecasts
Europe's short-term economic outlook has darkened. The tariff burden—especially on high-margin exporters like German autos—raises inflation risks while lowering competitiveness. Political backlash could destabilize Commission leadership and provoke calls for more aggressive economic sovereignty.
Expect further euro weakness, sectoral underperformance in autos and industrials, and possibly downgrades to GDP forecasts across the eurozone. On the U.S. side, Trump’s success with transatlantic leverage may embolden him to expand tariff threats to Asia and Latin America. The Fed will likely face a more inflationary policy environment, with fiscal and protectionist stimulus prolonging higher rate expectations.
Simultaneously, China's relief from U.S. tech export freezes—designed to secure a Xi-Trump summit—adds complexity to the strategic tech rivalry. The suspension of chip export controls could spur near-term capital inflows to Chinese AI firms while igniting concern in U.S. defense circles.
Risks and Opportunities
Risks
Breakdown in EU cohesion and trust in Commission leadership
Expansion of U.S. tariffs to rest of world (ROW), escalating global trade friction
Retaliation by China if U.S. chip diplomacy reverses
Drag on European industrial profits and inflation-driven ECB recalibration
Fed rate path upwardly skewed due to structural tariff-driven inflation
Opportunities
U.S. defense and energy sectors benefit from guaranteed EU purchases
Semiconductors remain shielded, with valuation support in ASML, TSMC, Nvidia
Dollar strength provides tactical trades in EURUSD, GBPUSD
Select EM exporters (e.g. Brazil) benefit from re-diversified trade flows
AI hardware and chip infrastructure (Samsung–Tesla deal) gains strategic momentum
Key Asset Impact – Outlook
XAUUSD (Gold):
Gold holding firm around $3,340. With fresh political discord and rising protectionist inflation, gold remains a hedge. If Fed signals rate hold, expect a push to $3,400.
Bias: Bullish
S&P 500:
Resilient, driven by defense, energy, and AI. But prolonged strong dollar and tariff-induced input cost pressures are risk factors.
Bias: Moderately Bullish
Dow Jones:
Benefiting from defense and dividend-heavy mix, but under pressure from industrial drag.
Bias: Neutral to Bullish
DXY (US Dollar Index):
Strengthening on euro weakness and policy divergence. However, long-term Fed autonomy concerns and political volatility could reverse trend.
Bias: Bullish short-term, Neutral longer-term
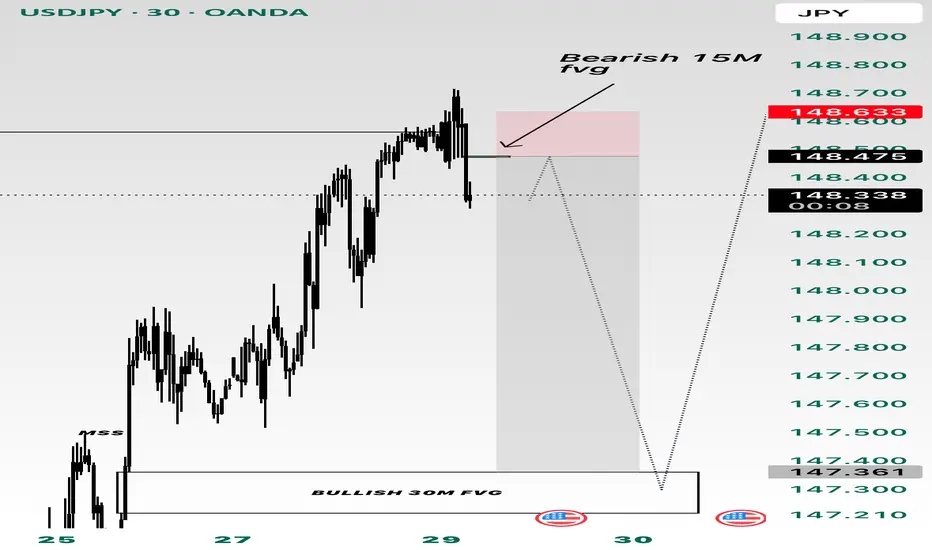
USDJPY:
Little movement today. BoJ still cautious, yen capped unless Fed shifts dovish or global risk-off resumes.
Bias: Range-bound
EURUSD:
Second-largest single-day drop YTD. Political backlash and export headwinds limit upside.
Bias: Bearish
Crude Oil (WTI):
Flat to slightly higher, supported by EU commitment to U.S. energy, but demand data remains soft.
Bias: Neutral
Stoxx Autos:
Heavy selloff (-1.8%) despite tariff reduction, reflecting margin pressure.
Bias: Bearish
ASML / BE Semiconductor:
Relief rally on tariff exclusion. Long-term tailwinds from open AI infrastructure and Samsung–Tesla chip deal.
Bias: Bullish
USDJPY USDJPY has reached liquidity level on the higher timeframe. A bearish 15M FVG has formed and I’m going to short to the 30/1H FVG gap. And then look for long positions
YOU ARE NOT BULLISH ENOUGH ON ETHEREUM! ethereum linear chart 3m timeframe major resistance level breakout occurred. if it continues to maintain the current area in the coming period, the major will continue to rise

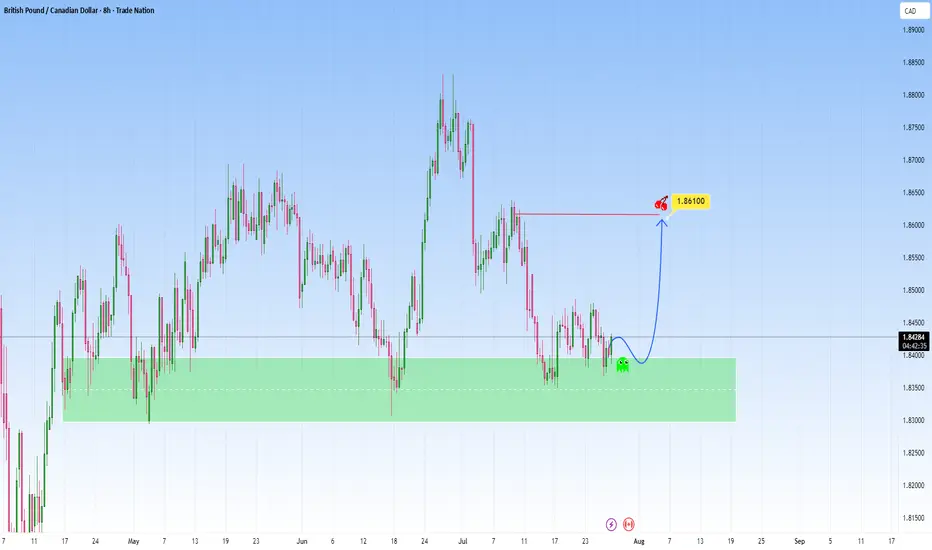
GBPCAD At Support - High probability reversalGBPCAD descended with strength, and has now reached a strong support zone.
Price now hovers above and this zone and is a great indication to use for possible reversal move, that could send price into the 1.86100 level.
But if price breaks below support with momentum, then I’ll back off this bullish bias and reassess, and consider the reversal idea invalidated, with potential for further downside.
Just sharing my thoughts for the charts, this isn’t financial advice. Always confirm your setups and manage your risk properly.
Disclosure: I am part of Trade Nation's Influencer program and receive a monthly fee for using their TradingView charts in my analysis.
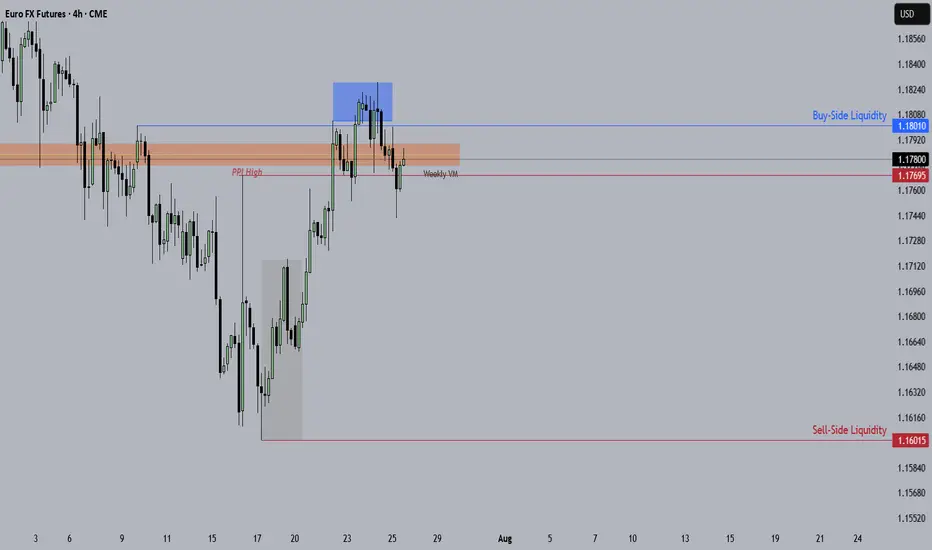
Euro Futures Idea.From HTF direction to LTF direction, this is my Trade Idea for the week of 28 July - 1 Aug.
Key Things in this trade idea, HTF PDAs, Liquidity of news high and daily swing and MMSM going on.
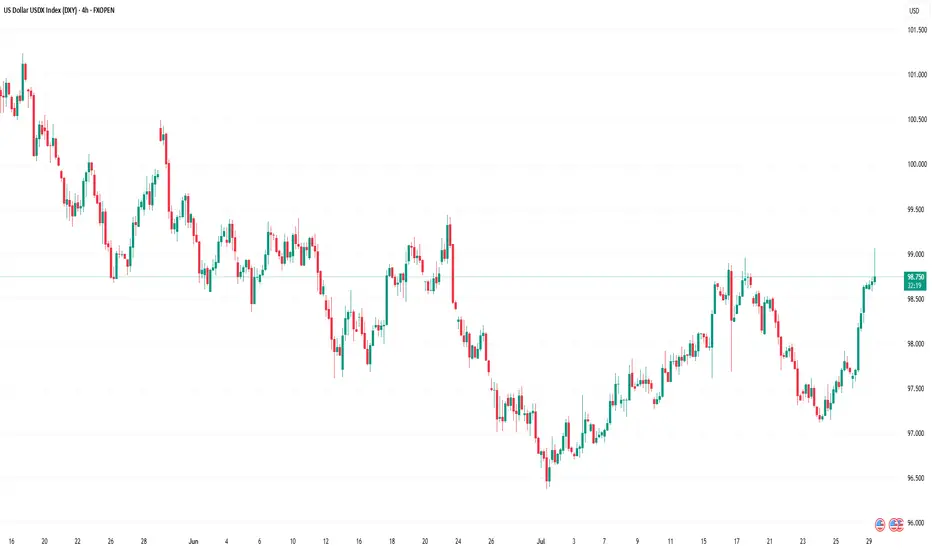
US Dollar Index (DXY) Reaches One-Month HighUS Dollar Index (DXY) Reaches One-Month High
The US Dollar Index (DXY) has risen to its highest level since early July. According to media reports, the bullish sentiment in the market is driven by the following factors:
→ Optimism around US trade agreements. A new trade deal with the EU — which includes a 15% tariff on European goods — is being perceived by the market as favourable for the United States.
→ Confidence in the resilience of the US economy. Strong Q2 corporate earnings have acted as an additional bullish catalyst. Investors may have started covering short positions against the dollar, viewing concerns over a US slowdown as overstated.
→ Expectations that the Federal Reserve will keep interest rates on hold.
From a technical standpoint, today’s DXY chart reflects strengthening bullish momentum.
Technical Analysis of the DXY Chart
Two U-shaped formations (A and B) that developed over the summer have created a bullish сup and рandle pattern — a formation that suggests waning bearish pressure, as evidenced by the shallower second dip.
This setup points to the potential for a bullish breakout above the trendline (marked in red) that has defined the downward movement in the DXY throughout the first half of 2025.
As previously analysed, there are signs that the dollar index may have found a base following a period of decline. This could indicate a shift in market sentiment and the possible end of the recent bearish phase.
This article represents the opinion of the Companies operating under the FXOpen brand only. It is not to be construed as an offer, solicitation, or recommendation with respect to products and services provided by the Companies operating under the FXOpen brand, nor is it to be considered financial advice.
DCF VALUATION ANALYSIS OF BSEConclusion: OVERVALUED
:-OVERVIEW
BSE Limited has shown strong financial growth in recent years. Its revenue jumped from ₹924.84 crore in FY23 to ₹1,592.50 crore in FY24 (a 72% increase), and further surged to ₹3,212 crore in FY25, doubling year-on-year. EBITDA grew impressively to ₹1,779 crore in FY25 with a 60% increase, and EBIT reached ₹1,670 crore, up 56%. Net profit also rose significantly to ₹1,112 crore, with earnings per share increasing to ₹81. Dividend per share improved to ₹23, reflecting healthy returns
DCF:
-The valuation was performed using a Discounted Cash Flow (DCF) approach based purely on verified financial data and market risk parameters without relying on user-specific growth assumptions.
-The cost of equity was calculated using an adjusted risk-free rate plus equity risk premium multiplied by beta, resulting in a discount rate of approximately 13.58%. The terminal growth rate was conservatively taken as 4%. Using these reliable inputs and actual EBIT cash flows, the intrinsic enterprise value was estimated at around ₹36,839 crore, translating to an intrinsic value per share of approximately ₹1,364.
-Currently, BSE’s market price is around ₹2,480 per share, which is substantially higher than the intrinsic value derived from fundamentals, indicating the stock is trading at a significant premium. This valuation is grounded in audited company financials and globally accepted valuation methodologies, providing a trustworthy reference point for investors.

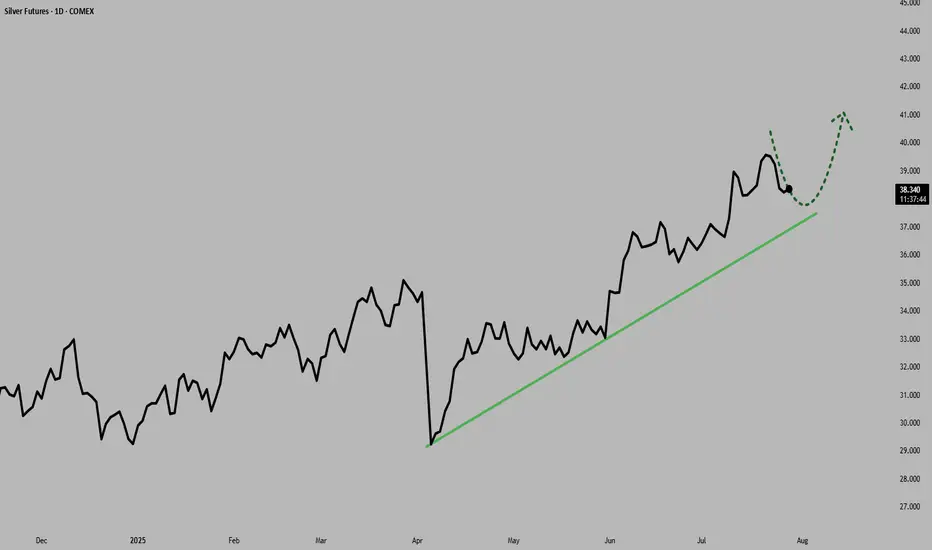
Silver Near $40: Deficits and Demand Fuel the RallySilver prices surged to multi-year highs in July 2025, driven by an extraordinary convergence of bullish factors, pushing prices above $39 per ounce, levels last seen in 2011.
Silver’s rally, supported by robust industrial demand and safe-haven inflows, aligns with traditional patterns as the U.S. dollar has weakened over 2.3% over the recent period.
Macroeconomic Drivers and the U.S. Dollar
Silver's rally is unfolding around shifting macro conditions. The Federal Reserve has kept interest rates at a restrictive 4.25-4.50% throughout 2025 due to persistently high inflation (2.7% YoY). However, expectations for more rate cuts are growing, with the CME FedWatch tool showing a 59.8% probability of a cut at the September meeting as of July 28.
Adding to the complexity, U.S. trade policies have triggered significant market volatility and raised concerns over a potential supply shock. The U.S. administration has imposed steep 30% tariffs on imports from Mexico, set to resume on August 1. This has heightened fears, as Mexico is the world’s largest silver producer and supplies over half of U.S. silver imports.
But macro drivers aren’t the full story. The real force behind silver’s rally lies in the physical market itself. A structural supply deficit, escalating industrial demand, and growing investor appetite from Asia and North America, are proving to be far more pivotal than shifting rates or a softer dollar.
Physical Market Dislocation and Industrial Demand
The year 2025 marks the fifth consecutive year of a structural deficit in the global silver market, and the imbalance between supply and demand shows no sign of easing.
With minimal new mining capacity expected to come online and lengthy lead times for project development, supply constraints are structural rather than temporary.
Since 2021, the cumulative shortfall has reached nearly 800 million ounces (25,000 tons), steadily drawing down available inventories and tightening the market.
Industrial demand remains the central pillar of silver’s bull market. Forecasts for 2025 project record consumption of roughly 700 million ounces, driven by rapid adoption in green technologies and digital infrastructure. The electrical and electronics sector, which includes solar photovoltaics (PV), consumer electronics, automotive electronics, power grids, and 5G networks, has increased its silver usage by 51% since 2016.
Solar PV alone consumed approximately 197.6 million ounces in 2024, a record largely driven by China’s 45% expansion in solar capacity. With global EV production expected to approach 20 million units in 2025, automotive silver demand alone could exceed 90 million ounces.
Together, persistent deficits, accelerating industrial consumption, and capital flowing into physically backed investment vehicles are creating a market where available silver is increasingly scarce, amplifying upside pressure on prices regardless of short-term macroeconomic shifts.
COMEX silver inventories peaked at 504.72 million ounces on May 11 but have since eased back to levels last seen on April 24, indicating a recovery in demand following the large accumulation in US inventories post-tariff shock.
Positioning and Ratios Favour Gains
With net inflows of 95 million ounces in the first half of 2025, silver ETP investment has already surpassed the total for all of last year. By June 30, global silver ETP holdings reached 1.13 billion ounces, just 7% below their highest level since the peak of 1.21 billion ounces in February 2021
Futures positioning has also surged , with long positions up 163% over six months. These factors have helped propel silver prices over 35% higher year-to-date, building on a 21% gain in 2024.
The iShares SLV ETF netted inflows of $1,467.5 million over the past 3 months.
Physical silver investment demand remains robust, with significant buying from Asian markets. India, the world’s leading silver importer, saw record purchases of physical bullion and silver-backed ETFs during the first six months of 2025.
The gold-to-silver ratio, currently in the late 80s, remains historically elevated, suggesting silver remains significantly undervalued compared to gold. This indicates substantial upside potential for silver, especially given persistent market deficits, rising industrial and investment demand, and gold rising at the same time.
Hypothetical Trade Set-up
The silver market’s bullish fundamentals appear increasingly robust. Investors may consider accumulating silver positions, viewing short-term consolidations as attractive buying opportunities amid the compelling long-term outlook.
Options open interest for the September contract shows a bullish bias with a put/call ratio of 0.82 and high call interest at the far out-of-the-money call strike of $45 per ounce.
To express a bullish view on silver, investors can deploy a long position in CME Silver futures expiring in September. A hypothetical trade setup for this view is described below.
● Entry: $38.00 per ounce
● Target 1: $40.00 per ounce
● Target 2 (extension): $42.00 per ounce (if Fed easing in September coincides with physical tightness)
● Stop Loss: $36.70 per ounce
● Profit at Target 1: $10,000
● Profit at Target 2: $20,000
● Loss at Stop: $6,500
● Reward-to-risk ratio: 1.54 (Target 1) and 3.08 (Target 2)
Alternatively, investors can exercise the same view using CME Micro Silver futures, which offer smaller notional positions and more flexibility. Each Micro contract is priced in USD per ounce and represents 1,000 ounces of silver, compared to 5,000 ounces for the standard contract.
MARKET DATA
CME Real-time Market Data helps identify trading set-ups and express market views better. If you have futures in your trading portfolio, you can check out on CME Group data plans available that suit your trading needs tradingview.com/cme .
DISCLAIMER
This case study is for educational purposes only and does not constitute investment recommendations or advice. Nor are they used to promote any specific products, or services.
Trading or investment ideas cited here are for illustration only, as an integral part of a case study to demonstrate the fundamental concepts in risk management or trading under the market scenarios being discussed. Please read the FULL DISCLAIMER the link to which is provided in our profile description.
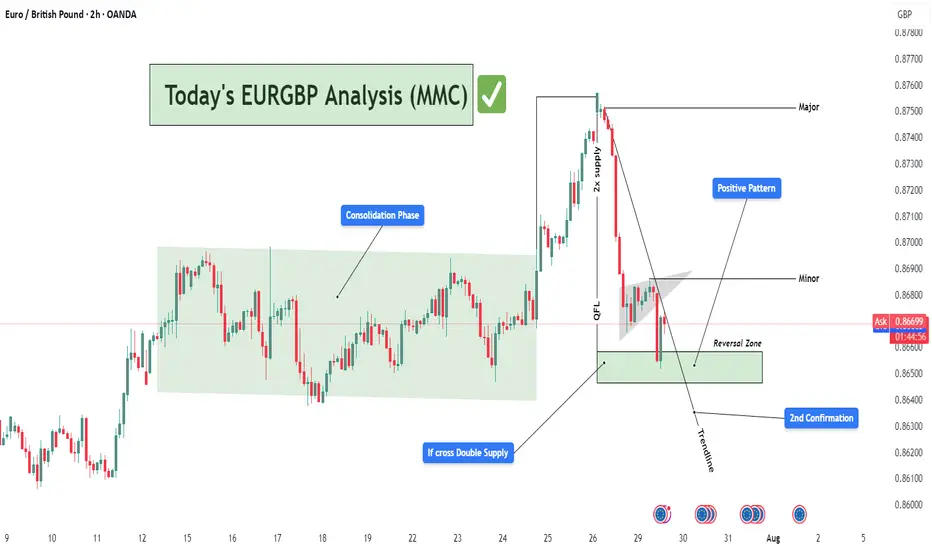
EURGBP Bullish Reversal Setup from Demand Zone (MMC Strategy)📊 Detailed Technical Analysis:
The EURGBP pair on the 2-hour chart is currently at a critical technical juncture, showing signs of a potential bullish reversal. This analysis follows Market Maker Concepts (MMC), which combines liquidity engineering, smart money movements, and structure shifts. Let’s break it down:
🔄 1. Consolidation Phase – Accumulation in Action (Smart Money Footprint)
Between July 15 to 24, the price moved within a tight range — classic consolidation behavior.
This phase suggests accumulation by institutional players, quietly building long positions while trapping retail shorts and longs.
This kind of sideways structure typically precedes a high-volume breakout, which happened right after.
📌 Lesson: Consolidation is often the calm before the storm — prepare for a breakout when this phase completes.
🚀 2. Breakout with QFL Pattern – Aggressive Bullish Shift
The price broke above the consolidation range and surged strongly.
This breakout followed a classic QFL (Quick Flip Level) structure — where price forms a base, drops temporarily, and then explodes upward.
The area of breakout aligns with a “2x Supply” zone — meaning this zone acted as a magnet for stop orders, and once breached, added more fuel to the rally.
📌 Why QFL Matters: It marks a shift in market sentiment — from balanced to strongly biased, in this case toward bulls.
📉 3. Pullback Phase – Structural Correction Begins
After reaching a high near 0.87500 (major resistance), price began to pull back sharply.
It formed a minor descending flag/channel, a classic corrective pattern, often a pause before resuming the larger trend.
A descending trendline has been drawn to capture this pullback structure.
📌 Important: Pullbacks are healthy — they allow for re-entries and provide better R:R setups.
📍 4. Reversal Zone – Key Demand Revisited
Price now sits within a Reversal Zone (Demand Area), marked in green on the chart.
This level previously served as the base for the breakout and aligns with institutional buying interest.
The area acts as a high-probability buy zone, supported by:
Trendline support
Price rejecting lower levels
Historical reaction at this zone
📌 Why It’s Crucial: If price respects this demand zone, it confirms bullish intent and creates a low-risk buying opportunity.
✅ 5. 2nd Confirmation – Price Action Support
The chart marks a "2nd Confirmation" label at a slightly lower level — this is a final support level, a safety net.
If price dips and bounces here again, it confirms buyer strength.
Strong price reaction at this level would validate a trend continuation setup back toward highs.
💹 6. Positive Pattern – Early Reversal Signs
Inside the demand zone, a bullish structure is forming.
This could be an inverted head & shoulders, or a double bottom pattern.
These patterns often act as launch pads for upward moves, especially when combined with institutional demand.
📌 MMC Insight: Market Makers engineer dips to induce panic, only to reverse aggressively once liquidity is absorbed.
🎯 Trade Plan Based on the Analysis:
Buy Zone: Between 0.86450 – 0.86700 (Reversal Zone)
Stop-Loss: Below 0.86250 (beneath 2nd confirmation)
Take Profits:
🎯 TP1: 0.86900 (Minor resistance)
🎯 TP2: 0.87500 (Major swing high)
Risk-to-Reward: 1:2 or higher depending on entry timing
🧠 MMC Strategy Summary for Minds:
This EURGBP 2H chart is a textbook example of MMC-based trading. We saw:
Institutional accumulation (consolidation phase)
QFL breakout (confirmation of bullish intent)
Return to demand (market maker’s discount area)
Early bullish signals (positive price action patterns)
Multiple confluences at the Reversal Zone (trendline, demand, confirmation zone)
Such a combination offers a high-probability swing trade setup. Patient traders can wait for the structure to break upward and join the trend with tight risk and clear targets.
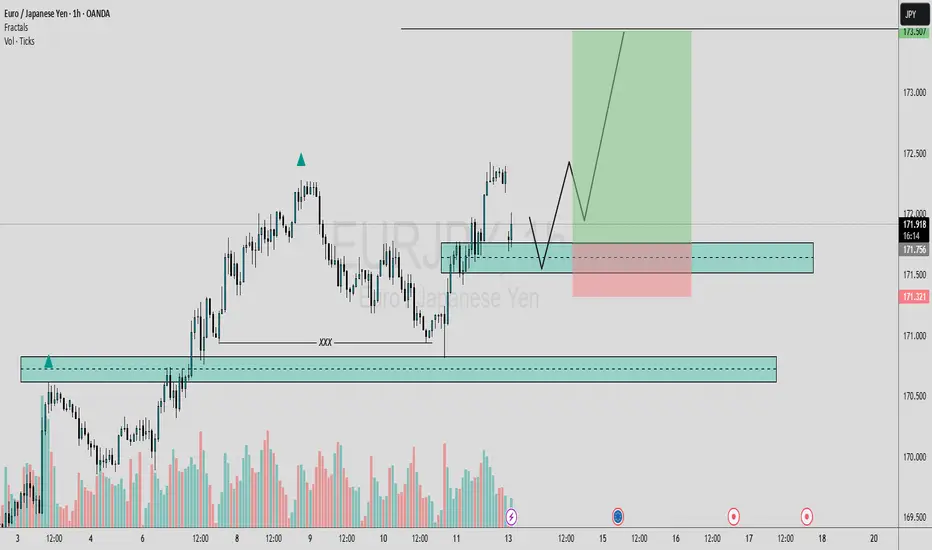
EURJPY POSSIBLE EXPECTED MOVEIn this analysis we're focusing on 1H time frame. Today I'm looking for a potential buy move from my marked key levels. This is a higher time frame analysis. Let's analyze more deeply into smaller timeframe and potential outcomes. Confirmation is very important.
Always use stoploss for your trade.
Always use proper money management and proper risk to reward ratio.
This is my analysis.
#EURJPY 1H Technical Analysis Expected Move.

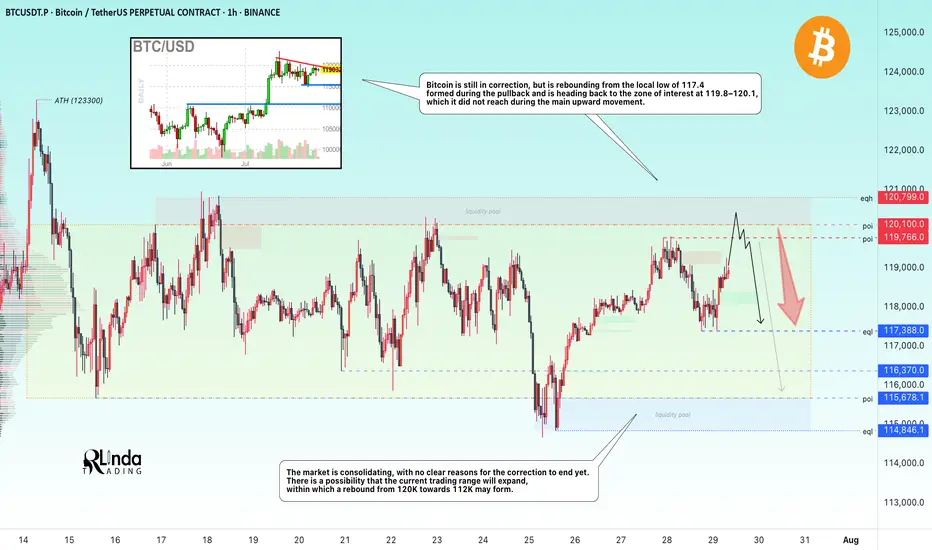
BITCOIN → Hunting for liquidity. Retest resistance before a fallBINANCE:BTCUSDT.P continues to consolidate after a strong rally. There is no strong driver yet, and Bitcoin is reacting weakly to economic data. There is a possibility of a continued correction...
Bitcoin is still in correction, but is rebounding from the local low of 117.4, formed during the pullback, and is heading back up towards the zone of interest at 119.8-120.1, which it did not reach during the main upward movement. I see no fundamental or technical reasons for the correction to end and for growth beyond 121K. I expect a rebound from the resistance zone towards 115-114K. However, in the medium term, I expect the market to attempt to close half or all of the gap between 112K and 114.8K, thereby expanding the key trading range.
Resistance levels: 119.77, 120.1K, 120.8K
Support levels: 117.4, 116.37, 115.68
Technically, a false breakout (liquidity capture) of key resistance and price consolidation in the selling zone could trigger bearish pressure on the market, which in turn would lead to a correction.
Best regards, R. Linda!
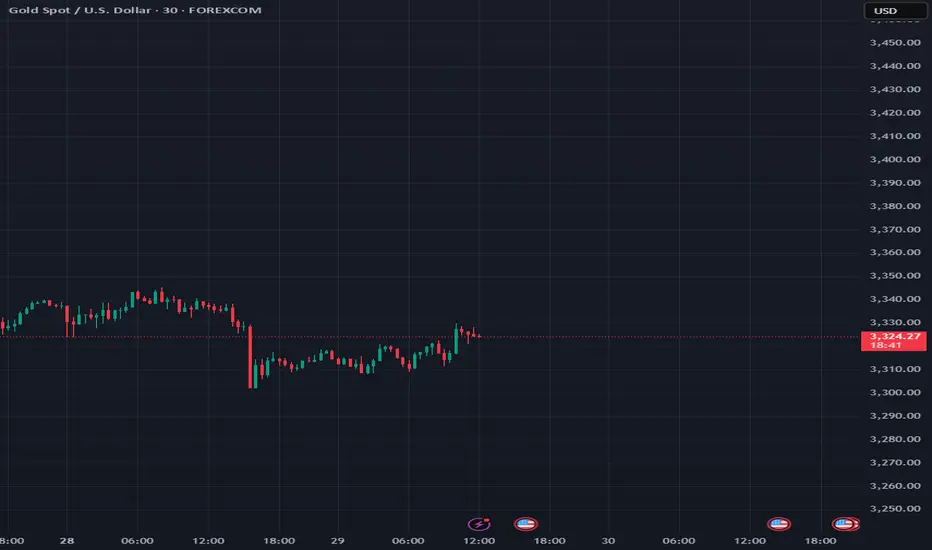
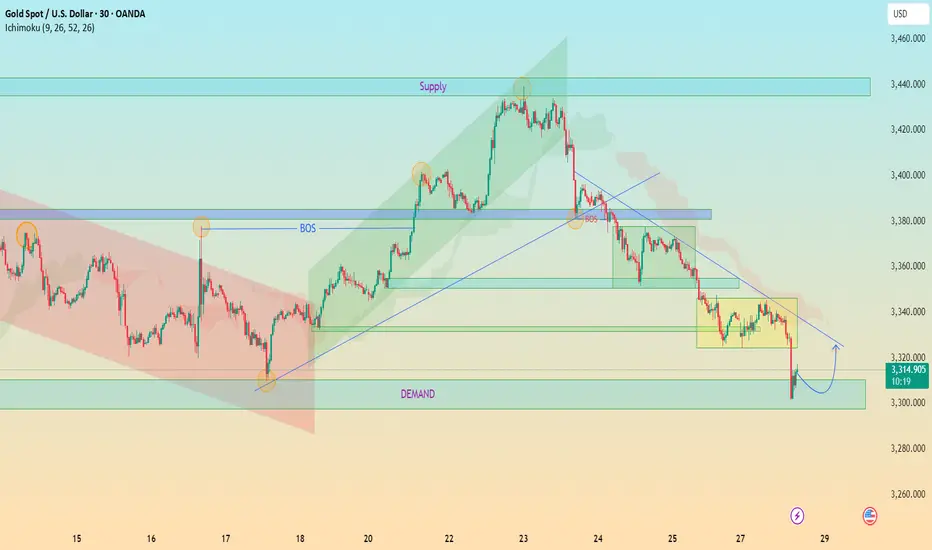
XAUUSD: Demand Rejection or Breakdown? All Eyes on 3,300 ZoneChart Analysis Breakdown (30m TF – Gold/USD)
1. Market Structure Overview
Bearish Trend Dominance:
The price has shifted into a bearish structure after a Break of Structure (BOS) to the downside, indicating bearish control after failing to sustain higher highs.
Lower Highs & Lower Lows:
A consistent formation of LHs and LLs confirms bearish momentum.
2. Key Zones & Reactions
🟩 Demand Zone (~3,300–3,310):
Current price is reacting from a clearly defined demand zone.
Strong buying wick indicates interest and potential short-term bounce.
This zone has historical significance — previous reversal point.
🟥 Supply Zone (~3,420–3,445):
Price reversed sharply from here.
This is a key liquidity zone; expect heavy resistance if price retraces.
🔵 BOS Areas Marked:
Confirmed transitions in structure:
Bullish BOS followed by a bearish BOS — great illustration of shift in control.
🟨 Consolidation Blocks:
Highlighted ranging periods show distribution/accumulation phases before breakouts.
3. Trendlines & Channel Patterns
📉 Descending Trendline:
Acts as dynamic resistance.
If price retraces to this level (around 3,330–3,340), expect potential rejection unless broken cleanly.
📈 Previous Bullish Channel (Broken):
Price moved out of a bullish ascending channel, confirming bearish intent.
4. Ichimoku Cloud Context
Price is below the Kumo cloud, suggesting bearish bias remains intact.
Future cloud is bearish.
However, short-term pullback into cloud possible (especially if demand zone holds).
📊 Forecast & Trade Idea
Scenario 1: Bullish Rejection from Demand
Price may bounce towards 3,340 (previous S/R + trendline retest).
Watch for reaction at this level.
Scenario 2: Clean Break of Demand Zone
Opens path toward deeper downside (e.g., 3,280 or even lower).
Could trigger liquidity grab before reversal.
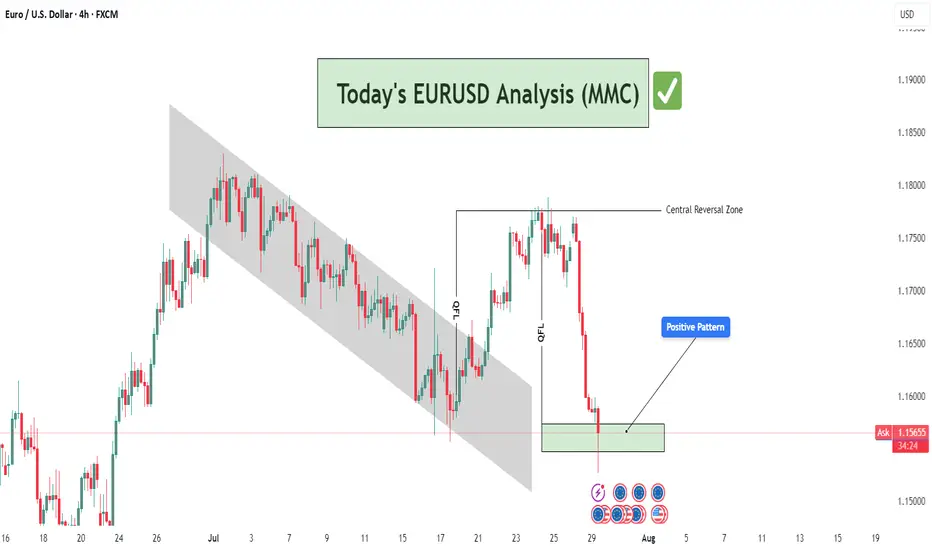
EURUSD Analysis : Rejection at Demand – Institutional Buy Setup🔍 Technical Storyline – What the Chart Tells Us:
🔸 1. Previous Bearish Structure – Descending Channel:
Price has been moving within a well-respected bearish channel, signifying structured sell-side liquidity control.
This channel served as a trap zone, where retail sellers were induced while institutions accumulated buy-side positions below the range.
The controlled movement inside the channel ended with a breakout to the upside, signaling a disruption in bearish control.
🔸 2. QFL Zone Formation – Manipulation & Liquidity Grab:
QFL (Quasimodo Failure Level) is evident in two phases here:
The first QFL acts as a reaction point where the market dropped to test demand and rallied aggressively.
The second QFL near the highs shows price swept previous liquidity before dumping, hinting at institutional profit-taking and possible redistribution into discount areas.
🔸 3. Central Reversal Zone (CRZ):
Price reversed sharply from this CRZ, which acted as a major supply level. The CRZ marks the top of the manipulation range.
This was a liquidity sweep targeting trapped long positions that entered too late at the highs.
🔸 4. Demand Revisit + Positive Rejection Pattern (Current Phase):
Price has now reached the MMC-validated demand zone, which previously launched a strong bullish move.
The long lower wick in the latest candle shows buyer absorption, suggesting early signs of a Positive Reversal Pattern.
This area is marked with high probability for bullish continuation, as it aligns with both technical support and smart money logic.
💡 Trading Plan & Market Mindset:
🔸 📈 Bullish Scenario (High-Probability Play):
Wait for bullish confirmation, such as:
Bullish engulfing on 1H/4H
Break of minor intraday structure (e.g., break of internal LH)
Strong volume surge from the zone
Entry zone: Within the demand block – 1.15500 to 1.15750
Stop-loss: Just below the demand zone (1.15250)
Target 1 (TP1): 1.16500 – minor intraday resistance
Target 2 (TP2): 1.17500–1.18000 – retest of QFL high and Central Reversal Zone
🔸 ❌ Bearish Invalidator:
A 4H candle close below 1.15250 would break the demand zone structure.
Invalidation of MMC reversal – move toward deeper liquidity (1.14500–1.14800)
🧠 Trader’s Psychology & Institutional Mindset:
Institutions often induce price spikes to trap both buyers and sellers.
This entire structure reflects classic accumulation → manipulation → distribution → reaccumulation.
The retest of the original demand zone allows institutions to re-enter at discount before pushing price back toward the highs.
“In MMC, patterns are not just shapes – they are footprints of institutional intent.”
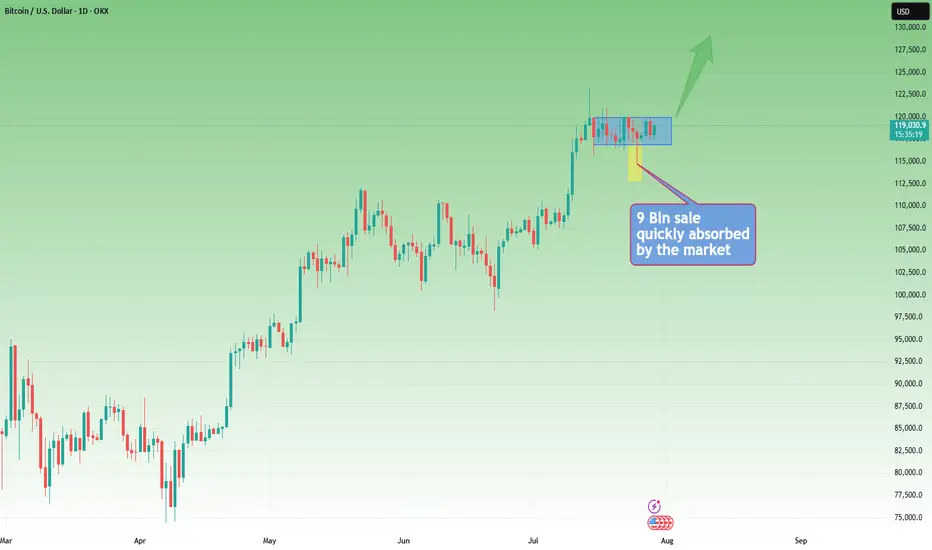
Rectangle Consolidation + Bull Trend = BTC Setup for ATHYesterday, Bitcoin dipped and recovered again, following last week's sharp spike down, triggered by the $9B Galaxy Digital sale on behalf of a Satoshi-era investor.
________________________________________
🧠 Why is this important?
Despite being one of the largest BTC sales in history, the move only caused a temporary spike down.
That’s a clear sign of market strength and strong interest on dips.
________________________________________
📉📈 Current Technical Context:
• If we ignore the spike, price is consolidating in a tight rectangle
• That’s typically a continuation pattern
• The broader trend remains strongly bullish
📌 Put all of that together, and we have at least 3 reasons to expect upside continuation
________________________________________
🎯 Key Levels:
• Break + daily close above $120K → likely leads to a new ATH and a potential test of $130K
• Invalidation only comes with a break below $114K
________________________________________
Conclusion:
BTC just absorbed a massive $9B sell without blinking.
As long as $114K holds, I'm bullish and expecting continuation.
Next leg could (and I hope it will) be explosive. 🚀
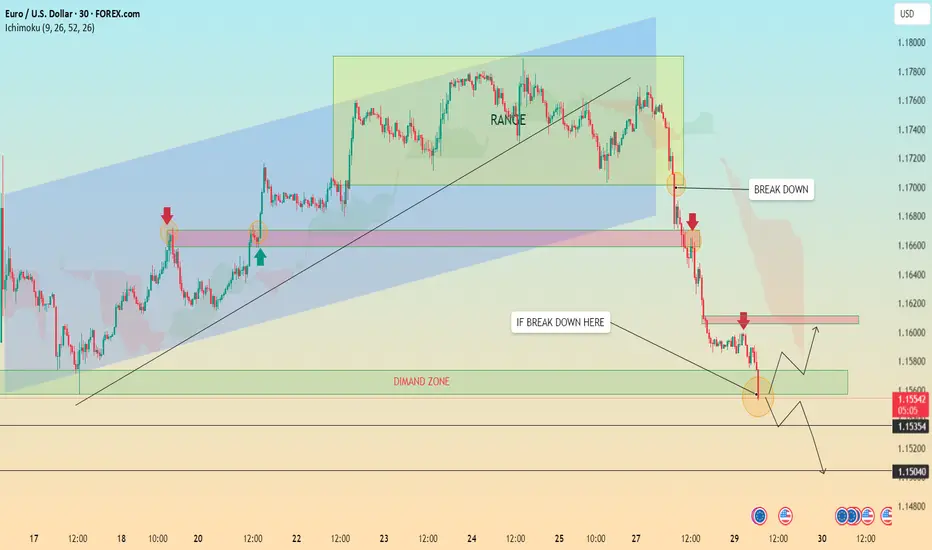
EURUSD Breakdown Bearish Trend Continues or Demand Zone Reversal🔍 Chart Breakdown: EUR/USD (30-min TF)
Trend Overview:
Previous Trend: Bullish channel structure (highlighted in blue).
Current Momentum: Strong bearish breakdown following a clear range phase.
The chart shifted from consolidation → breakdown → aggressive bearish continuation.
🧱 Key Technical Highlights:
1. Bearish Breakout:
Price broke below the ascending trendline and exited the ranging box, confirming a bearish shift.
Multiple Breakdown Retests (highlighted with red arrows) confirming structure failures and validating resistance zones.
2. Range Zone (Distribution Phase):
Price moved sideways within the green rectangle (“RANGE”), indicating accumulation/distribution before the selloff.
The breakdown from this range confirmed bearish momentum.
3. Demand Zone Test (Now in Play):
Price is approaching/hovering around a demand zone (green box) marked as a critical support.
Buyers may react here, offering two key scenarios:
Bounce back to retest resistance around 1.1600 (highlighted).
Breakdown below demand, leading to further decline toward next major support zones (1.15354 and 1.15040).
4. Price Reaction Zones:
🔴 Resistance zones are clearly marked where breakdown retests occurred.
🟢 Demand zone with bounce-or-break logic provides directional bias.
🧭 Potential Scenarios (Marked on Chart):
✅ Bullish Case:
If demand zone holds, expect:
A corrective rally toward 1.1600–1.1620.
Watch for rejection signals here (could be ideal for re-entering shorts).
❌ Bearish Case:
If breakdown below green demand zone occurs, targets:
1.1535 (local structure support)
1.1504 (next confluence level; possible long-term bounce area)
📈 Indicators:
Ichimoku Cloud: Price is well below the cloud, confirming bearish control.
Structure: Lower highs & lower lows = confirmed bearish trend.
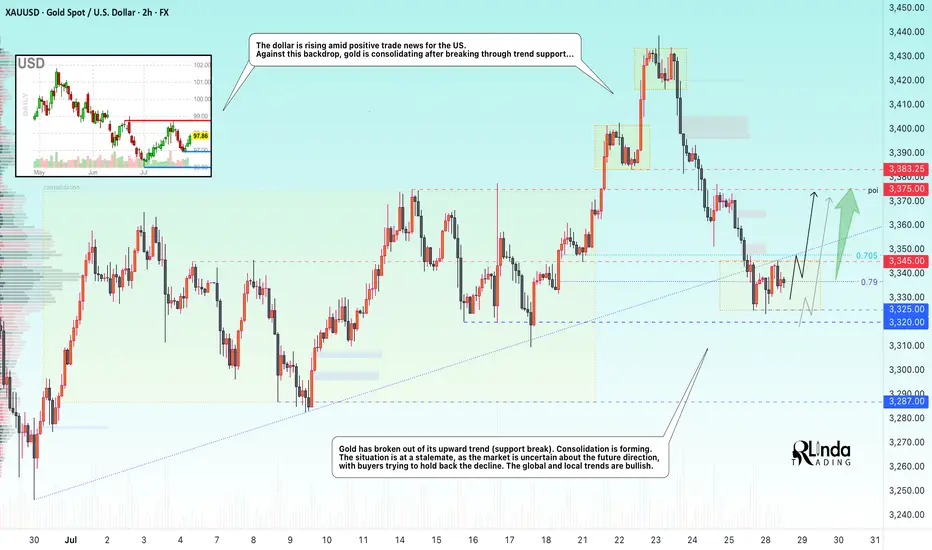
GOLD → Retest of trend support. Consolidation...GOLD is consolidating below the previously broken trend support. On Sunday, Trump announced a trade deal with the EU, which is putting pressure on the market along with the rising dollar...
Gold rebounded from support at $3310 after a week-long low, interrupting a three-day decline amid profit-taking. However, the overall downtrend remains intact as markets brace for a busy week with the release of US GDP data and the Fed's decision. Optimism surrounding US-China trade talks and the US-EU framework agreement is reducing demand for safe-haven assets. Additional pressure on gold is coming from easing geopolitical tensions: Thailand and Cambodia have agreed to ceasefire talks. The metal's recovery may be short-lived.
Technically, we have global and local bullish trends, against which gold is testing support, but as we can see, buyers are trying to hold back the decline due to uncertainty over interest rates. There is a chance that we will see active action by the Fed, behind which lies a rate cut, this week...
Resistance levels: 3345, 3375
Support levels: 3320, 3287
At the moment, I do not see a proper reaction to the support breakout. The price is consolidating after confirming the key trigger at 3345. Thus, if the price starts to return to 3345, test and consolidate above the level, we will have a chance for growth. I do not rule out a liquidity grab from 3325 (false breakout) before the rise.
BUT! The structure will be broken if the price breaks 3325 - 3320 and begins to consolidate below this zone. In this case, gold may fall to 3287
Best regards, R. Linda!
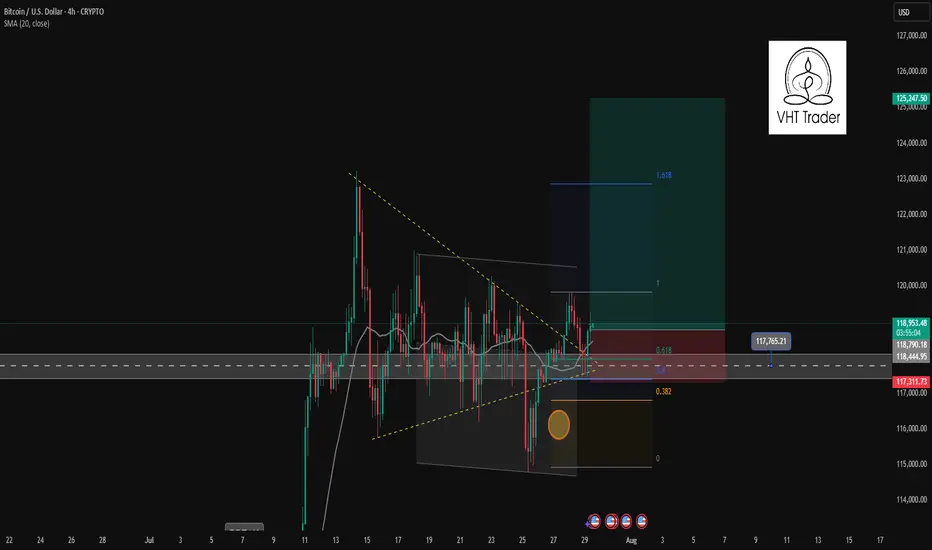
BTCUSD trading signal. False break of bottom line✏️ CRYPTO:BTCUSD just False Break the lower band and is establishing a bullish wave structure in the H4 time frame. 119700 will be the top of wave 1 if the current bullish wave exceeds the top it will form a bullish DOW pattern heading towards a new ATH.
📉 Key Levels
BUY Now BTCUSD: Confirmation of candle when retesting Fibonacci 0.5
Target 127000
Leave your comments on the idea. I am happy to read your views.
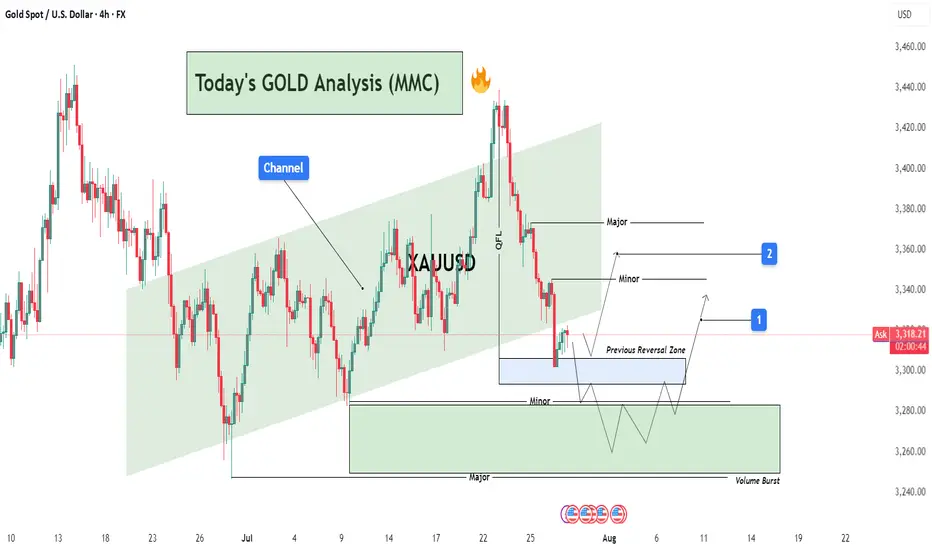
GOLD Analysis : XAUUSD Major Bullish Demand Zone🧠 Market Structure Context (MMC Framework)
Gold has recently shown a clean structural decline from its local highs within a well-defined ascending channel. This analysis highlights a reaction zone-based playbook, focusing on high-probability reversal scenarios guided by institutional footprints, volume reaction points, and MMC logic.
We’re currently trading near a previous reversal zone, where history tells us the market tends to shift behavior. Let’s dissect the key components.
📊 Key Technical Components
🔸 1. Ascending Channel Breakdown
The entire uptrend was respecting a well-established bullish channel until the recent drop violated the midline structure. This breakdown confirms a temporary bearish phase, with price breaking cleanly below a QFL base (Quick Flip Level)—a level where price reversed sharply before, which now acts as a major supply zone.
Psychological Insight: Channels give clues about momentum. Breaking below the lower band shows the market is preparing for a retest or a deeper liquidity hunt.
QFL Breakdown: Once broken, previous buyer confidence is shaken—inviting sellers to test demand zones.
🔸 2. Previous Reversal Zone (PRZ) Reaction
Currently, price is hovering inside the blue shaded Previous Reversal Zone, where bullish pressure previously kicked in. It’s a minor demand zone, but critical due to historical reaction. The projected structure shows a bounce from this area before deciding next direction.
MMC Insight: The first test of PRZ often leads to an initial reaction. But deeper liquidity lies just below in the major green demand zone.
🔸 3. Major Demand Zone + Volume Burst Area (The Real Magnet)
Below the PRZ lies the major reversal block—highlighted in green. This zone is significant because:
It aligns with a high-volume burst in the past, confirming institutional orders.
It's a cleaner structure level for smart money re-entry.
It also provides room for the “liquidity sweep” (stop hunt), collecting sell stops before a proper reversal.
💡 Expected Play: Price may fake out below PRZ, enter the major demand, and then initiate a multiple-leg bullish rally. Patience is key here.
🛠️ Trade Structure Outlook
✅ Scenario 1 – Aggressive Buyers (Marked "1"):
Buy from the current PRZ zone around $3,305–$3,315
Target: $3,340 (Minor Resistance)
Risk: Slippage into deeper demand zone
Stop-loss: Below $3,295
✅ Scenario 2 – Safer Entry from Major Demand (Marked "2"):
Let price dip into $3,270–$3,280 zone (green box)
Look for reversal candles or liquidity sweeps on lower timeframes
TP1: $3,330
TP2: $3,365 (Major Resistance)
📈 Resistance Levels to Watch:
Minor Resistance: $3,340 – Expect short-term pullbacks or hesitation.
Major Resistance: $3,365 – Key target for swing traders and potential reversal zone.
🔍 MMC Concepts in Action
✅ Channel Logic: Breakdown implies momentum shift—watch for retests.
✅ QFL: Previous bounce zone broken = supply now overhead.
✅ Volume Burst Zone: Strong historical reaction = institutional interest.
✅ Zone-to-Zone Trading: Instead of random entries, focus on logical zone interactions.
🧭 Conclusion – Path of Probability
Gold is currently in a transitional phase—shifting from bearish correction to potential bullish revival. Patience will reward those who wait for PRZ rejections or deeper liquidity taps. The MMC framework helps frame this market not as chaos, but a map of strategic reaction points.
Qualcomm: Beyond the Smartphone Storm?Qualcomm (NASDAQ:QCOM) navigates a dynamic landscape, demonstrating resilience despite smartphone market headwinds and geopolitical complexities. Bernstein SocGen Group recently reaffirmed its "Outperform" rating, setting a \$185.00 price target. This confidence stems from Qualcomm's robust financials, including a 16% revenue growth over the last year and strong liquidity. While concerns persist regarding potential Section 232 tariffs and Apple's diminishing contribution, the company's strategic diversification into high-growth "adjacency" markets like automotive and IoT promises significant value. Qualcomm currently trades at a substantial discount compared to the S&P 500 and the Philadelphia Semiconductor Index (SOX), signaling an attractive entry point for discerning investors.
Qualcomm's technological prowess underpins its long-term growth narrative, extending far beyond its core wireless chipmaking. The company aggressively pushes **on-device AI**, leveraging its Qualcomm AI Engine to enable power-efficient, private, and low-latency AI applications across various devices. Its Snapdragon platforms power advanced features in smartphones, PCs, and the burgeoning **automotive sector** with the Snapdragon Digital Chassis. Further expanding its reach, Qualcomm's recent acquisition of Alphawave IP Group PLC targets the data center market, enhancing its AI capabilities and high-speed connectivity solutions. These strategic moves position Qualcomm at the forefront of the **high-tech revolution**, capitalizing on the pervasive demand for intelligent and connected experiences.
The company's extensive **patent portfolio**, encompassing over 160,000 patents, forms a critical competitive moat. Qualcomm's lucrative Standard Essential Patent (SEP) licensing program generates substantial revenue and solidifies its influence across global wireless standards, from 3G to 5G and beyond. This intellectual property leadership, combined with a calculated pivot away from its historical reliance on a single major customer like Apple, empowers Qualcomm to pursue new revenue streams. By aiming for a 50/50 split between mobile and non-mobile revenues by 2029, Qualcomm strategically mitigates market risks and secures its position as a diversified technology powerhouse. This assertive expansion, alongside its commitment to dividends, underscores a confident long-term outlook for the semiconductor giant.

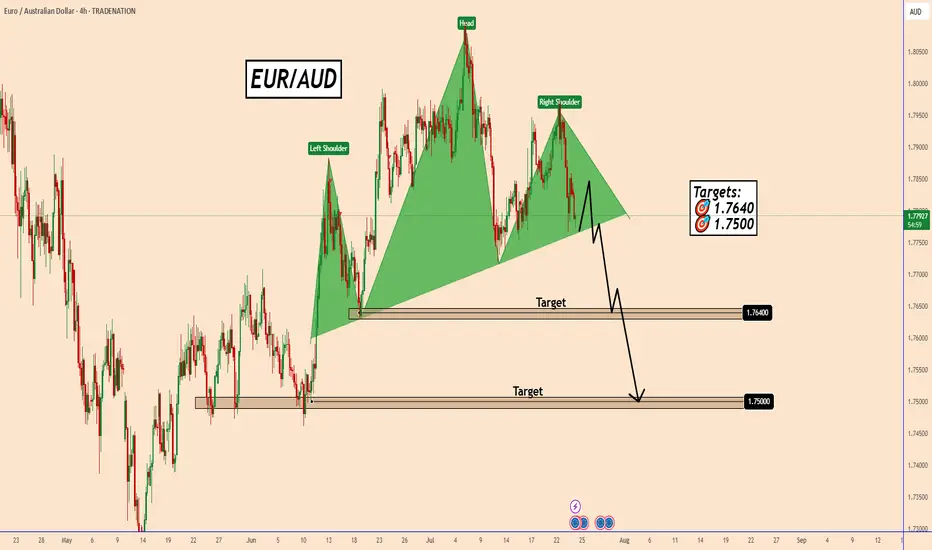
EURAUD is poised to confirm a bearish Head & Shoulders pattern.EURAUD is poised to confirm a bearish Head & Shoulders pattern.
The price could move higher today on hopes that the ECB can share some positive news on the economy and interest rates.
The European Central Bank is expected to keep interest rates unchanged, ending a seven-year streak of cuts.
If the price manages to break below the neckline of the pattern, it will open the door for further declines.
The first support zone will be found near 1.7640 and the second near 1.7500.
You may find more details in the chart!
Thank you and Good Luck!
PS: Please support with a like or comment if you find this analysis useful for your trading day
Disclosure: I am part of Trade Nation's Influencer program and receive a monthly fee for using their TradingView charts in my analysis.
BTCUSD Analysis (MMC) – Breakout Confirmed + Target Next Zone⚙️ Chart Context (4H BTC/USD)
As part of our Mirror Market Concepts (MMC) strategy, today's BTCUSD 4H chart is a textbook representation of market structure shift, SR interchange, demand reaction, and target projection. After consolidating within a compressed range under a key descending structure, Bitcoin has successfully broken out of bearish control, signaling a fresh phase of bullish momentum.
🧩 Breakdown of Technical Structure
🔹 1. Demand Zone Reaction (July 13–14)
The initial impulse move originated from a well-defined demand zone, marked by a strong accumulation and breakout. This zone—highlighted on the chart—acted as the institutional demand base, where buyers stepped in with volume and aggression. Price respected this zone precisely, confirming it as a valid MMC "Power Base."
Why this matters: Demand zones like these reflect institutional footprints. Once price reacts from such zones, they often become foundational for future bullish legs.
🔹 2. SR Interchange Zone – Structure Flip Confirmed
The descending green channel acted as dynamic resistance for several sessions. Every touch along this zone resulted in a lower high, confirming bearish order flow. However, BTC has now closed decisively above this structure, transforming this zone from supply to support—this is our classic SR Interchange concept in MMC.
Interpretation: This structure flip implies a strong change in sentiment. What was once a zone of rejection now becomes a potential support for continuation.
Expect retests of this zone before price resumes to higher reversal levels.
🔹 3. Minor and Major Resistance Zones
Above current price, two critical zones have been mapped:
Minor Resistance (~$120,000):
Acts as the first liquidity grab area. This is where early sellers may place stops or where short-term traders could book profits. MMC logic expects minor resistance to either cause a pause or a fakeout to lure in shorts.
Major Resistance / Central Reversal Zone (CRZ):
Spanning roughly $121,000 to $121,800, this is a key zone where price will likely meet decision-making. This CRZ is derived from previous structure congestion, imbalance fills, and projected Fibonacci confluence.
Next Reversal Zone (Final Target Area):
Located near $123,000, this is the outer reversal box where the bullish wave may either end, consolidate, or reverse entirely. This is the final target for swing traders or MMC practitioners looking for exhaustion.
🧭 Price Forecast Structure – Predictive Pathway
The forecast path shown on the chart illustrates a stair-step rally, with bullish impulses followed by shallow pullbacks:
First, price may pull back slightly to retest the breakout zone (green SR area).
Then a leg upward to minor resistance (~$120K).
A healthy rejection or small correction before breaking into the CRZ (~$121.2K).
Final move toward the outer reversal zone at ~$123K.
This fractal progression is a common MMC pattern seen during structure shifts—not impulsive straight-line rallies, but controlled, zone-to-zone movements.
🔍 Strategic Insights & Trade Plan
📌 Conservative Entry:
Wait for a retest of the breakout zone (SR Interchange) around $118,200–$118,500.
Look for bullish rejection candles or order flow confirmation on LTF (lower timeframes).
📌 Aggressive Entry:
Break and close above $120,000, confirming liquidity clearance and path toward CRZ.
🎯 Target Zones:
TP1: $121,200 – Central Reversal Zone
TP2: $123,000 – Outer Reversal Zone
❌ Stop-Loss Ideas:
Below $117,000 (structure invalidation)
Below recent bullish impulse candle low
🧠 MMC Concepts in Action:
SR Flip: Strong indication of market shift
Demand Rejection: Institutional footprint detected
Zone Mapping: Controlled zone-to-zone movement
Liquidity Logic: Price moves where orders rest – CRZ = likely reaction
Reversal Framing: Structure analysis ahead of time, not after the move
📊 Conclusion:
This BTCUSD 4H analysis showcases a strong MMC-style breakout scenario. The reaction from demand, shift in SR structure, and projected reversal zones give us a clean roadmap. As long as the structure remains valid and price respects the new SR zone, this bullish move remains high-probability.
Trade with structure. Trust the zones. Mirror the Market.
