Oil Steady as Sanction Threat LoomsOil prices held steady near recent highs after Trump threatened Russia with economic penalties if it doesn’t reach a ceasefire with Ukraine within 10–12 days. Traders are watching closely, as potential secondary sanctions on Russia could disrupt crude supply. However, skepticism remains over whether Trump will follow through, given his push for lower oil prices. The threat comes amid ongoing EU sanctions and ahead of key US trade deadlines and an OPEC+ meeting. Despite current tightness and summer demand, concerns of oversupply remain for later in the year.
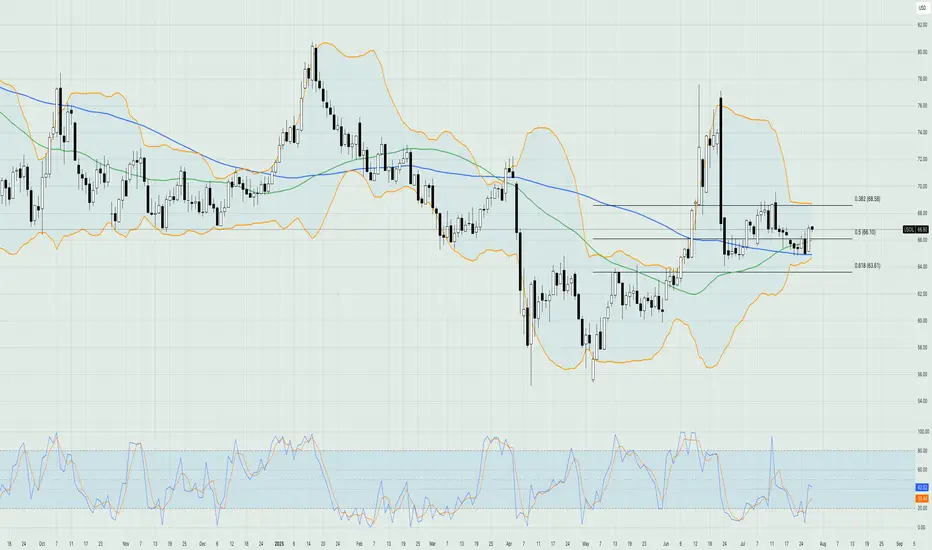
On the technical side, the price of crude oil is still trading in a sideways range between $64 and $68. The moving averages are confirming a bullish trend in the market, while the Stochastic oscillator is at neutral levels, hinting that the short-term outlook for pricing could go either way. The Bollinger bands have contracted quite excessively, meaning that volatility is low; therefore, it could take some time for any significant moves. Currently, the price is testing the resistance of the 50-day simple moving average, while the first area of technical resistance lies around the $68 level, which is the upper boundary of the current sideways channel.
Fundamental Analysis
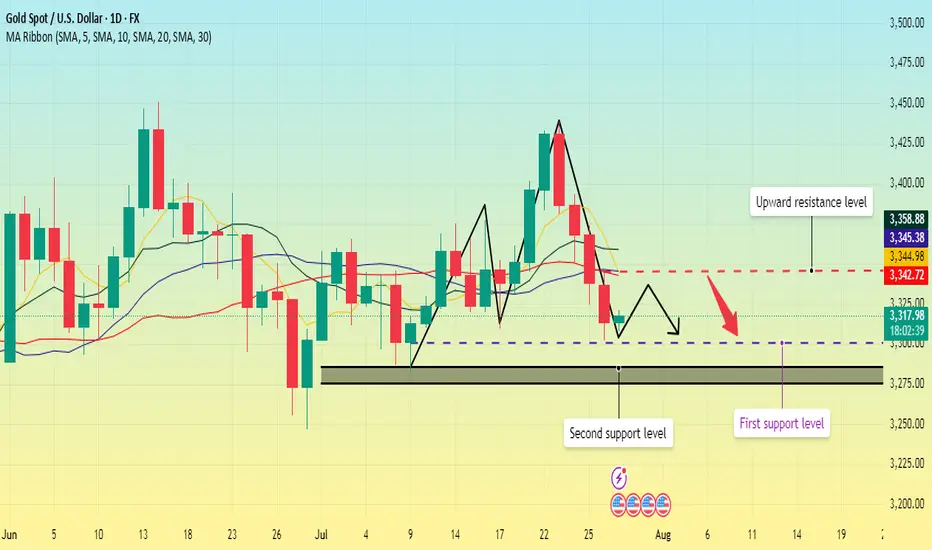
Gold Tests Key Support Near $3,300Gold held near $3,315 an ounce after a 0.7% drop, as investors awaited the Fed's rate decision, key US economic data, and developments in trade talks. A stronger dollar pressured the bullion, while the market remains on edge ahead of Trump's Aug. 1 tariff deadline. A possible 90-day extension in the US-China trade truce and upcoming jobs and inflation figures could drive volatility. Although gold is up over 25% this year due to geopolitical risks and trade uncertainty, prices have been rangebound since peaking above $3,500 in April.
From a technical point of view, the price of gold is currently testing the support level of the 100-day simple moving average just above the psychological level of $3,300. Even though the Bollinger bands are contracted, they started expanding slightly recently, showing volatility might be picking up, while the moving averages are validating the overall bullish trend in the market. The Stochastic oscillator is in the extreme oversold level, hinting that a bullish resumption of the trend might be seen in the upcoming sessions. Overall, the majority of the technical indicators are hinting at a bullish image in the near short term, so probably it might be a good idea to watch out for any candlestick formations this week that might give you the entry for a long position.
Disclaimer: The opinions in this article are personal to the writer and do not reflect those of Exness

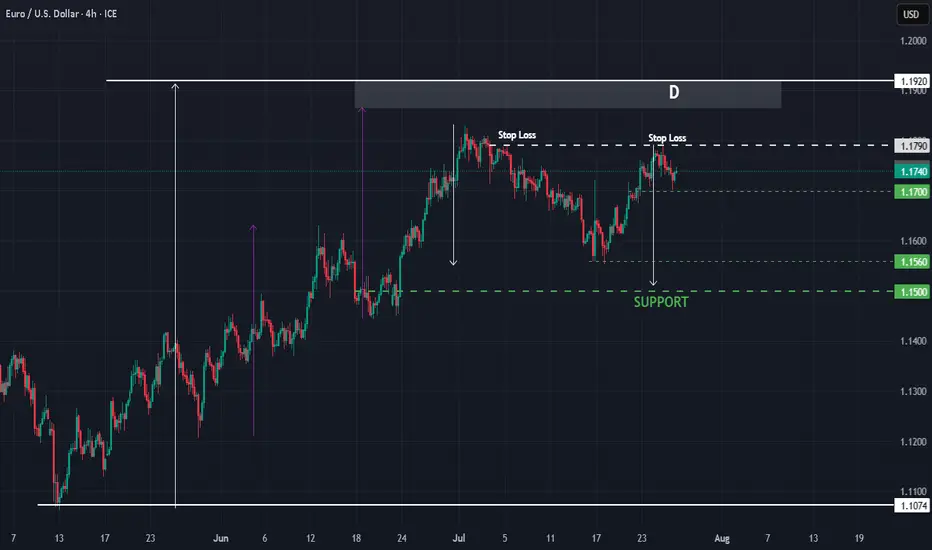
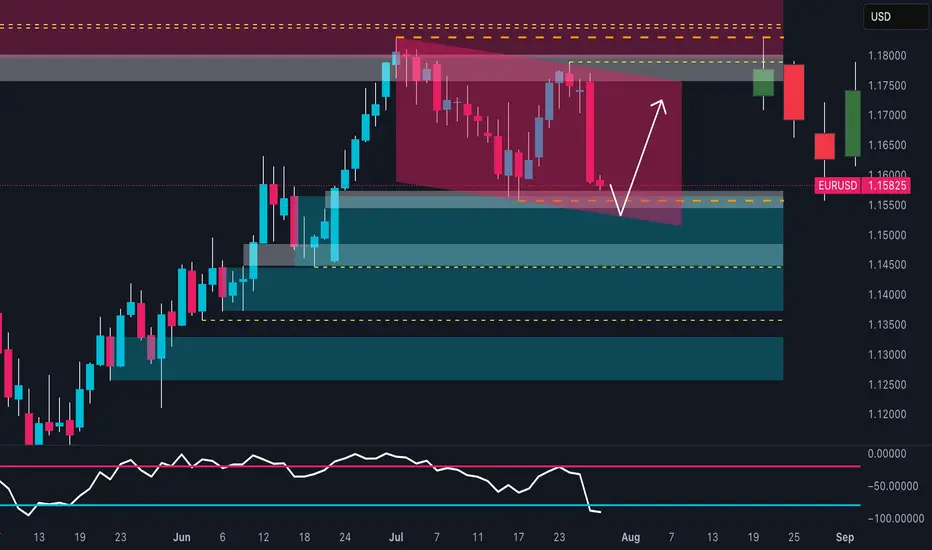
EURUSD : Status @ 25/7Direction: Sell
Signal triggered: 25/7/2025
Stop when:
a) Stop Loss @ 1.1790; or if
b) Buy signal triggered
Action:
Sell the rally
Good luck.
P/S: It seems that 1.1790 is a good resistance line as anticipated. The price may reach as low as 1.1500, which will serve as the next support level. Then we wait there for the next sell or maybe buy signal!
And a BIG congratulation to those who sold @ D - 1.1780 :-)
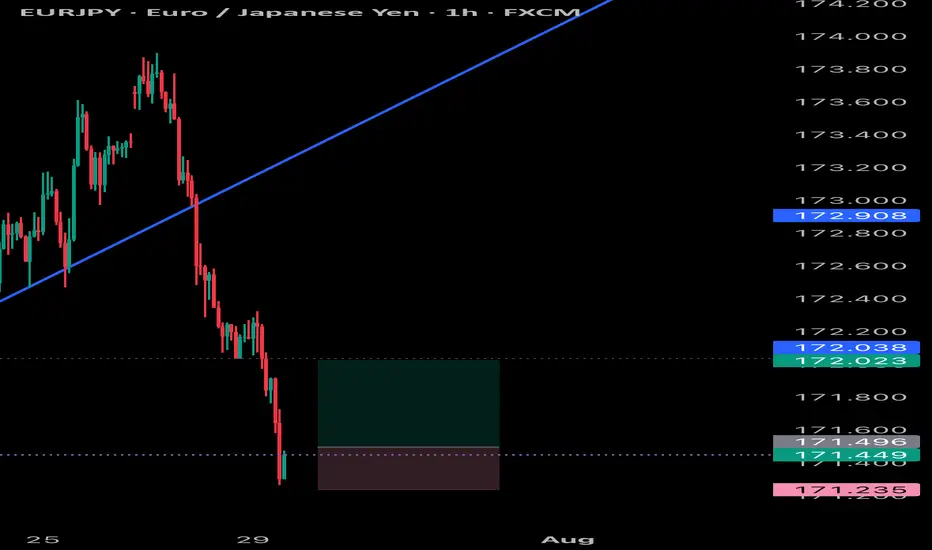
EURJPY SCALP Eurjpy quick scalp trade as it can still drop so it would be wise to not target higher than normal take profits , but will scalp it
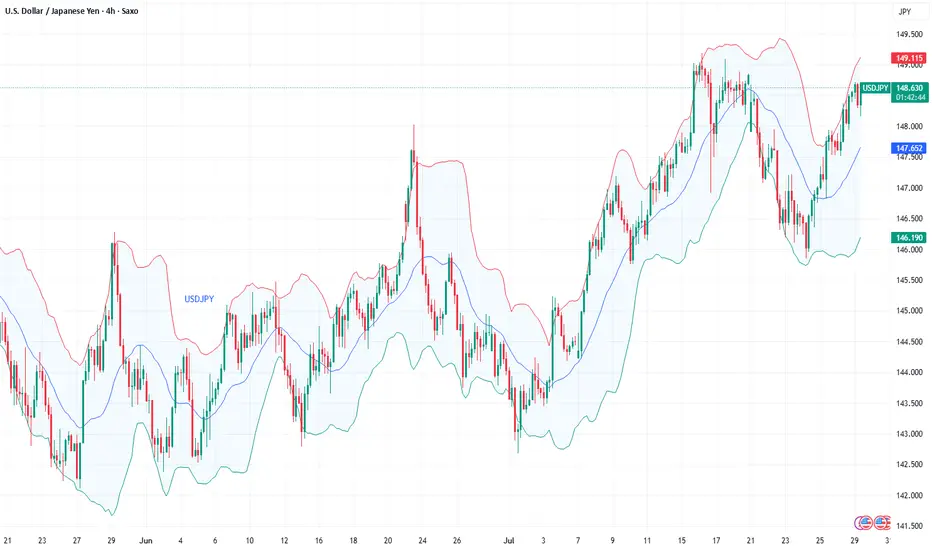
Fundamental Market Analysis for July 29, 2025 EURUSDThe pair is consolidating at 148.500, leaving behind a nearly 1% gain since the start of the week. High Treasury yields (10-year bonds — 4.34%) are supporting demand for the dollar, while the easing of the US-Japan trade conflict is reducing defensive demand for the yen. As part of yesterday's statement by the US Treasury, tariffs on Japanese cars are being reduced to 10%, which improves the outlook for export-oriented corporations, but at the same time reduces investors' need for safe-haven currencies.
Despite inflation of 3.7% y/y and rising food costs, the Bank of Japan is likely to keep its rate at 0.5% following its July 30-31 meeting and only revise its CPI forecasts upward. Former Deputy Governor of the Central Bank Hiroshi Nakaso acknowledges that further increases are only possible after assessing the effect of US tariffs, i.e., not before 2026. This scenario reinforces negative real interest rates and a widening yield differential with the US.
In addition, the inflow of Japanese investment into foreign bonds has resumed amid confidence in a gradual, rather than sharp, normalization of BOJ policy. Taken together, these factors point to the likelihood of a test of 150.00 in the coming days in the absence of verbal intervention by the Japanese Ministry of Finance.
Trading recommendation: BUY 148.500, SL 147.900, TP 150.500
CRO (Crypto.com) $3 Target! Don't Miss This Move🪙 Ticker: OKX:CROUSDT
🕰 Chart: 1D (Heikin Ashi)
🔧 Tools Used: Fibonacci Extension, Fundamental News (ETF Filing)
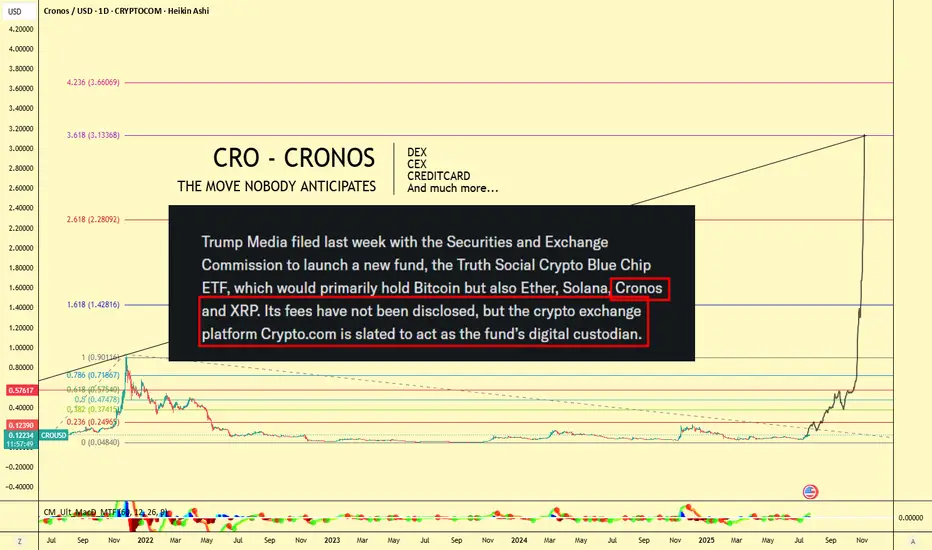
🔍 Chart Analysis: Fibonacci Extension Targeting $3+
The Fibonacci Extension tool has been applied to the major CRO impulse wave from its peak near $0.90 (late 2021) to the 2022–2023 bottom at $0.0484, confirming a multi-year retracement and consolidation period.
Let’s break down the major Fib levels:
Extension Level Price Target
0.236 $0.2495
0.382 $0.3741
0.618 $0.5745
1.0 $0.9011
1.618 $1.4281
2.618 $2.2809
3.618 $3.1336
📌 Current Price: ~$0.12
🔥 Upside Potential to $3.13+ — a 25x move from current levels if full extension plays out!
📣 Fundamental Catalyst: CRO in Trump Media ETF
According to the chart note (sourced from SEC-related headlines):
"Trump Media filed with the SEC to launch a new ETF, the Truth Social Crypto Blue Chip ETF, which would primarily hold Bitcoin, but also Ether, Solana, Cronos (CRO), and XRP."
Even more important:
"Crypto.com is slated to act as the fund’s digital custodian."
This is massive fundamental validation for CRO — not just as a token, but as an ecosystem and financial infrastructure provider.
🌐 Why Crypto.com Matters: Utility, Ecosystem, Adoption
Crypto.com isn't just an exchange — it's a comprehensive Web3 ecosystem, which includes:
🔁 CEX (Centralized Exchange):
Buy, sell, stake, and trade hundreds of cryptocurrencies with high liquidity and low fees.
🔄 DEX (Decentralized Exchange):
Cronos Chain supports decentralized trading and DeFi apps — with low gas fees and EVM compatibility.
💳 Visa Credit Card Integration:
Crypto.com offers one of the most popular crypto Visa debit cards — earn cashback in CRO and enjoy perks like Spotify/Netflix rebates.
📱 Mobile Super App:
Buy/sell/stake/farm on-the-go with a seamless user interface.
📈 Earn & Lending Services:
Stake CRO or other assets for up to double-digit yields.
🤝 Strategic Partnerships
Crypto.com has been aggressively investing in brand and adoption:
🏟 Official partner of UFC, FIFA World Cup, and Formula 1
🏀 NBA’s Los Angeles Lakers Arena naming rights (Crypto.com Arena)
💼 Member of Singapore's regulated exchanges
🔐 ISO/IEC 27701:2019, PCI:DSS 3.2.1, and SOC 2 compliance — one of the most secure platforms in the industry
🧠 Conclusion: The Perfect Blend of TA + FA
With CRO being included in a potential U.S.-regulated ETF, the Crypto.com ecosystem booming, and technical patterns pointing to a Fib-based target above $3, CRO might be the sleeper play of the next bull run.
"The move nobody anticipates" might just be the most explosive one.
🎯 Short-Term Targets:
$0.25
$0.37
$0.57
🎯 Mid-Term Bull Targets:
$0.90 (prior ATH)
$1.42
$2.28
🎯 Full Cycle Extension:
$3.13
📢 Let me know in the comments:
Are you holding GETTEX:CRO ? What do you think about its inclusion in the ETF?
#CRO #CryptoCom #ETF #TrumpMedia #Altcoins #Bullrun #CryptoTrading #DeFi #FibTargets #CronosChain
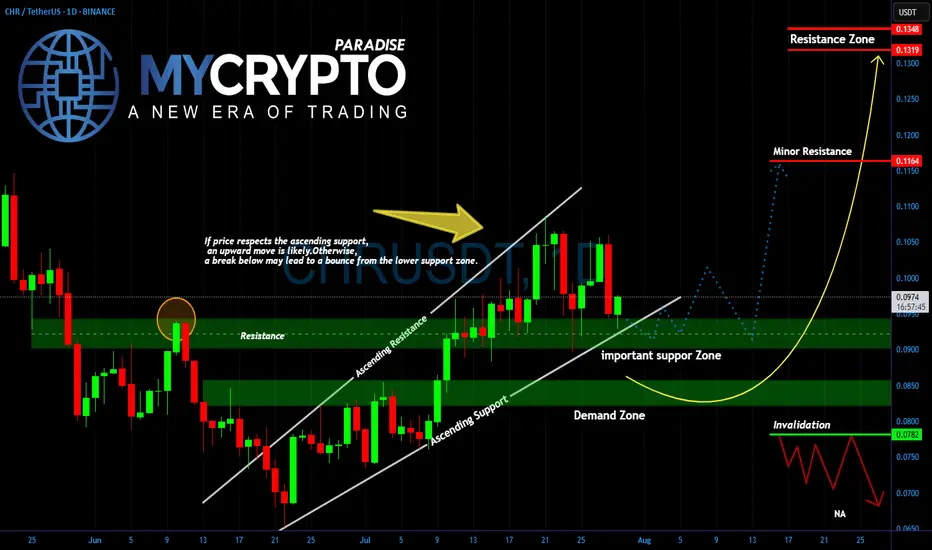
CHR Is About to Explode or Collapse Are You Ready for the Next BYello Paradisers, did you notice how #CHRUSDT is now testing the exact zone we warned about earlier? After weeks of climbing inside a clean ascending channel, the price is now sitting right on top of a critical support area. This is no coincidence what happens here will determine the next major wave.
💎The structure remains bullish as long as #CHR respects the ascending support trendline and the horizontal zone around 0.0900. This region, previously a strong resistance, is now acting as key support. If the bulls step in from here, we could see a sharp rebound toward the minor resistance near 0.1169. A confirmed breakout above that could open the path toward the upper resistance zone between 0.1320 and 0.1351.
💎But don’t get too comfortable. A clean break below this support zone would shift momentum back to the downside, dragging price toward the deeper demand area between 0.0840 and 0.0800. If the structure fully collapses and price breaks below 0.0782, we’d treat that as a clear invalidation of the bullish case, and a much lower range could open up.
For now, CHR remains in a waiting zone. It’s the reaction here that will give us the signal. Let the price come to you don’t chase it.
MyCryptoParadise
iFeel the success🌴
Meta surprises to the upside & strengthens its leadership in AIBy Ion Jauregui – Analyst at ActivTrades
Meta Platforms (TICKER AT: META.US) has posted strong quarterly results that significantly exceeded market expectations, driven by its solid positioning in artificial intelligence, advertising monetization, and the resilience of its digital ecosystem.
Key Financial Highlights
In the second quarter of 2025, Meta reported revenues of $38.72 billion, representing a 15% year-over-year increase, beating consensus estimates by over $1 billion. Net profit reached $13.46 billion, with an adjusted EPS of $5.22, reflecting strong operating leverage.
The advertising segment remains the main growth driver, but revenue gains from generative AI services and enterprise solutions powered by Meta AI and Llama 3, its proprietary language model, were also noteworthy. Meanwhile, Reality Labs, although still operating at a loss, managed to contain its deficits and improve efficiency, while preparing for upcoming product launches linked to the metaverse.
The company maintains a robust cash position with over $58 billion in liquidity, and announced a new $25 billion share buyback program, reinforcing its commitment to shareholder value creation.
Fundamental Analysis
Meta is solidifying its strategic transition into a tech conglomerate focused on AI, personalized advertising, and immersive environments. Despite ongoing regulatory challenges in the U.S. and Europe—having yielded this time to Brussels—the company has maintained strong growth in daily active users (DAUs) and monthly active users (MAUs) across its core platforms: Facebook, Instagram, and WhatsApp.
Consistent investment in AI infrastructure and data centers, coupled with an improved operating margin now at 39%, positions Meta among the most efficient players in the tech sector.
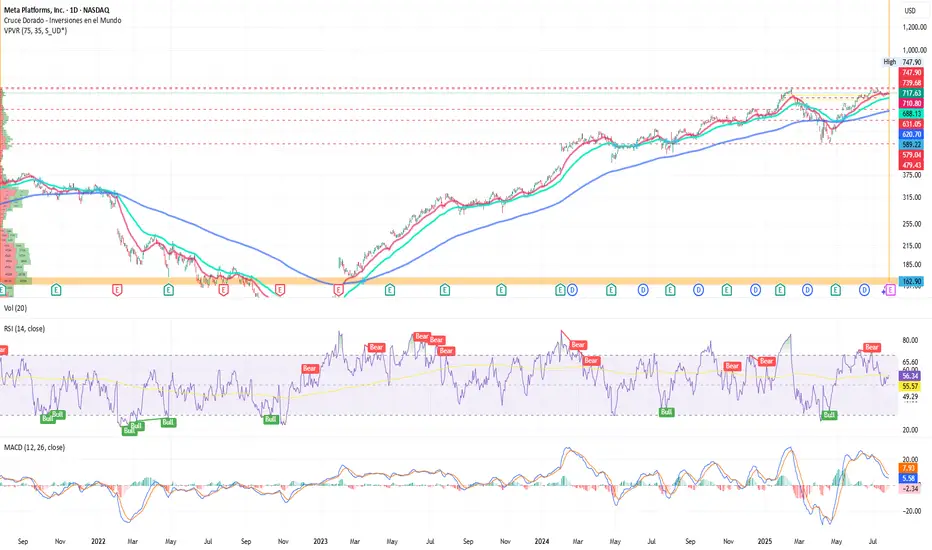
Technical Analysis
From a technical standpoint, Meta is currently trading around $717, following a near 50% rally since April. The daily chart shows a clear uptrend with higher lows in place since November 2022.
The RSI stands at approximately 56.34%, indicating strength without entering overbought territory.
The 50-, 100-, and 200-day moving averages remain aligned in a bullish formation.
The next resistance level is at the all-time high of $747.90; a breakout could pave the way toward $800 in the short term.
The key support level lies at $689, where the 100-day moving average and recent price action converge.
The Point of Control (POC) sits around $590, marking the base of the previous upward move and the recent golden cross that triggered the current rally.
Conclusion
Meta continues to affirm its leadership in the tech sector—not just as a social media powerhouse, but as a key player in the development and implementation of AI-based solutions. Revenue diversification, cost control, and a solid financial structure reinforce its position in an increasingly competitive market. While macroeconomic volatility and regulatory pressures remain, the combination of technical momentum and strong fundamentals suggests the bullish trend could continue.
*******************************************************************************************
La información facilitada no constituye un análisis de inversiones. El material no se ha elaborado de conformidad con los requisitos legales destinados a promover la independencia de los informes de inversiones y, como tal, debe considerarse una comunicación comercial.
Toda la información ha sido preparada por ActivTrades ("AT"). La información no contiene un registro de los precios de AT, o una oferta o solicitud de una transacción en cualquier instrumento financiero. Ninguna representación o garantía se da en cuanto a la exactitud o integridad de esta información.
Cualquier material proporcionado no tiene en cuenta el objetivo específico de inversión y la situación financiera de cualquier persona que pueda recibirlo. La rentabilidad pasada y las estimaciones no sinónimo ni un indicador fiable de la rentabilidad futura. AT presta un servicio exclusivamente de ejecución. En consecuencia, toda persona que actúe sobre la base de la información facilitada lo hace por su cuenta y riesgo. Los tipos de interés pueden cambiar. El riesgo político es impredecible. Las acciones de los bancos centrales pueden variar. Las herramientas de las plataformas no garantizan el éxito.
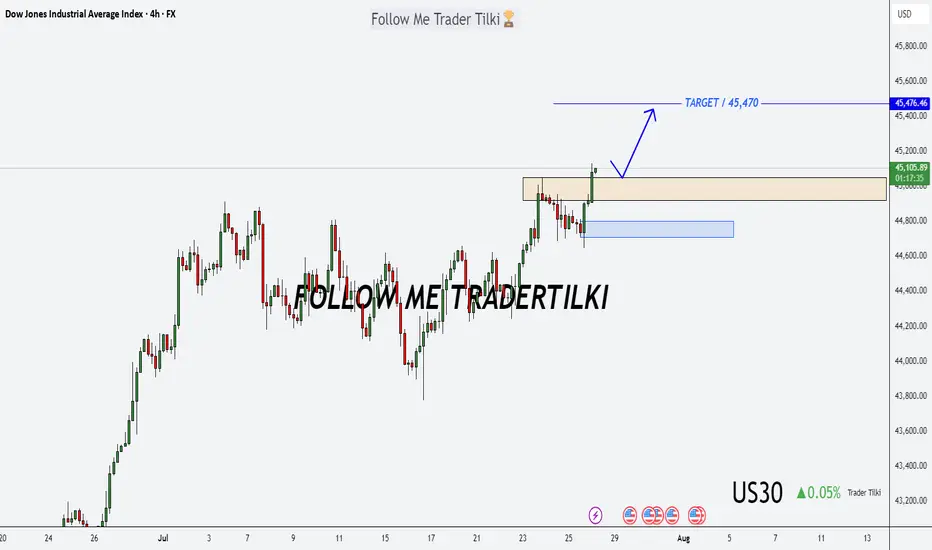
US30 Forecast: Target Locked, Buy Zones in Sight!Good morning friends ☀️
I've prepared a fresh analysis for US30 (Dow Jones).
My current target is 45,470. Even if the price dips to 45,050 or 44,800, I fully expect it to reach that 45,470 mark.
These levels represent strong buying zones and powerful retest regions—don’t forget that.
Every like from you is my biggest source of motivation to keep posting these insights. 💬📊
Big thanks to everyone supporting with a thumbs-up.
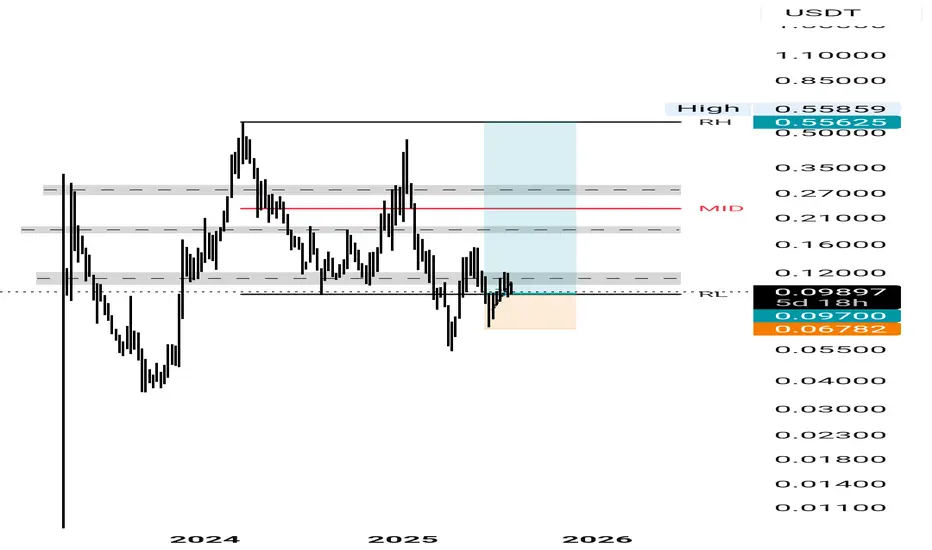
CGPT Buy Idea🔥 Hidden Gem Project Analysis – 5x Potential Play (2025-2026) 🔥
Project Name: (CGPT)
📊 Technical Breakdown (Chart Analysis):
1. Current Price Zone:
Trading at $0.09700.
Critical Support Level (RL): $0.06782 — This is the absolute last line of defense for bulls.
2. Resistance Zones:
Immediate Resistance: $0.12000 (Marked with grey zone)
Mid-Term Target: $0.22000 (MID line) — Historically, price reacts here.
Long-Term Target: $0.55625 - $0.55859 (RH/High) — This is the real breakout zone for a massive rally.
4. Potential Upside:
From current price ($0.097) to High ($0.558) — that’s a 5x - 6x potential rally.
Strong bullish structure forming — Any breakout of $0.12 will trigger fast moves to $0.22 and above.
🔍 Fundamental Narrative (Why This Project?)
Undervalued Gem — Ignored by mainstream, but smart money accumulating.
Major partnerships or exchange listings possible.
Project updates, tech upgrades, or token utility enhancements.
Low Market Cap — Easier for price to pump 3x-5x quickly.
> "🚀 This Coin is Quietly Accumulating Before Exploding 500%+!
Just like how PEPE and FLOKI started slow — this project is gearing up for a monstrous move.
Entry is loading… Don’t regret later when it’s at $0.50+! 📈
DM me for complete research! 📊"
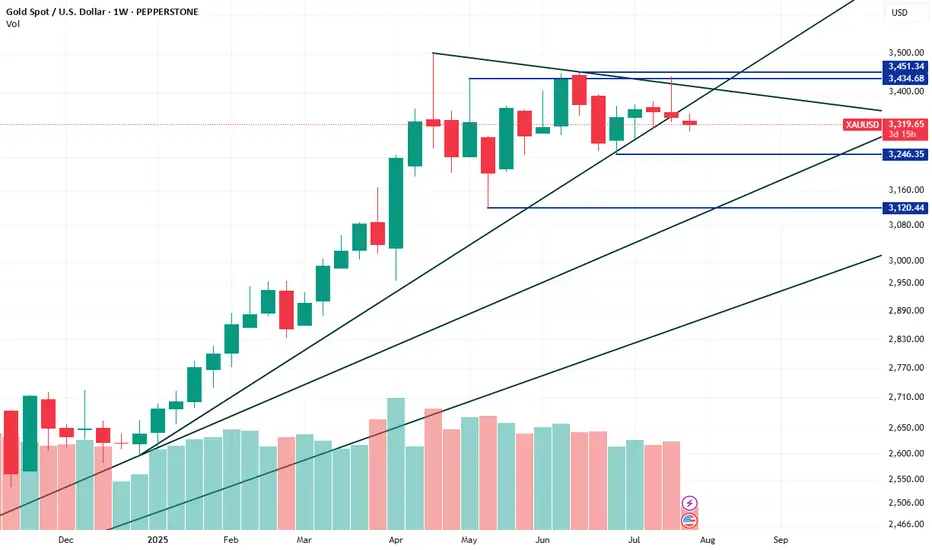
XAUUSD could potentially drop down to 3120XAUUSD has broken its most recent descending trendline on the Weekly chart, signaling a possible short-term reversal. It’s now approaching a higher-timeframe descending trendline, which could act as resistance. The next key demand zone is around 3246; if that fails, the more significant demand lies at 3120. Despite this pullback, the macro trend remains bullish. Notably, institutional traders increased their net long positions by over 40,000 contracts last week, bringing the total to more than 253,000, reflecting a potential shift in sentiment.
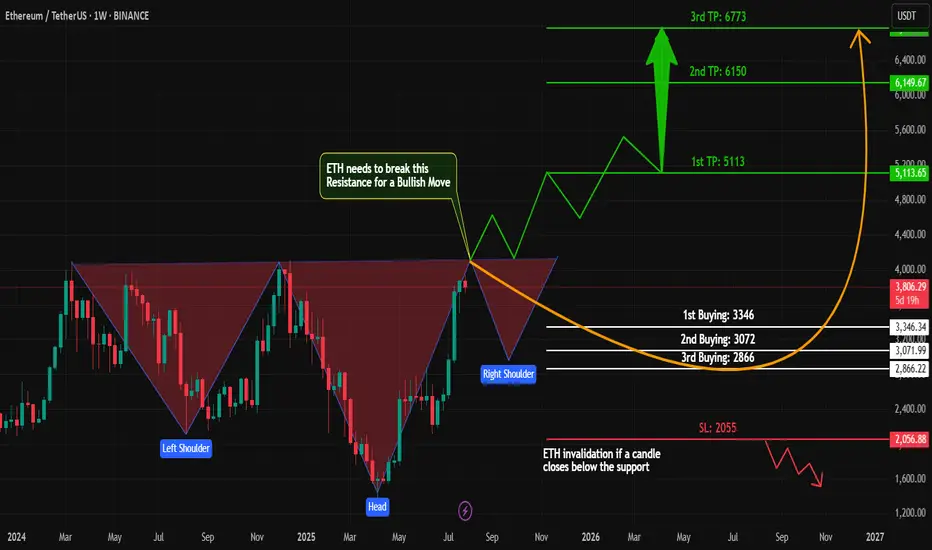
ETH Bullish – Inverse Head & Shoulders Pattern on Weekly Chart!Technical Analysis (Weekly Timeframe)
#Ethereum (ETH) is currently forming a strong bullish structure – the classic Inverse Head & Shoulders pattern – on the weekly chart.
✅ Left Shoulder ✅ Head
🟡 Now Printing the Right Shoulder...
This is a long-term spot trade setup, not for futures.
📈 Key Buy Zones:
1️⃣ First Buy: $3,346
2️⃣ Second Buy: $3,072
3️⃣ Final Support Buy: $2,866
We'll accumulate in these zones as #ETH forms its Right Shoulder.
🔓 Breakout Play:
Once #ETH breaks its All-Time High (ATH), we'll place a Buy Stop Order above the breakout level to ride the next big wave!
💬 Let me know what you think about this #ETH setup.
📌 Are you bullish on #ETH this cycle?
👍 Like, share & follow for more high-probability setups!
#ETH #Ethereum #CryptoTrading #TechnicalAnalysis #InverseHeadAndShoulders #LongTermTrade #SpotTrade #BullishCrypto #Altcoins #TradingView
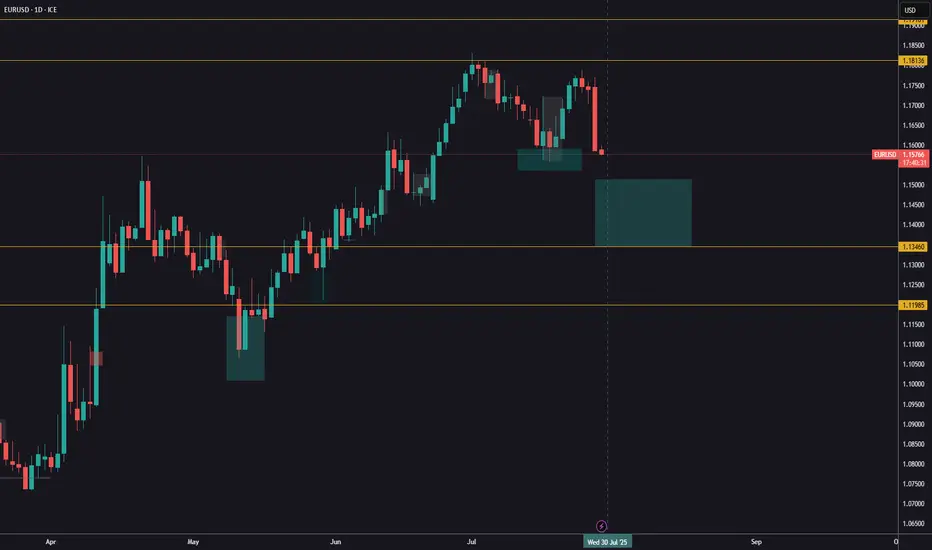
EUR/USD at a Turning Point:Rally or Trap for the Bulls?📉 Technical Analysis
Price has decisively broken out of the descending channel highlighted in recent weeks. The weekly support zone between 1.1540 – 1.1580 is holding, triggering a significant technical reaction. The weekly RSI has entered oversold territory, suggesting a potential short-term reversal.
Key Support: 1.1530–1.1580 (currently reacting)
Key Resistance: 1.1720–1.1780 (inefficiency & supply zone)
Base Case: Potential rebound toward 1.1720–1.1750 before next structural decision
🧠 Sentiment Analysis
82% of retail traders are long, with an average entry at 1.1635
Only 18% are short, a clear minority
This extreme imbalance suggests downside pressure may persist to flush out weak long hands before a genuine reversal takes place.
📊 COT (Commitment of Traders)
USD Index:
Non-Commercials increased both long (+663) and short (+449) positions → uncertain stance but slight USD strengthening
EUR Futures:
Non-Commercials increased long (+6,284) and short (+8,990) positions, but net increase favors the bears
This shift signals a bearish turn in sentiment among large speculators, indicating short-term downward pressure.
📈 Seasonality
In July, EUR/USD historically tends to rise, but:
This year’s price action is underperforming the seasonal pattern, showing relative weakness
August is historically flat to slightly bearish
Seasonality does not currently support a strong bullish continuation
✅ Strategic Conclusion
Current Bias: Bearish-neutral (with short-term bullish bounce expected)
A technical rebound toward 1.1720–1.1750 is likely (liquidity void + RSI bounce + retail imbalance)
However, 1.1720–1.1750 is a key supply zone to monitor for fresh shorts, in line with:
Dollar-supportive COT data
Overcrowded long retail positioning
Weak seasonal context
🧭 Operational Plan:
Avoid holding longs above 1.1750 without macro confirmation
Monitor price action between 1.1720–1.1750 for potential short re-entry
Clean breakout above 1.1780 → shift bias to neutral/bullish
Bitcoin BrokeBitcoin broke below the support area to liquidate high-leverage positions. The price has now regained the $118,000 area and is expected to move upward. The key resistance level is at $120,000.

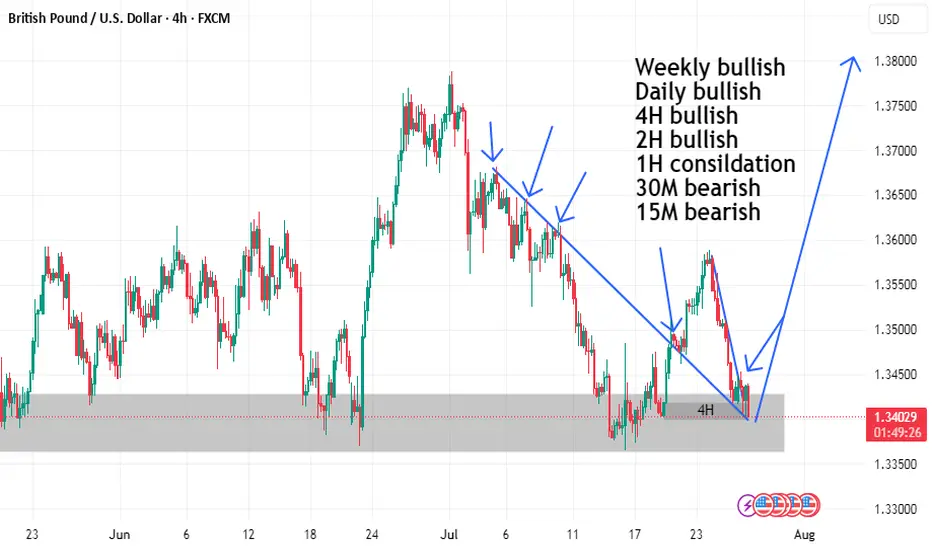
GBPUSD BUY TIGER SETUP LOOOOOOOOOOOONGwelcome
we have strong mitigation order block on time frame weekly and daily
and on 4H we have break downtrend and retest on it
and we in well discount area
and we have demand on high time frame
so this is good idea for buying
Don't forget to follow me
so that get refresh analysis
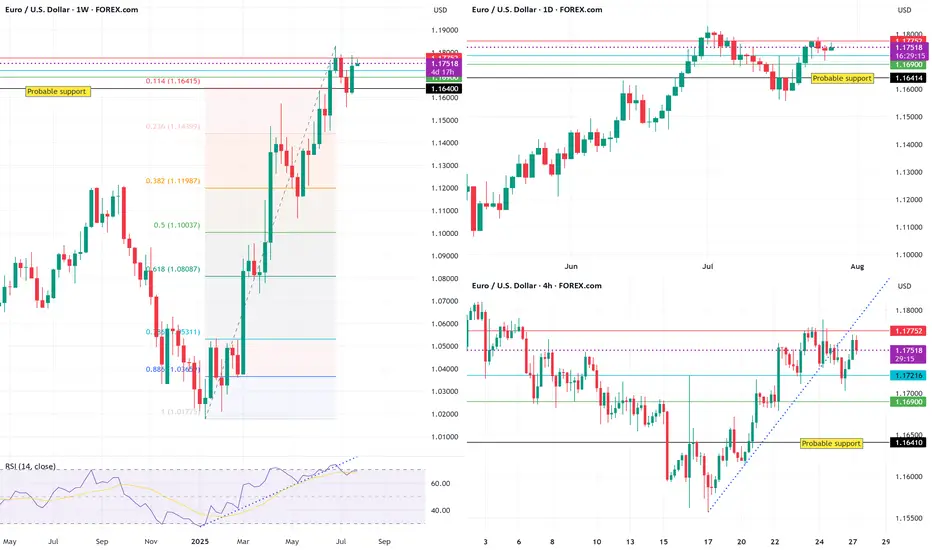
EUR/USD: Follow the yellow brick roadHello traders
I have utilized MTF(Multiple Time Frame) analysis for this idea in addition to the current fundamental environment.
The previous weekly levels can often be a good starting point for where this widely traded pair may head next.
On these charts, price has failed ahead of the weekly close of 1.1775. So far.
Fundamentally, the details of the USA/Euro Zone trade deal or framework for a deal, are not very clear yet. Which industries will be hit the hardest in Europe? Fine French wines, Stinky Swiss cheese, Monster M cars from BMW? Take your pick. In my mind, as a consumer, both the USA and the Old Country have significant strengths in different arenas.
As American consumers, we are now going to be forced to some degree to become price conscious one way or the other. Or maybe not. I'll still be sipping California, French or New Zealand wines.
As for the economy:
These "deals" DJT has made so far with Japan and the Euro Zone, once again, smacks of a strong arm policy, more than a reasonable and fair agreement. Time will be the deciding factor. As we have seen over time, trade agreements mean nothing. The WTO is a toothless institution.
The IEEPA ruling heads for the Federal Appeals Court this week and no doubt all the way to the Supreme Court.
However, based on the available information, I am observing the charts by looking back at how the markets react at the Sunday open. It tends to retest weekly OCHL levels first.
As for the USA/EURO zone deal, if it plays out according to news reports, it seems to be logical that a lot of Euros will have to be converted to USD.
But feel free to correct me.
Therefore, until Wednesday and the FOMC presser, I am short EUR/USD.
Best of luck.
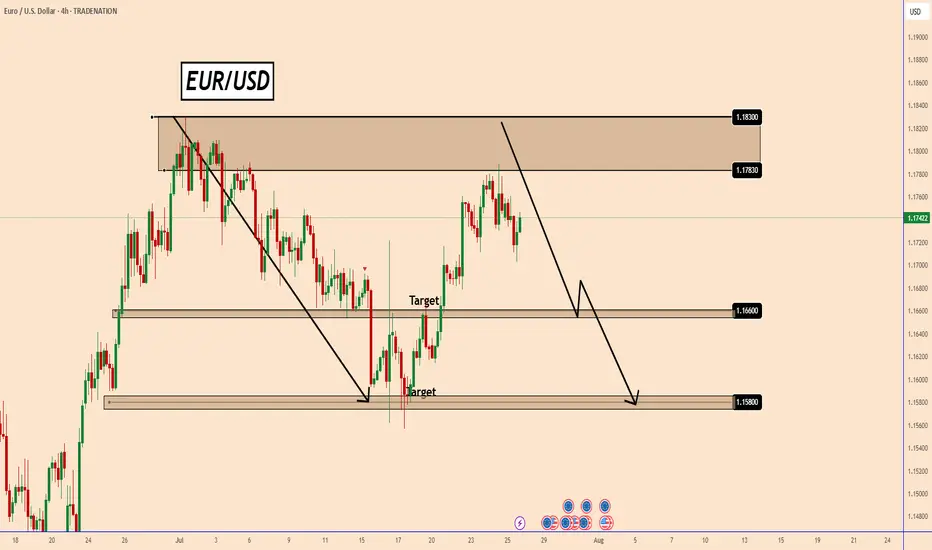
EURUSD may fall, but it's all about the FOMC DecisionEURUSD may fall, but it's all about the FOMC Decision
During the first 2 weeks of July, EURUSD fell from 1.18000 to 1.1550 and then the price rose again due to renewed tariffs.
Trump's comments regarding Powell and tariffs, according to which the EU and the US may reach an agreement soon, renewed the strength of EURUSD.
However, this time it is more related to the FOMC. If the FED cuts rates, EURUSD can drop further. When they didn't cut rates, the USD was weak or didn't move at all.
Let's see.
If Powell makes any surprises this time, EURUSD could fall, as shown in the chart, from 1.1800 to 1.1550, which is almost 250 pips lower.
Key support zones: 1.1660 and 1.1580
You may find more details in the chart!
Thank you and Good Luck!
PS: Please support with a like or comment if you find this analysis useful for your trading day
Disclosure: I am part of Trade Nation's Influencer program and receive a monthly fee for using their TradingView charts in my analysis.
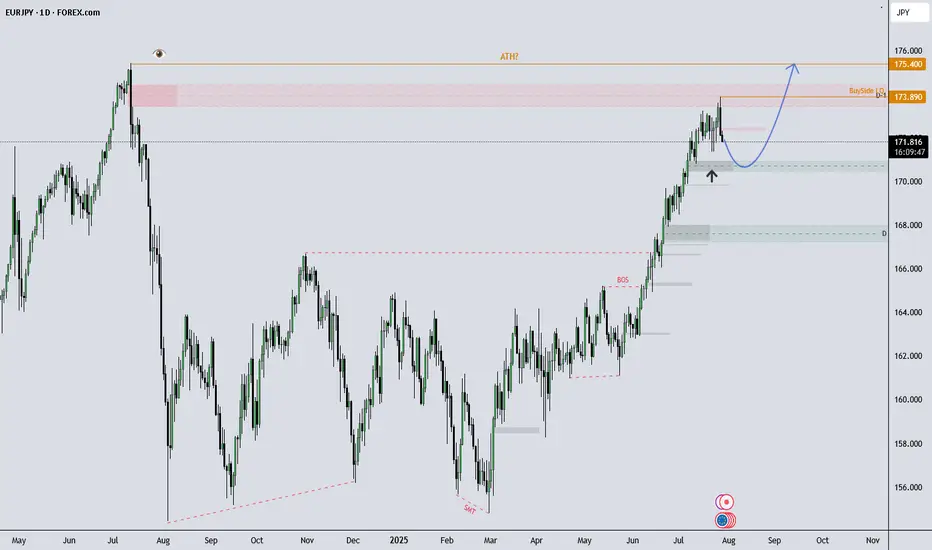
EURJPY Eyes New Highs After Pullback?What I see!
EURJPY Technical Outlook –
EURJPY remains in a strong uptrend and recently tapped into buy-side liquidity at 173.89, which now marks the All-Time High (ATH). After a brief rejection from that level, price is currently showing signs of a healthy pullback.
I’m observing the 170.00–171.00 zone, which aligns with previous demand. If price continues to respect this area, the overall bullish structure remains intact, with potential for a move back toward (and possibly beyond) the ATH.
A sustained break below 170.00 could indicate room for a deeper pullback, potentially toward the 168.00s, which would be a key area to monitor.
This analysis is shared for educational and discussion purposes only.
Singapore Dollar: Asia’s Quiet Safe Haven with Eyes on ParityThe Singapore dollar has quietly emerged as one of the strongest performers in Asia, gaining over 7% against the US dollar this year.
While much of the FX world fixates on the yen or franc in times of uncertainty, the SGD is carving out a niche as a regional safe-haven, driven not by size or liquidity, but by credibility.
The strength in the SGD isn’t just about USD weakness. Singapore's macro fundamentals
budget surpluses,
robust reserves, and
deep-rooted investor confidence
offer a kind of quiet strength that traders tend to overlook until it becomes obvious.
This makes the SGD a compelling hedge against both regional turmoil and global dollar decay.
As more global capital looks for stable homes outside of the traditional, Singapore’s financial system and currency are set to benefit.
The idea of SGD hitting parity with the USD, once dismissed as unrealistic, is now getting serious attention.
Analysts have suggested that it could happen within five years, but I wouldn’t be surprised if it comes sooner!
The greenback’s structural issues of twin deficits, political gridlock, and de-dollarization headwinds are no longer theoretical.
That said, liquidity is still a constraint. The SGD makes up just 2% of global FX turnover, and the MAS actively manages the currency to avoid excessive volatility.
This means that while the long-term trend favors SGD appreciation, traders betting on a rapid sprint to parity may be left waiting.
In my view, the SGD is one of the most underappreciated macro trades in FX.

Hold off on EURUSD for nowYesterday, EURUSD dropped over 150 pips following the trade agreement between the US and the European Union.
Tomorrow, the Fed is expected to announce interest rates, which could bring further volatility.
Avoid entering new positions at the moment and don’t overdo it with your lot sizes.
Once the news is out, there will be clearer and more confirmed trade opportunities.
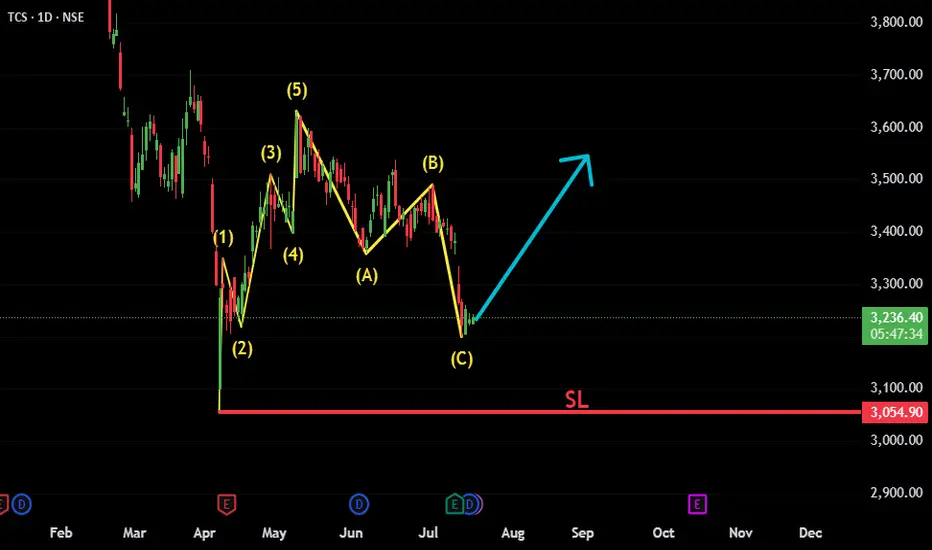
TCS: ABC Correction Complete – New Impulse Wave in FocusTCS appears to have completed a classic Elliott Wave structure, consisting of an initial 5-wave impulsive move followed by an A-B-C corrective phase. The recent price action suggests the correction has likely ended, and a new bullish impulsive move is beginning.
Fundamental trigger:
Interestingly, just a few days ago, TCS announced strong quarterly results — reporting solid profits and declaring a dividend. Despite the positive news, the stock reacted negatively and moved lower. This could have been a classic case of "good news, bad reaction" — possibly a stop-loss hunt or smart money absorbing liquidity before the next leg up.
Key technical points:
✅ Wave 1-2-3-4-5 clearly visible, forming the initial impulse.
✅ A-B-C correction appears complete with price reversing from a key support zone.
📈 Bullish structure forming; watching for confirmation with a break above recent highs.
🔍 Technicals and sentiment suggest renewed upside potential, despite short-term shakeouts.
Invalidation below recent swing low (Beginning of 1st Impulsive).
This setup offers a potential long opportunity with a favorable risk-reward
#TCS #NSE:TCS #ElliottWave #WaveAnalysis #TechnicalAnalysis #ABCCorrection #ImpulsiveWave #LongSetup #ChartAnalysis #NSEStocks #IndianStocks #Dividend #Earnings #PostEarningsMove #TrendReversal #SwingTrading #PriceAction #SmartMoney
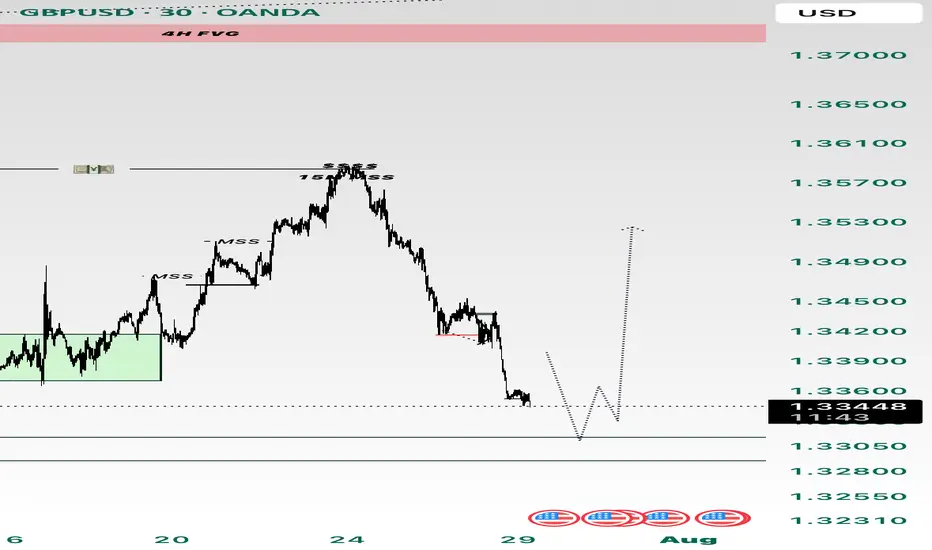
GBPUSDGBPUSD has taken liquidity and is heading towards the 2H ORDERBLOCK at 1.33140 once I’ve reached this zone I will take profit and go long. Taking into account jolts today so be careful of volatility and the possibility of long wicks. I can’t see anymore liquidity underneath so expecting big volume to the upside
Gold repeatedly tested lows. Will it break through?On Monday, the Asian market opened low and rose in the early trading. In the European trading, it rose to around 3345. The European trading was under pressure and fluctuated. The US trading began to accelerate its decline, and the lowest point reached around 3302. Then it continued to fluctuate in the range of 3300-3320.
On July 27, the United States and the European Union reached a framework trade agreement; the agreement reduced market concerns about the global economic recession, promoted the attractiveness of risky assets, and boosted the stock market and the US dollar. Although Trump has repeatedly pressured for a substantial interest rate cut, the market has strong expectations for a September interest rate cut. The current expectation of maintaining a stable interest rate dominates the market, coupled with the strength of the US dollar, which puts gold prices under downward pressure in the short term.
Gold opened low in the early trading on Monday and then rebounded to recover the losses, but then fell below the low again, and the daily line closed in the negative, and now it has formed a four-day negative decline. MA5 and 10-day moving averages form a dead cross, and there is a downward turn.
The focus on the upper side is around Monday's high of 3345, which is also near the current position of MA5, 20, and 30-day moving averages. Below this position, gold is weak; if it breaks upward, it is necessary to prevent the possibility of a rebound correction.
The lower support first focuses on the 3300 integer mark; secondly, focus on the area around 3285-3275.
Operation strategy:
Short near 3340, stop loss 3350, profit range 3320-3300;
Long near 3300, stop loss 3290, profit range 3320-3340.
Before the release of US data on Tuesday, you can maintain this operation strategy; after the data is released, adjust the strategy based on the impact of the data.