Gilead tie-up ,Big Pharma confidence,massive upside if trials OK
🧪 Pipeline Progress (as of latest update):
NX-2127 & NX-5948 in Phase 1 🔬
NX-1607: Promising early clinical data in solid tumors
Multiple preclinical programs in immuno-oncology and autoimmune space
Down ~80% from highs (2021 biotech bubble burst 😬)
Consolidating near lows — potential bottom fishing zone 🐟
High short interest = possible squeeze setup 🔥
Speculative high-reward biotech. Great long-term potential if pipeline delivers. Suitable for risk-tolerant investors only. Not for the faint-hearted 🧠⚡
Fundamental Analysis

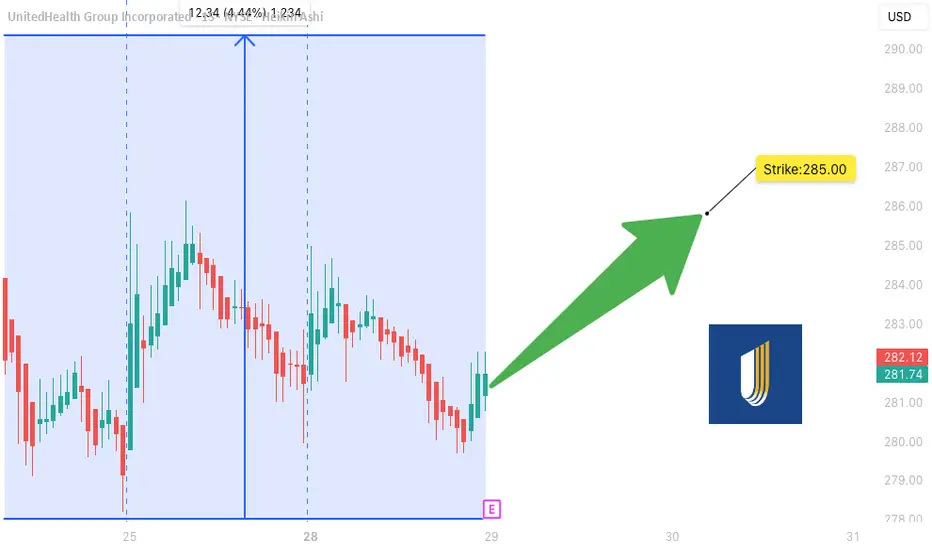
UNH Earnings Lotto Setup** (2025-07-28)
📊 **UNH Earnings Lotto Setup** (2025-07-28)
🎯 **Targeting a 2x return on post-earnings upside move**
---
### 💡 Trade Thesis:
**UnitedHealth (UNH)** is primed for a potential bounce on earnings:
* ✅ **Revenue Growth**: +9.8% YoY
* 🔥 **EPS Beat Rate**: 88% over last 8 quarters
* ⚠️ Margin compression risk from increased utilization
* 🧠 **Analyst Upgrades** trending positive
* 📉 RSI = **30.06** → Oversold territory
---
### 🔎 Options Flow & Technicals
* 🧲 Max Pain: **\$290**
* 🟢 Bullish call OI stacking at **\$285**
* ⚖️ IV Rank: **0.75** → Still has juice
* 🔻 Trading below 20D/50D MAs → Room for reversal
---
### 💰 Trade Setup
```json
{
"Instrument": "UNH",
"Direction": "Call (Long)",
"Strike": "$285",
"Entry Price": "$10.30",
"Profit Target": "$20.60 (2x)",
"Stop Loss": "$5.15 (50%)",
"Size": "1 contract",
"Expiry": "2025-08-01",
"Entry Timing": "Pre-Earnings Close (July 28)",
"Earnings Date": "2025-07-29 BMO",
"Expected Move": "±5%",
"Confidence": "70%"
}
```
---
### ⚖️ Risk/Reward
* Max Risk: 💸 \$1,030
* Max Gain: 🚀 \$1,030
* R/R Ratio: **1:2**
* Lotto-style with tight SL post-ER
---
### 🧭 Execution Plan
* 📅 Buy before close on **July 28**
* ⏰ Close same-day post ER **if target or SL hits**
* ❌ Exit manually if theta crush hits hard
---
### 🗣️ Final Note:
> “Oversold + Strong fundamentals + Positive consensus = Earnings bounce in the making.”
---
📌 Tag your UNH trades
💬 Drop your lotto setups
❤️ Like & repost if you're playing UNH this week!
\#UNH #EarningsPlay #OptionsTrading #TradingView #UNHEarnings #LottoTrade #CallOptions #HealthcareStocks #SwingTrade #RSI #IVRank #MaxPain
TLRY Earnings Play: Lotto-Style PUT Setup
📉 **TLRY Earnings Play: Lotto-Style PUT Setup**
*Tilray Brands (TLRY) - Earnings Due July 30 (AMC)*
🔻High risk. High reward. Possibly… nothing. But here's the setup:
---
### 🔬 Fundamental Breakdown:
* 💸 **TTM Revenue Growth**: -1.4% (🚩 declining)
* 📉 **Profit Margin**: -114.4%
* 🧾 **Operating Margin**: -16.8%
* 🧠 **EPS Surprise (avg 8Q)**: **-89.4%**, with only **12% beat rate**
* 🧯 **Sector Risk**: Cannabis = Over-regulated + Overcrowded
🧮 **Fundamental Score**: 2/10 → Broken business model.
---
### 📊 Technicals:
* 🔺 Above 20D MA (\$0.61) and 50D MA (\$0.49)
* 🔻 Well below 200D MA (\$0.91)
* 📉 Volume 0.72x = Weak institutional interest
* 📏 RSI: 57.69 (neutral drift)
**Technical Score**: 4/10 → Weak drift, low conviction.
---
### ⚠️ No Options Flow. No Big Bets Seen.
(But that’s exactly what makes this a clean lotto...)
---
## 🎯 Lotto Trade Idea:
```json
{
"Type": "PUT",
"Strike": "$0.70",
"Expiry": "Aug 1, 2025",
"Entry": "$0.10",
"Profit Target": "$0.50",
"Stop Loss": "$0.035",
"Confidence": "30%",
"Size": "2% portfolio max",
"Timing": "Pre-earnings close"
}
```
---
### 🧠 Strategy:
This is not a trade based on strength. It’s based on **TLRY’s consistent failure to deliver** — and if it disappoints again, we ride the downside. If not? Risk tightly capped.
---
⚖️ **Conviction**: 35%
💀 **Risk**: Total loss possible
🚀 **Reward**: 400%+ possible
---
📝 *Not financial advice — just one degenerate’s earnings notebook.*
💬 Drop your TLRY lotto plans below👇

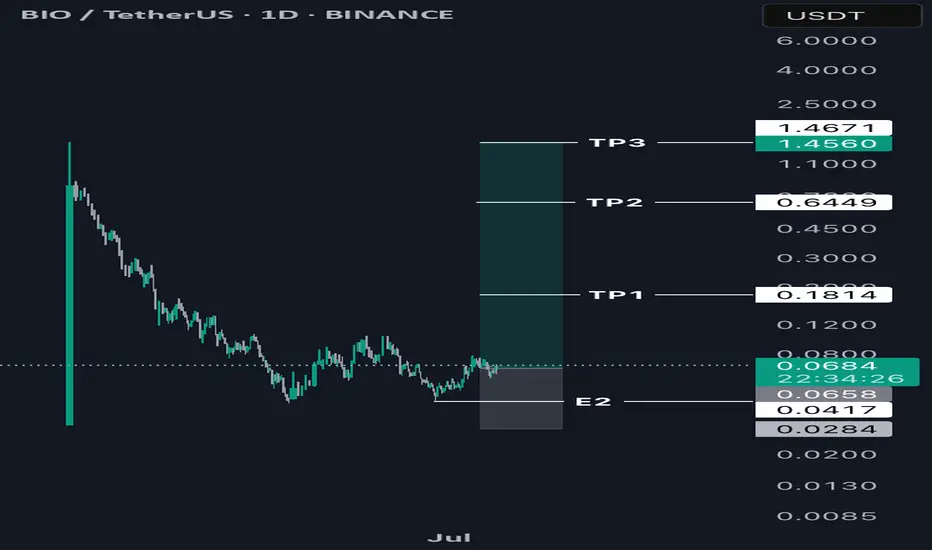
The Perfect Setup for a 90% Drop; Before a Massive RallyCoinbase just added NYSE:BIO to its roadmap a few hours ago. Based on past patterns, that usually means we’re 5–7 days away from a spot listing.
Here’s how I’m positioning for it — and a word of advice: avoid leverage on this one.
With a risk-reward of 37.17, you really don’t need it. Good luck.
CLS Earnings Play - Bullish Setup (07/28)
📈 **CLS Earnings Play - Bullish Setup (07/28)** 💥
💡 *Earnings Confidence: 75% | Sector: Tech/AI Hardware*
🚀 **THESIS**:
* 🔋 19.9% TTM revenue growth
* ✅ 8-quarter beat streak (avg. +11.5%)
* 📈 RSI > 50D/200D MA → Strong momentum
* 🧠 Sector tailwinds from AI/data infra
* 💬 Analysts lagging price → potential upgrades
📊 **OPTIONS FLOW**:
* 🟢 Calls piling at \$175 (institutions leaning bullish)
* 🛑 Some downside puts at \$170 (hedging only)
* 🧮 IV Rank: 0.65 | Expected Move: ±\$11
🔥 **TRADE PLAN**
> 🎯 **Buy CLS \$175 Call (08/01 Exp)**
> 💵 **Entry**: \$8.80
> 📈 **Profit Target**: \$26.40 (+200%)
> 🛑 **Stop Loss**: \$4.40
> ⏰ **Entry Timing**: *Just before earnings close* (07/30 AMC)
> 💼 **Size**: 2% of portfolio
📉 **Risk**: Moderate IV, downside if earnings miss.
📊 **Reward**: Strong beat history + AI trend = possible upside surprise.
🔔 **Watchlist it now. Execute near close 07/30.**

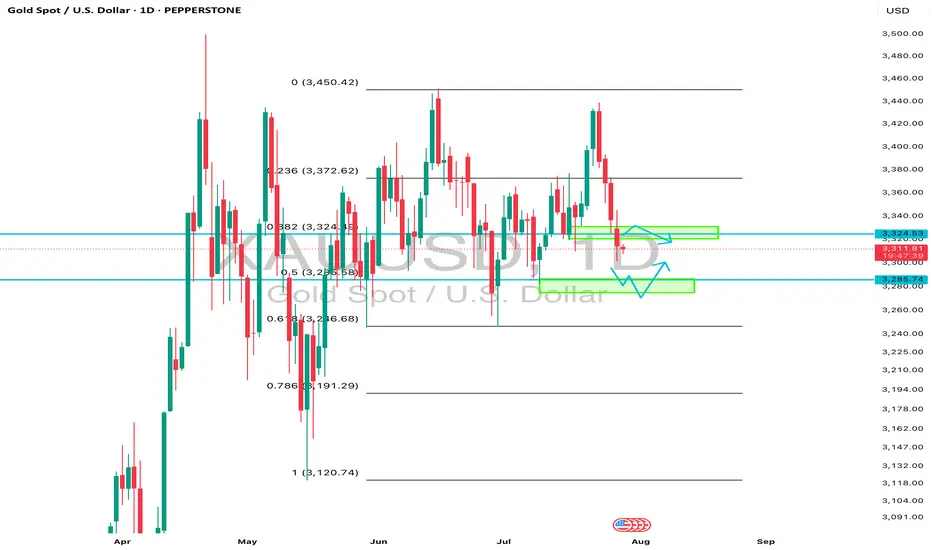
Daily Analysis- XAUUSD (Tuesday, 29th July 2025)Bias: No Bias
USD News(Red Folder):
-JOLTS Job Openings
Notes:
- Strong bearish closure
- Uncertainty on fundamentals
- Potential BUY/SELL if there's
confirmation on lower timeframe
- Pivot point: -
Disclaimer:
This analysis is from a personal point of view, always conduct on your own research before making any trading decisions as the analysis do not guarantee complete accuracy.
Trade management for NZD/AUDThe US-EU trade deal boosted USD demand and jolted FX markets at the open. This, coupled with low liquidity during the Monday Asian session caused a gap in this pair. Our short term trade was taken out at break even, while our medium term trade narrowly survived. This was a technical play in an odd pair, opportunistic while doing some charting :) I took profit at 1:1 and will wait to deploy capital elsewhere.

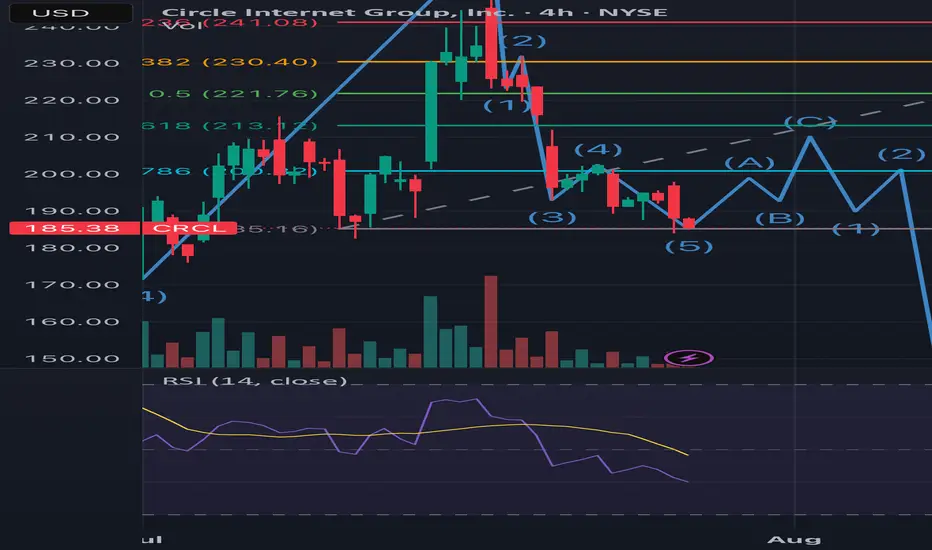
What goes around comes full CRCLFor the record, I bought in at ~$220 and looking to exit to ethical reasons. I believe that this stock will reach over $400USD for the end of the year but with every l opportunity left off for a greater cause, there will always be a greater reward.
1. Notice the end of the first 5 wave Elliot Impulse coincides with the passing of the GENIUS bill. Wave 3 peak was the ATH and wave 5 was the Friday peak of around $262.
2. We’ve entered the correction where sellers are looking to close from the hype
Wave 1 of the correction was the sell off from the wave 5 peak.
From the chart you can see the 3 wave correction is beginning with wave 1 of the 3 coming to an end.
Good news if you want to swing it to 213, this would be a good entry. Bad news if you want ito t hold it for ATH as it means you’d have to bear the third wave of the correction phase (gap fill ~$216), from there I’m expecting the huge sell off post earnings and FED expectations.
However, after retracing a new cycle will emerge led by major catalysts like the CLARITY Bill, CIRCLE’s bank charter application, USDT diminishing presence in the US and the adoption of USDC even possibly making it the standard stablecoin for all US crypto activity, DE-Fi growth and tradfi participation and growth in their MMF and remittance segments. This will kick start a new run where the highs of $400 will be achieved.
So target next high (earnings time) is $213. I assume price will not go below this region. But a recommended sell until q4
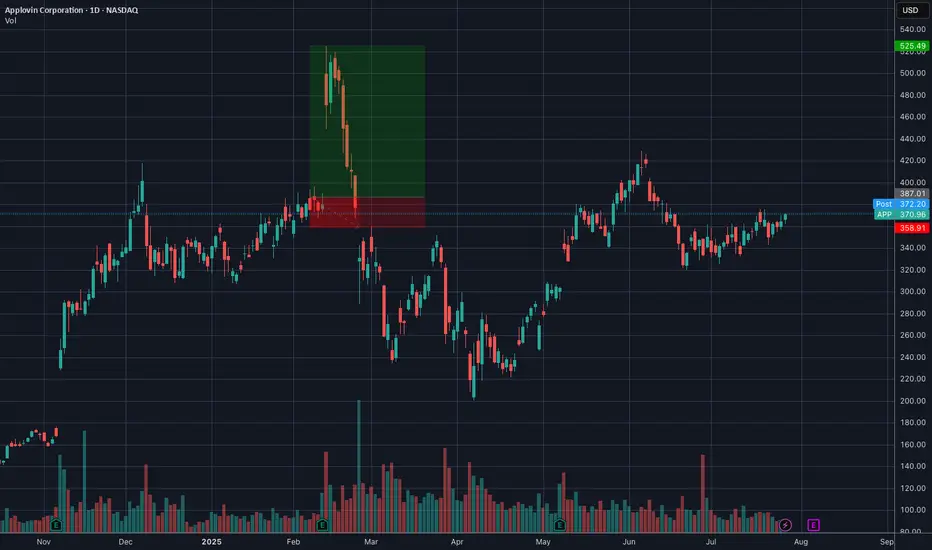
Buy Idea APP (Applovin Corp)Entry: $371 - 372
Stop: $342.50
Risk per share: $28.80
Earnings Catalyst Setup
• Flat base breakout above $370 zone, strong price structure
• Volume expanding into earnings — ideal for pre-earnings momentum pop
• Holding all major MAs: 21EMA, 50MA, 200MA clustered below
• MACD & Oscillators turning up, showing early momentum shift
• Institutional positioning appears supportive
• Earnings Date: ~9 days (6 Aug 2025 after mkt)
⚠️ Key Notes
• Pre-earnings breakout pattern, keep size light
• Possible re-rating if earnings surprise positively — watch for revenue growth in AI/game ads
• Sell partial above 1R to de-risk, trail rest
DISCLAIMER : The content and materials featured are for your information and education only and are not attended to address your particular personal requirements. The information does not constitute financial advice or recommendation and should not be considered as such. Risk Management is Your Shield! Always prioritise risk management. It’s your best defence against losses.
Dollar General | DG | Long at $90.00Dollar General NYSE:DG took a massive hit this morning after revising their future earnings guidance. The economy is showing many signs of a recession, and this is a clear warning. From a technical analysis perspective, it has retouched my "crash" simple moving average and may dip further into the $80's in the near-term. But, like many overall strong companies that suddenly plummet, I view this as a future opportunity given the strength of NYSE:DG as a business (holistically). Dollar General is the only grocery and home goods store around in many rural locations. So, while there is doom and gloom in the near-term, Dollar General is in a personal buy zone at $90.00. I view this as a starter position, though, with the potential for future declines/opportunities for additional share accumulation in the near-term.
Target #1 = $100.00
Target #2 = $122.00
Target #3 = $200.00+ (very-long term outlook...)

GE Healthcare Technology | GEHC | Long at $62.25GE Healthcare Technology $NASDAQ:GEHC. An aging and unhealthy population will only create an increased need for healthcare imaging services. Add AI to the diagnostic mix, and imaging will be imperative for routine health maintenance and screening. With a P/E of 15x, debt-to equity of 1x, earnings forecast growth of 8.36% per year, and bullish analyst ratings, this could be a good value play for the patient.
Thus, at $62.25, NASDAQ:GEHC is in a personal buy zone. Further drops are possible if trade wars make imaging materials/technology difficult to obtain, but that general statement applies to the whole market at this time...
Targets:
$70.00
$78.00

07/28/25 Trade Journal, and ES_F Stock Market analysis EOD accountability report: +405
Sleep: 5 hours
Overall health: meh
VX Algo System Signals from (9:30am to 2pm)
— 9:00 AM Market Structure flipped bullish❌
— 10:04 AM VXAlgo ES X1 Buy signal! ✅
— 11:21 AM Under 6424, the structure is bearish. Don't avg down! ✅
— 11:40 AMVXAlgo NQ X1 Buy Signal! ✅
— 12:40 PM VXAlgo NQ X1DD Sell Signal! ✅
— 1:30 PM VXAlgo ES X3DD Sell Signal! ✅
What’s are some news or takeaway from today? and What major news or event impacted the market today?
Today was one of the few short the resistance day and refreshing to see after we been grinding ATH (all time highs)
News
Eu trade deal over the weekend,
& china tariff extension.
What are the critical support levels to watch?
--> Above 6395= Bullish, Under 6374= Bearish

7/28/25 - $bmnr - mNav more reasonable now (1.3x at ~$30/shr)7/28/25 :: VROCKSTAR :: AMEX:BMNR
mNav more reasonable now (1.3x at ~$30/shr)
- i'd link the docs but tradingview wants you to do the digging and doesn't want me to "promote" doing your own DD. ironic.
- so here's how you get there
- go the sec dot gov website search edgar in google
- type in the ticker
- check out the latest 8K
- click presentation
- slide 30 shows "BMNR NAV Detail"
- about 23 bucks per share NAV on fully diluted shares
- AH this thing trading at $30 ish... so 1.3x mnav
- considering view that ETH becoming a captured/ "knighted" winner by the tradfi gremlins, $10k/eth or higher not unlikely this cycle
- this type of "ROE" on a Kc of probably 10-15% means a 3..4...5x mNAV at cycle top not unreasonabl
- so if ETH declines here 50% (also reasonable to expect the worst, you're at $10-15/shr assuming mnav toward 1)... and then a say 2x mnav on $10k/eth would mean shares (considering no additional moves/ accretion from here - also unlikely and conservative) would mean a 4x on the current share px so conservatively that's $100 again.
- does it get to ATH?
- honestly the way that euphoria trades if we make a run for $100... probably yeah moar ATH, but that's unlikely to happen ST unless ETH has a monster run (and it already has)
- nevertheless... i'm finally (VERY) slowly adding this to my exposure, which for me means 50 bps at the AH px of $30.
V

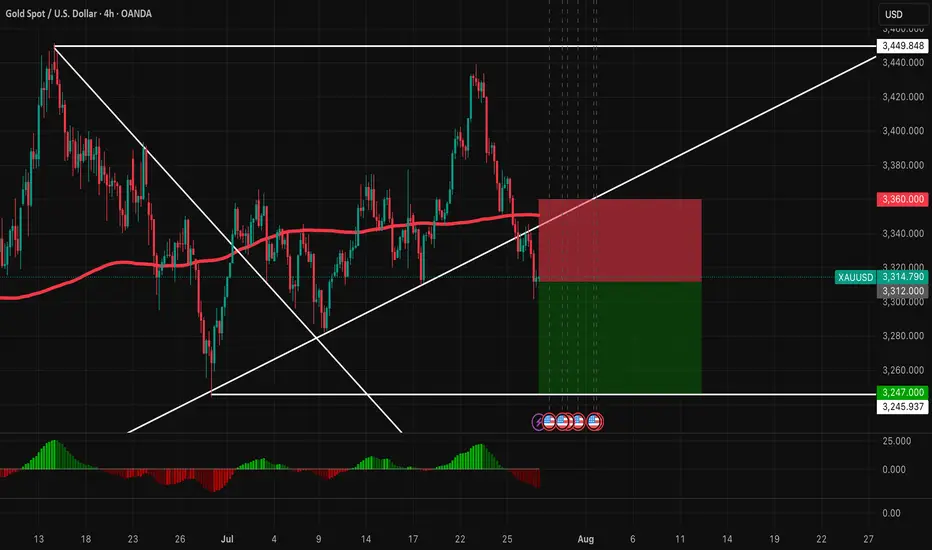
XAUUSD Bearish BreakoutGold (XAUUSD) has broken below the ascending trendline and is currently trading under the 200 EMA—confirming a shift in short-term momentum. A clean bearish rejection was observed on the retest.
* Breakout from rising wedge pattern
* 200 EMA acting as dynamic resistance
* MACD histogram showing increased bearish pressure
* Resistance: 3,360
* Support: 3,247 – 3,245
Risk-to-reward setup is favorable for a short trade.
Gold remains under pressure due to a stronger U.S. dollar and higher bond yields. The latest economic data (GDP and durable goods orders) reinforced expectations that the Federal Reserve will keep interest rates elevated, reducing demand for gold.
* USD strength supported by robust macro data
* Real yields remain high, weighing on gold
* Central bank demand subdued
* No significant geopolitical risk to drive haven flows this week
Market sentiment is bearish unless we see a dovish shift from the Fed or surprise risk events.
🎯 **Trade Setup**
* Sell Entry: 3,314
* Stop Loss: 3,360
* Take Profit: 3,247
* Risk\:Reward: \~1:2
📌 **Bias:** Bearish (Short-Term)
Price action remains weak below the 200 EMA and key structure. Expect continuation to the downside toward 3,247 support.
Rest and waitThe daily structure in the S&P 500 implies a rest and wait structure for Tuesday. This would mean that the S&P 500 would trade inside the Monday range on Tuesday as the market prepares for a tremendous amount of fundamental information coming out this week.

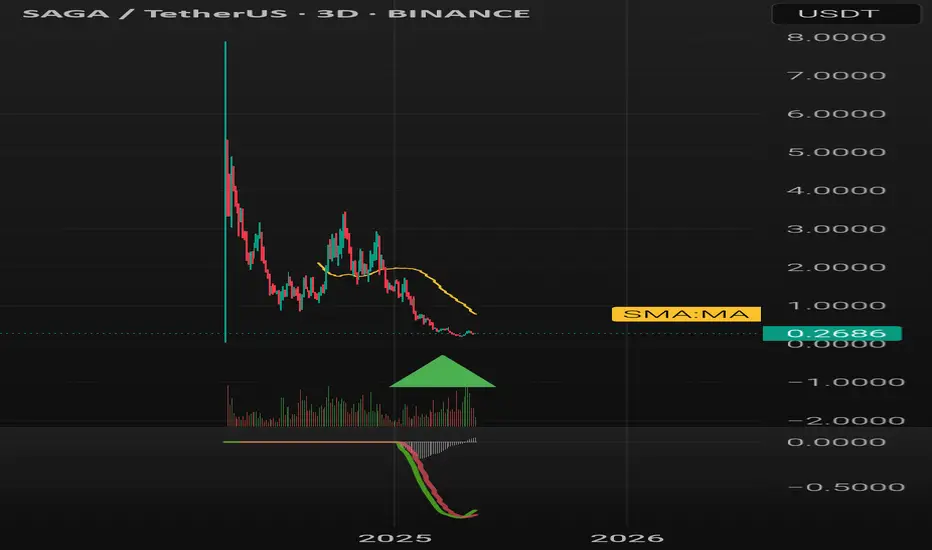
SAGAUSDTNow is the time to buy and hold with low risk.
Target: 0.70
Stop-loss: Weekly candle close below 0.17
I'm just sharing my personal opinion to help us all better understand the market’s potential.
Always do your own research before investing — don’t rely solely on my view as a beginner, or anyone else's, even top analysts.
No one can predict the future with certainty.
Wishing peace and clarity to everyone.
Amd - New all time highs will follow!🪠Amd ( NASDAQ:AMD ) rallies even much further:
🔎Analysis summary:
After Amd perfectly retested a major confluence of support a couple of months ago, we saw a textbook reversal. This retest was followed by a rally of more than +100% in a short period of time. But considering all the bullish momentum, Amd is far from creating a top formation.
📝Levels to watch:
$200
SwingTraderPhil
SwingTrading.Simplified. | Investing.Simplified. | #LONGTERMVISION

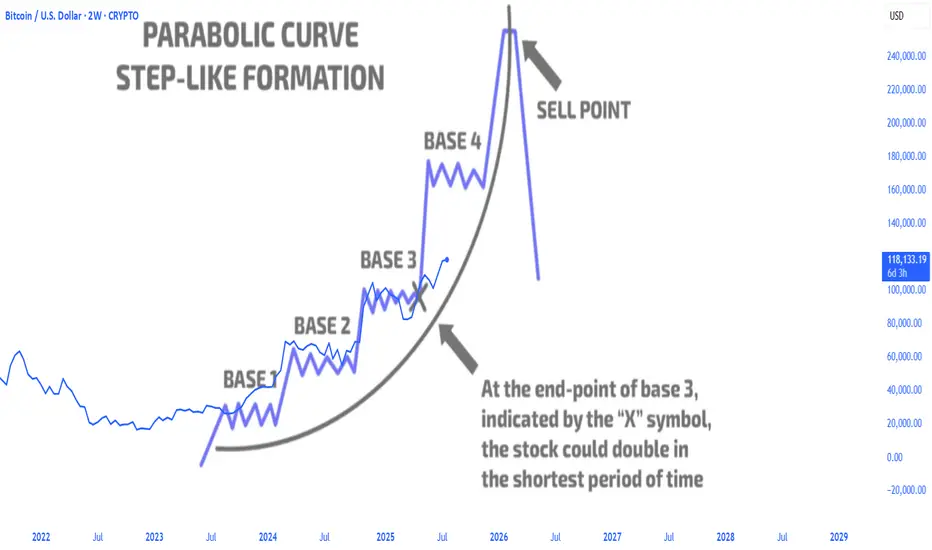
btc parabolic curvebitcoin parabolic curve pattern exits the base3 accumulation area and continues to rise sharply, with more to come
Meta - The breakout in question?🪓Meta ( NASDAQ:META ) is retesting major structure:
🔎Analysis summary:
After Meta perfectly retested a major previous support trendline in 2022, the trend shifted bullish. We have been witnessing an incredible rally of about +700% with a current retest of the previous all time highs. Time will tell but a bullish breakout remains quite likely.
📝Levels to watch:
$750
🙏🏻#LONGTERMVISION
Philip - Swing Trader

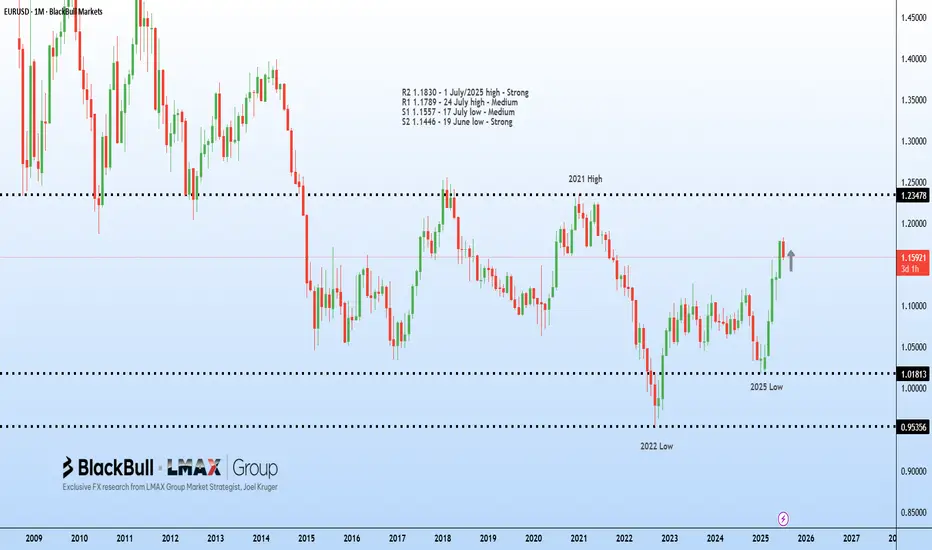
EU faces new tariffs, Euro slides | FX ResearchThe euro surged in early Asian trade following the US–EU trade agreement announced over the weekend, but has since faced consistent selling pressure, eventually triggering stop-loss orders below 1.17, reflecting a classic buy-the-rumour, sell-the-fact market reaction.
The deal imposes 15% tariffs on most EU exports to the US, down from 25% for automobiles, while excluding pharmaceuticals and medical metals, with semiconductors still under review. The EU committed to buying $750 billion in US energy products over three years, investing further in the US, opening markets with zero tariffs, and purchasing significant US military equipment.
The EU trade commissioner noted the deal provides business predictability despite higher tariffs than the previous 4.8% average. German automakers, including Mercedes-Benz, acknowledged some relief but highlighted ongoing costs, while Spain's PM offered lukewarm support.
Meanwhile, South Korea is preparing a trade package focusing on shipbuilding cooperation, and US–China tariff talks resume in Stockholm. The US dollar's trajectory may shift with this week's FOMC updates, Q2 GDP, core PCE, inflation, and non-farm payrolls data. While a light-data Monday features only the Dallas Fed manufacturing survey.
Exclusive FX research from LMAX Group Market Strategist, Joel Kruger
7/28/25 - $bynd - Fart coin without the cows7/28/25 :: VROCKSTAR :: NASDAQ:BYND
Fart coin without the cows
- over a $1 bn enterprise value
- no sales growth
- bill gates
- burns 100 mm a year
- nobody eats this product
- same valuation as fartcoin but fartcoin doesn't burn cash
- almost obviously going to zero
- but it's impossible to short
- if i owned it, i'd probably need an intervention, but beyond that... i'd dump it for anything *literally* treasuries, even XRP...
- just a PSA
- while not related... take NASDAQ:GAMB for instance.
- trades at less than 1/4 of the valuation. has 2/3 of the sales. 3x the gross profit. 15% fcf yield next year. but, this market is currently in the look here, over there, "it's only $3 and that one is $11" phase.
- this too... shall... pass.... and... "yes it's your fault you own this" at this stage, nobody else to blame.
V

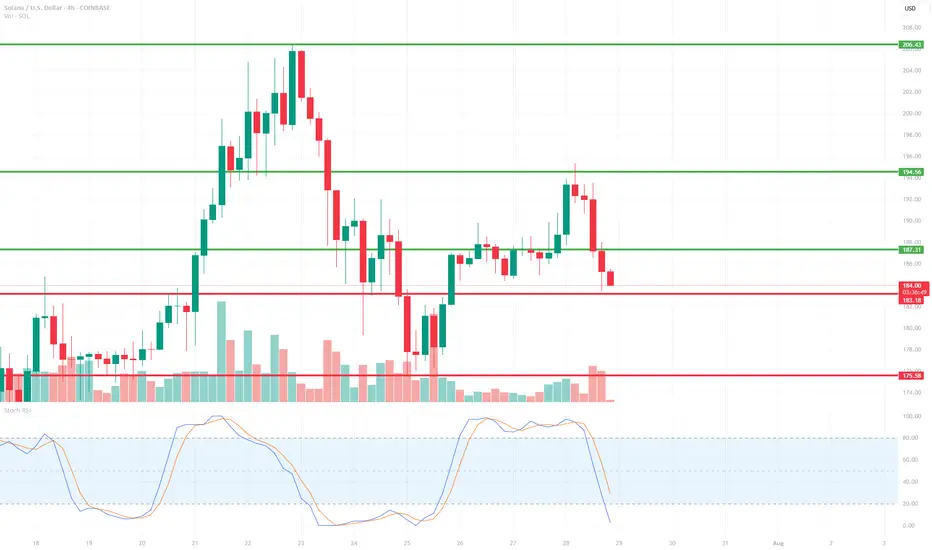
SOL/USD 4H📉 Price
Current price: approximately $183–$184
We see a decline from the resistance zone around $194.56. The price has broken through support at $187.31 and is heading towards lower support at:
🔴 $183.18 – local support (being tested now),
🔴 $175.58 – key support (potential target if current support breaks).
📊 Market structure
Short-term trend: Downtrend (lower highs and lower lows after a rebound from $194.56).
Volume: Increased volume on bearish candles – confirming supply pressure.
Previous trend: Uptrend with strong momentum from July 18th to July 21st.
🔁 Technical Levels
Resistance:
🟢 USD 187.31 – last broken support, now acting as resistance.
🟢 USD 194.56 – strong resistance (tested twice).
🟢 USD 206.43 – local high, strong resistance level from higher timeframes.
Support:
🔴 USD 183.18 – currently being tested.
🔴 USD 175.58 – stronger support from lower swing highs.
📉 Stochastic RSI
Located in the oversold zone (<20) and pointing down.
No upside crossover yet → no buy signal yet.
If a reversal occurs, a technical rebound is possible.
📌 Conclusions and Scenarios
🔻 Downside scenario (more likely currently):
Breakthrough of support at $183.18 ➜ further decline to $175.58.
Potential entry into a correction of the entire upward movement from July 18-21.
🔺 Upside scenario (alternative):
Support at $183.18 held + Stoch RSI signal ➜ rebound to $187.31.
If buying volume increases, a retest of resistance at $194.56 is possible.