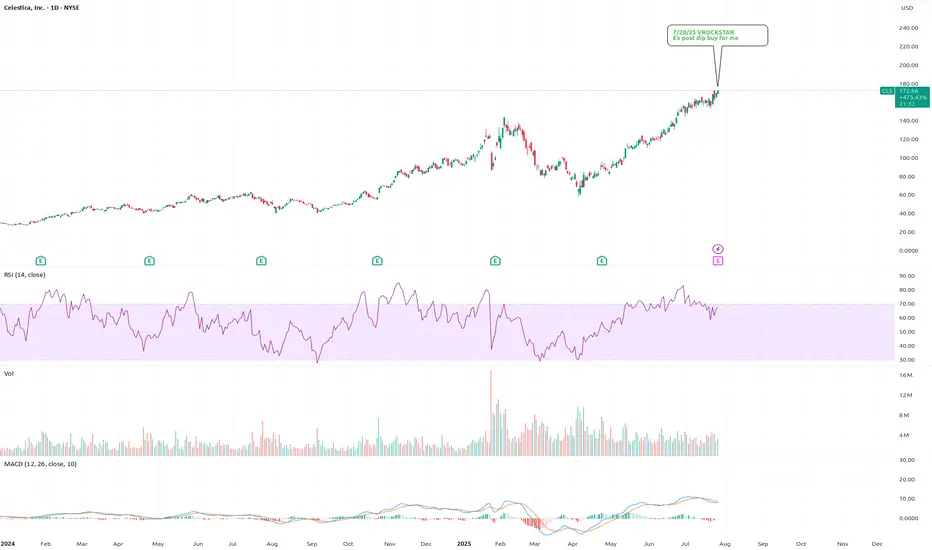
7/28/25 - $cls - Ex post dip buy for me7/28/25 :: VROCKSTAR :: NYSE:CLS
Ex post dip buy for me
- reminds of NYSE:GEV , great product, backlog, growth etc. etc.
- valuation at 2.5% fcf yield, low leverage and mid teens EBITDA for teens EBITDA growth++ is v reasonable
- don't really have an edge here, except to say.. i think any "miss" will quickly get bot and that's where i'd participate
- otherwise i think it's probably a beat/ should head higher all else equal
V
Fundamental Analysis
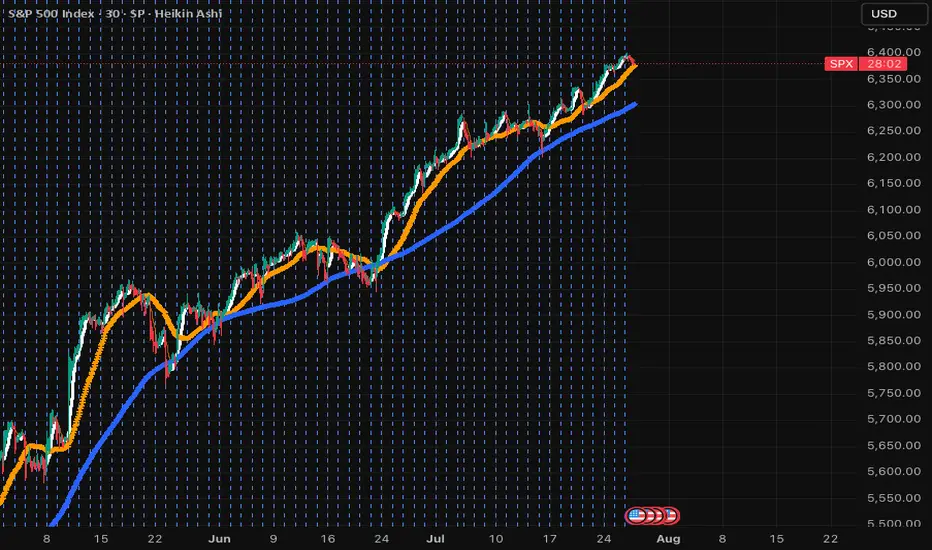
SPX....what goes up, must go downThis is long overdue. SPX has just crossed 9SMA, next 50SMA then 200SMA. Won't be surprised if it knocks each very soon. This will be a big week and tariffs are going to start hitting; even though this was mostly artificial and Americans are paying 90% of it! When in doubt, sell and park in money market! The next dip will hit hard and deep. Don't let the small wins overshadow the deep issues in the economy. Overpriced market and many lagging indicators will soon hit and default rates that are coming out are scary! Stay safe and don't get emotional over any stock. If it dips, you can always buy it cheaper.
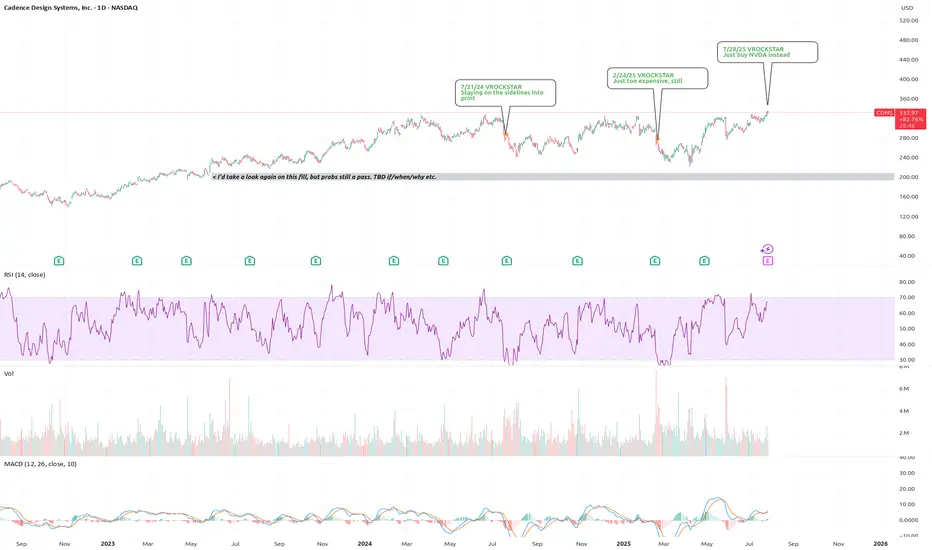
7/28/25 - $cdns - Just buy NVDA instead7/28/25 :: VROCKSTAR :: NASDAQ:CDNS
Just buy NVDA instead
- higher multiples
- less growth and less fcf generation
- technically an industry-float-higher-beneficiary
- but if you look at my last notes... stock has really not gained much ground vs. say SPY or QQQ
- you're one bad print away from this thing going -15 or -20%. does it happen this Q? no idea. but you will struggle to buy that dip aggressively. and if it rips? can you keep it? tough call.
- sidelines.
- gl to longs.
V
Looking at monthly chart on SCMI I see 3 white soldiers to $100Not that much to describe as the three white soldiers on the monthly candle chart are pretty self explanatory. One of the more basic readings for good times ahead. That’s aside from the fundamentals of having most of the ai data centers using its liquid cooled state of the art chassis’ designed for latest Nvidia chips.
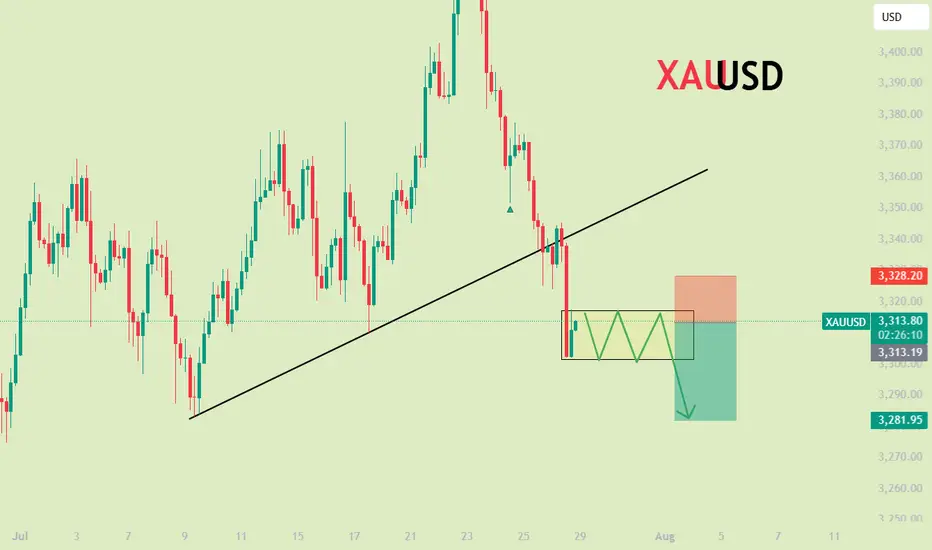
XAUUSD
XAUUSD Updated in 15M :
The gold signal is marked on the chart based on the latest price changes and the supply and demand in the market. These points include the entry point, stop loss, and take profit
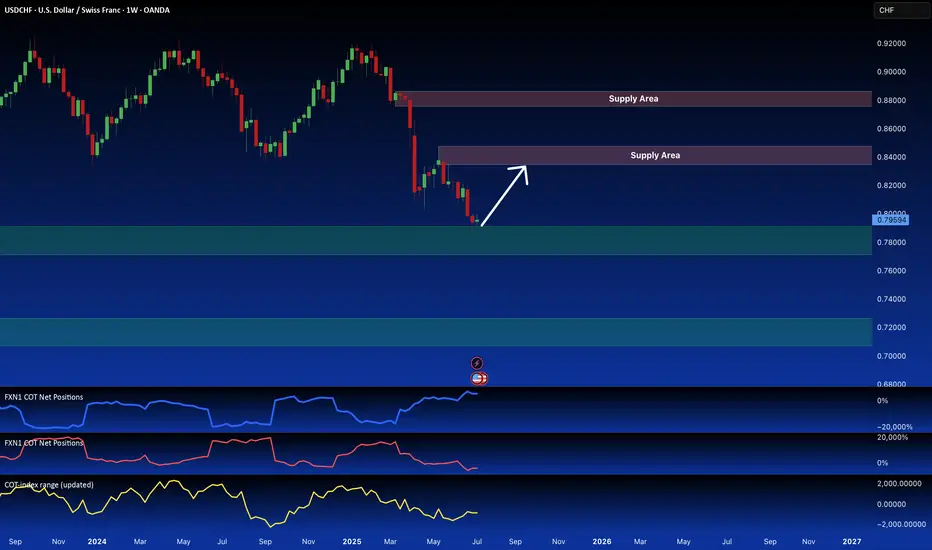
6S1! Futures Divergence Signals USD/CHF Long OpportunityI'm anticipating a bullish USD/CHF move. We're seeing a retest of a key daily demand zone, which is reinforced by a weekly supply area from the futures market (6S1! contract). Futures data suggests significant retail investor bullishness, contrasting with bearish positioning from commercial and hedge funds. This divergence suggests a potential long opportunity. I've also highlighted the next key demand area on the CFD USD/CHF chart.
✅ Please share your thoughts about 6S1! in the comments section below and HIT LIKE if you appreciate my analysis. Don't forget to FOLLOW ME; you will help us a lot with this small contribution.
Good buying area for DuolThis is a good area to buy Duol, Monthly and Quarterly supports are at 327, could it go lower? Sure it could always go lower, i wouldn't be that shocked if it got into the 200s. This is a very efficient company with no debt, it's rule of 40 score is close to another huge winner of mine, PLTR. I will always buy monthly/quarterly levels on companies like this. I think this could trade in the 600s by the first half of next year.

DCA ZoneFinally a new Starbucks competitor has arrived! Here's my possible DCA zone. I may have to settle for around $30, watching the RSI to see how it looks along the way
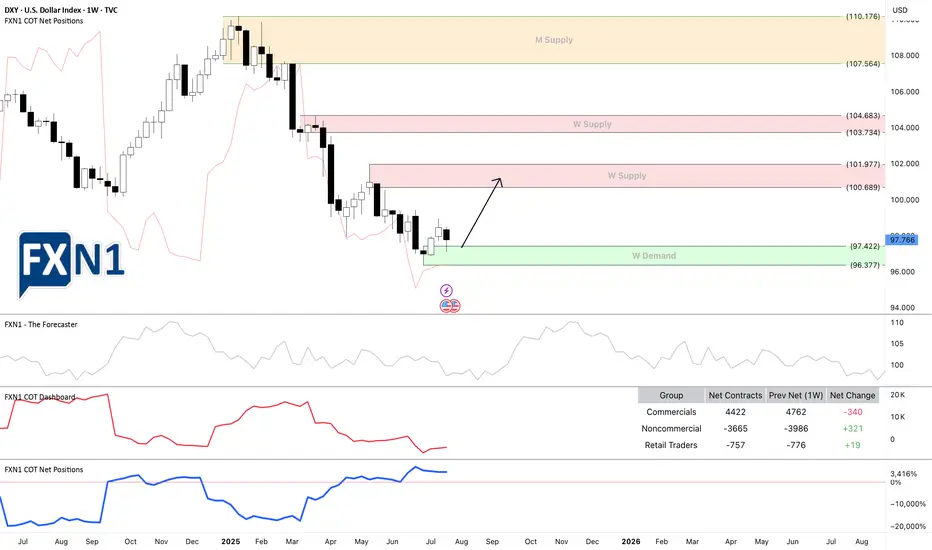
DXY: USD Flexes Muscle - Pairs SlideFriday, July 25, 2025
The foreign exchange markets are experiencing a pronounced USD bullish session this morning, with the US Dollar Index (DXY) showing robust gains of +0.35% while simultaneously pressuring all major currency pairs into negative territory. The Japanese Yen (JPY) is bearing the brunt of this dollar strength, currently registering losses between -0.4% to -0.66% across JPY pairs. This market behavior suggests traders should pay particularly close attention to DXY dynamics, as its movements will likely dictate price action across all major currency pairs in today's session.
Technical Perspective: DXY at Critical Inflection Point
A detailed examination of the Dollar Index reveals several compelling technical factors that market participants should consider:
1. Weekly Demand Zone Reaction
- The DXY has demonstrated a strong rejection from a significant weekly demand area
- The subsequent bullish spike indicates potential continuation of upward momentum
- This price action suggests institutional buyers are defending this key level
2. Commitment of Traders (COT) Report Insights
Non-commercial traders (typically hedge funds and speculators) have increased their positions from a bottom level not seen since June 2021 meanwhile the Commercial traders (often corporations hedging FX exposure) show opposing extreme positioning. This stark divergence between trader categories often precedes significant market moves
3. Seasonal Patterns Favor USD Strength
- Historical seasonal analysis indicates the current period typically supports dollar appreciation
- The combination of technical and seasonal factors creates a potentially powerful bullish setup
✅ Please share your thoughts about DXY in the comments section below and HIT LIKE if you appreciate my analysis. Don't forget to FOLLOW ME; you will help us a lot with this small contribution.
MSTR WEEKLY OPTIONS SETUP (2025-07-28)
### 🔻 MSTR WEEKLY OPTIONS SETUP (2025-07-28)
**Bearish Divergence with High Confidence — Time to Strike with a PUT?**
---
📊 **Momentum Recap:**
* **RSI:** Bearish 📉
* **Volume:** Weak (institutional exit risk)
* **Options Flow:** Mixed (calls > puts, but no alignment with price)
* **Sentiment Models:** Split 4:1 → **Only Claude/Anthropic** goes bearish with conviction
🧠 **Model Consensus:**
> “Momentum is weak, volume fading, and no upside confirmation = bearish edge.”
---
### ✅ SETUP OVERVIEW
* 🔍 **Trend:** Bearish (declining RSI)
* 📉 **Volume:** Weak = reduced institutional conviction
* 💬 **Options Flow:** Bullish bias, but **contradicts price trend**
* ⚙️ **Volatility:** Elevated, potential reward for directional plays
**Overall Bias:** 🔴 *Moderately Bearish*
---
### 💥 TRADE IDEA: MSTR \$400P
* 🎯 **Strategy:** Long Weekly Put
* 🔻 **Strike:** 400.00
* 📆 **Expiry:** Aug 1, 2025
* 💸 **Entry Price:** \$8.65
* ✅ **Profit Target:** \$12.50
* 🛑 **Stop Loss:** \$4.00
* 📈 **Confidence Level:** 72% (backed by Claude model)
* 📉 **Breakdown Trigger:** Below \$405 confirms bearish flow
* ⚠️ **Invalidation:** Break above \$415 → exit early
---
### 📦 TRADE\_DETAILS (Backtest/Algo Ready JSON)
```json
{
"instrument": "MSTR",
"direction": "put",
"strike": 400.0,
"expiry": "2025-08-01",
"confidence": 0.72,
"profit_target": 12.50,
"stop_loss": 4.00,
"size": 1,
"entry_price": 8.65,
"entry_timing": "open",
"signal_publish_time": "2025-07-31 09:30:00 UTC-04:00"
}
```
---
### 🧠 TRADE INSIGHTS
* 🟥 4/5 models say **no trade** due to signal divergence
* 🧠 **Claude’s bearish thesis = cleanest directional setup**
* 🚨 Volume + RSI combo = downside confirmation
* 🧭 Watch key price reaction zones: **\$400–\$405 (support)** / **\$415 (resistance cap)**
---
**#MSTR #PutOptions #WeeklyTrade #BearishSetup #OptionsFlow #QuantTrading #ClaudeModel #MarketMomentum**

GE WEEKLY OPTIONS SETUP (2025-07-28)
### ⚙️ GE WEEKLY OPTIONS SETUP (2025-07-28)
**Mixed Signals, Bullish Flow – Can Calls Win This Tug-of-War?**
---
📊 **Momentum Breakdown:**
* **RSI:** Falling across models → ⚠️ *Momentum Weak*
* **Volume:** Weak 📉 = Low conviction from big players
* **Options Flow:** Call/Put ratio favors bulls 📈
* **Volatility (VIX):** Favorable for directional plays
🧠 Model Consensus:
> “Momentum weak, but bullish flow + low VIX = cautiously bullish.”
> Some models recommend **no trade**, others suggest **tight-risk long call**.
---
### ✅ WEEKLY SETUP AT A GLANCE
* 🔍 **Volume:** Weak (distribution risk)
* 📉 **Momentum:** RSI fading
* 💬 **Options Sentiment:** Bullish bias (calls > puts)
* ⚙️ **Volatility:** Favorable
**Overall Bias:** 🟡 *Moderate Bullish*
---
### 💥 TRADE IDEA: GE \$275C
* 🎯 **Strategy:** Long Weekly Call
* 🔵 **Strike:** 275.00
* 📆 **Expiry:** Aug 1, 2025
* 💸 **Entry:** \$1.10
* ✅ **Profit Target:** \$1.80
* 🛑 **Stop Loss:** \$0.55
* 📈 **Confidence Level:** 65%
* 🧮 **Risk Level:** Medium (momentum divergence = tread carefully)
* ⚠️ **Support Watch:** Monitor for drop below \$268–270 for potential exit.
---
### 📦 TRADE\_DETAILS (Algo/Backtest Ready JSON)
```json
{
"instrument": "GE",
"direction": "call",
"strike": 275.0,
"expiry": "2025-08-01",
"confidence": 0.65,
"profit_target": 1.80,
"stop_loss": 0.55,
"size": 1,
"entry_price": 1.10,
"entry_timing": "open",
"signal_publish_time": "2025-07-28 12:08:59 UTC-04:00"
}
```
---
### 📌 NOTES FOR TRADERS
* 🤖 Models split between *no trade* vs *tight-risk long*
* 🚨 **Momentum divergence** is real – don’t oversize
* 🧭 **Watch Friday theta decay** — manage exits accordingly
* 🔍 Chart check: Watch price action near \$275 and \$268
---
**#GE #OptionsTrading #WeeklyPlay #CallFlow #UnusualOptionsActivity #GEcalls #AITrading #RiskManagement**

Ethereum Eyes $8K After Bullish BreakoutEthereum (ETH) is setting up for a powerful move. After hitting a multi-month high last week, ETH pulled back into a higher-low formation—strengthening the newly established bullish trend.
Money flow is shifting: with recent crypto legislation, Ethereum is now benefiting even more than Bitcoin, marking a notable change in market dynamics.
📈 Technical Highlights:
✅ Short-term target: $4,800–$5,000 (new all-time highs)
✅ Long-term potential: $7,000–$8,000
🛡️ Key support: $2,800–$3,000 (bullish as long as this holds)
📣 Takeaway:
Ethereum’s trend is firmly bullish. As long as support holds, pullbacks could offer strong entry opportunities for both swing traders and long-term investors.
#Ethereum #ETHUSD #Crypto #Trading #TechnicalAnalysis #CryptoTrading #EthereumPrice #Altcoins #Bullish #Breakout

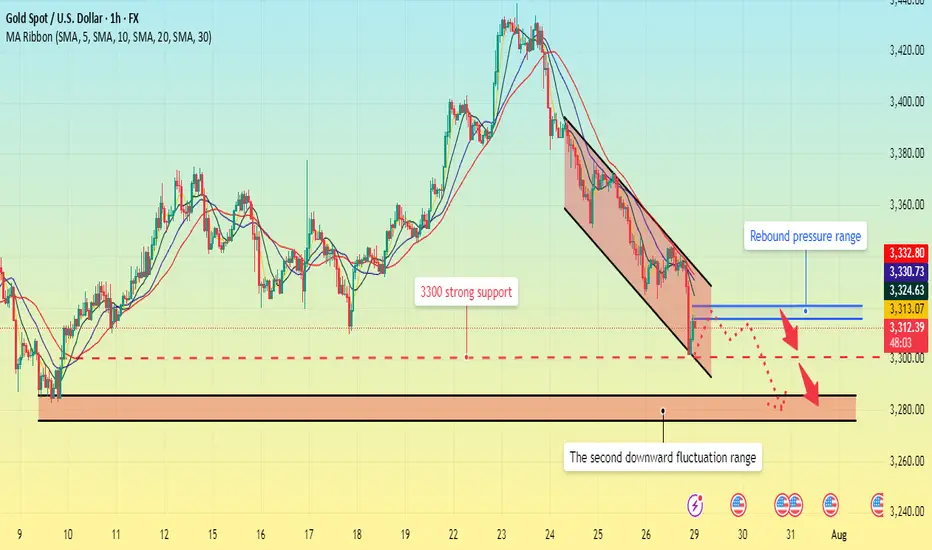
Gold fell below support. What will be the subsequent trend?The 1-hour moving average of gold continues to show a downward short position, indicating that the downward momentum is still sufficient; the wave pattern of gold's current decline remains intact, but the rebound strength is very weak, showing an obvious short trend of gold. Moreover, when gold rebounded in the short term, obvious resistance began to form above 3320, and the upward momentum was slightly insufficient.
From the daily chart, before 3300 fails to fall, it is likely to fluctuate around 3300-3350. On the contrary, if it falls below 3300, it is likely to reach the bottom of the 3385-3375 range.
This week is a super data week. The data of each day may affect the trend of gold on that day, but it will not form a unilateral strong trend. Therefore, the volatility before and after the data is released is likely to be large, so traders should focus on the following data:
1. US ADP employment report, US second quarter GDP preliminary value;
2. Federal Reserve interest rate decision;
3. US PCE annual rate, monthly rate;
4. The last trading day of this week will usher in non-agricultural data.
GOLD falls on USD and trade talks, big data weekSpot OANDA:XAUUSD ended its rally this week on Friday (July 25) and closed down nearly 1%, mainly affected by the recovery of the US Dollar TVC:DXY and progress in trade negotiations that weakened safe-haven demand.
DXY recovered 0.27% on Friday to close at 97.642, ending a two-week low, making gold less attractive than its direct correlation.
Earlier, news of a US-Japan trade deal and a breakthrough in US-EU talks weakened the market's demand for safe-haven assets.
For the content of the US-Japan trade deal, readers can review it in the daily publications during the past trading week.
Data and Fed Expectations
The latest US jobless claims fell to a three-month low, suggesting the job market remains solid. This gives the Federal Reserve reason to maintain interest rates at 4.25%-4.50%, despite President Trump once again pressuring Powell to cut rates.
However, in the short term, the fundamental direction of gold may need to wait for the Federal Reserve to announce more policy signals at its meeting next week.
Speculative Longs Hit High Near April Peak
Data from the U.S. Commodity Futures Trading Commission (CFTC) showed that as of the week of July 22, the speculative net long position in COMEX gold rose by 27,211 lots to 170,868 lots, the highest level since April. This shows that as gold prices fall again, buyers are still actively deploying, waiting for more guidance from policy and data.
Last Week Review and This Week’s Fundamental Outlook
Last week, gold prices initially rose and then fell. Due to risk aversion and volatility in the US dollar, gold prices surpassed the $3,400/ounce mark at the start of the week, but as trade optimism increased and profit-taking emerged, gold prices fell back, trying to stay above $3,300/ounce.
Investors will face several major events this week:
Federal Reserve policy meeting (Wednesday): Markets expect interest rates to remain unchanged, but Powell’s speech could influence market expectations for a rate cut this year.
Macro data will be released in batches: including ADP employment data on Wednesday, PCE price index on Thursday and non-farm payrolls report on Friday. These data will determine the next move of gold.
Global central bank trends: The Bank of Canada and the Bank of Japan also hold policy meetings next week. Investors will be watching to see if their policy signals cause volatility in the US dollar and gold prices.
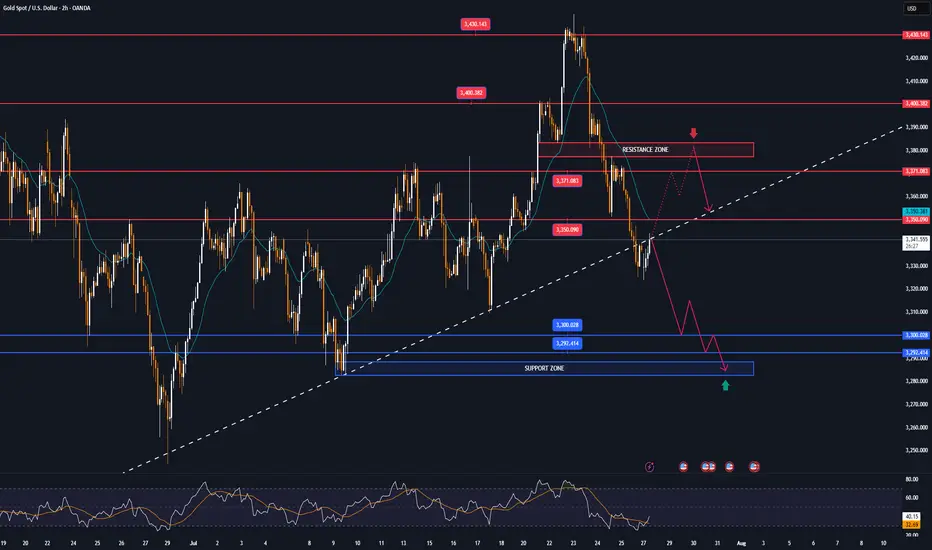
Technical Outlook Analysis OANDA:XAUUSD
On the daily chart, gold is in a rather important position after 3 consecutive corrective declines. However, the bearish momentum still keeps gold above the base price, which is an important psychological point for the bullish expectation of 3,300 USD.
In terms of position and indicators, gold has not completely lost the ability for a bullish outlook. Specifically, gold is still in a short-term rising channel and supported by the EMA21. On the other hand, it is still supported by the horizontal support level of 3,310 USD, followed by the psychological level of 3,300 USD and the 0.382% Fibonacci retracement.
Gold will only qualify for a bearish cycle if it sells below the 0.382% Fibonacci retracement level, then the target will be around 3,246 USD in the short term, more than the 0.50% Fibonacci level.
RSI is sloping down, but has not yet crossed the 50 level, and in the current case, the 50 level acts as a momentum support for the RSI. It shows that there is still room for an increase in price, and if RSI sloping up from 50, it will provide a bullish signal with relatively wide room.
If gold rises above the 0.236% Fibonacci retracement level (3,371 USD), it will be eligible for a new bullish cycle with a target of around 3,400 USD in the short term, more than 3,430 – 3,450 USD then the all-time high.
In the coming time, in terms of position and indicators, gold still has a technical outlook leaning more towards the upside and the notable points will be listed as follows.
Support: 3,310 – 3,300 – 3,292 USD
Resistance: 3,350 – 3,371 – 3,400 – 3,430 USD
SELL XAUUSD PRICE 3371 - 3369⚡️
↠↠ Stop Loss 3375
→Take Profit 1 3363
↨
→Take Profit 2 3357
BUY XAUUSD PRICE 3303 - 3305⚡️
↠↠ Stop Loss 3299
→Take Profit 1 3311
↨
→Take Profit 2 3317
Shopify (SHOP) – Powering the Next Wave of Global E-CommerceCompany Snapshot:
Shopify NASDAQ:SHOP continues to dominate as a leading commerce infrastructure provider, backed by record merchant adoption, a recurring revenue engine, and cutting-edge AI integration that enhances merchant capabilities.
Key Catalysts:
AI-Powered Ecosystem 🤖
From automated content creation to smart marketing tools, Shopify’s AI advancements are boosting merchant efficiency and making the platform indispensable for sellers.
Global Expansion 🌍
Shopify is scaling aggressively in Europe, Latin America, and Asia-Pacific, with localized services improving merchant onboarding and consumer reach.
Fulfillment Firepower via Deliverr 🚚
The Deliverr acquisition supercharges Shopify’s logistics network, enabling fast, reliable delivery that improves merchant retention and directly competes with Amazon.
Sticky, Scalable Revenue 💸
Its subscription-based model ensures high predictability, while growth in merchants and services lifts average revenue per user (ARPU).
Investment Outlook:
Bullish Entry Zone: Above $105.00–$107.00
Upside Target: $170.00–$175.00, powered by AI leverage, global scale, and logistics innovation.
🚀 Shopify is emerging not just as a storefront builder, but as a global commerce operating system.
#Shopify #Ecommerce #AI #DigitalRetail #GlobalExpansion #Deliverr #Fulfillment #TechStocks #SHOP #AmazonRival #ARPU #SaaS #GrowthStock #MerchantEconomy

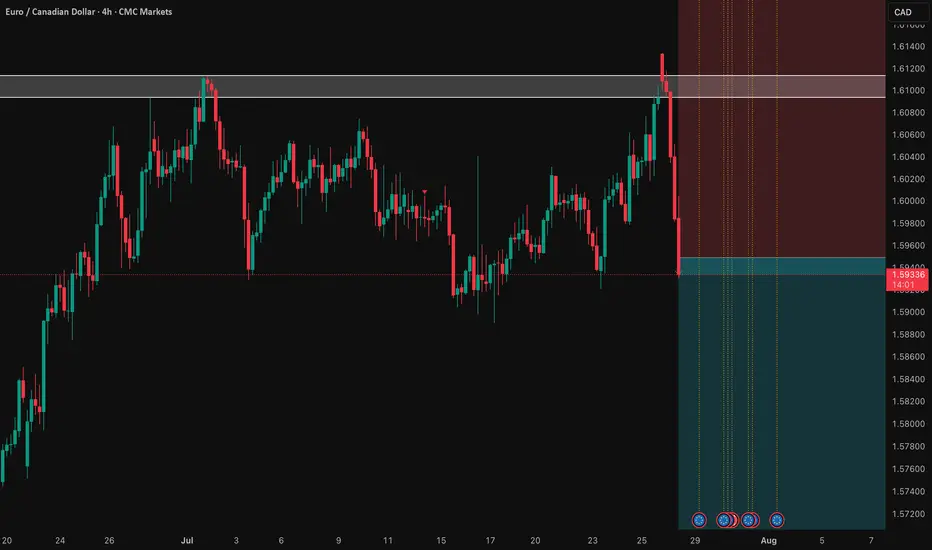
EUR/CAD: Shorting the Climactic Rally Near 1.6000The strong rally in EUR/CAD has pushed the pair into extreme territory, approaching a major psychological and structural resistance zone. While momentum has been strong, this looks like a potential climactic or "blow-off" top, offering a highly favorable risk/reward opportunity to short the pair in alignment with the weak underlying Euro fundamentals.
The Fundamental Why 📰
The core thesis remains bearish for the Euro. The European Central Bank (ECB) maintains a distinctly dovish tone, signaling a willingness to ease policy further to support a slowing Eurozone economy. This fundamental headwind suggests that extreme rallies in Euro pairs are often exhaustive and present prime shorting opportunities.
The Technical Picture 📊
Major Supply Zone: The price is entering a critical multi-month supply zone between 1.5950 and the key psychological level of 1.6000. This is a major ceiling where significant selling pressure is anticipated.
Fibonacci Extension: This area aligns with a key Fibonacci extension level (1.272) from the last major impulse wave, a common zone where trending moves become exhausted and reversals begin.
Pronounced RSI Divergence: A clear bearish divergence is forming on the daily chart. As price makes this final push to a new high, the Relative Strength Index (RSI) is making a significantly lower high, signaling a deep exhaustion of buying momentum.
The Counter-Trade Rationale 🧠
This is a high-level fade. We are positioning for a reversal at a major, technically significant ceiling. The extreme price extension, combined with clear momentum divergence, indicates that the risk of buying at these highs is substantial. By shorting here, we are betting that the powerful technical resistance and weak fundamentals will trigger a significant correction.
The Setup ✅
📉 Pair: EUR/CAD
👉 Direction: Short
⛔️ Stop Loss: 1.63230
🎯 Entry: 1.59490
✅ Take Profit: 1.52008
⚖️ Risk/Reward: ≈ 2:1
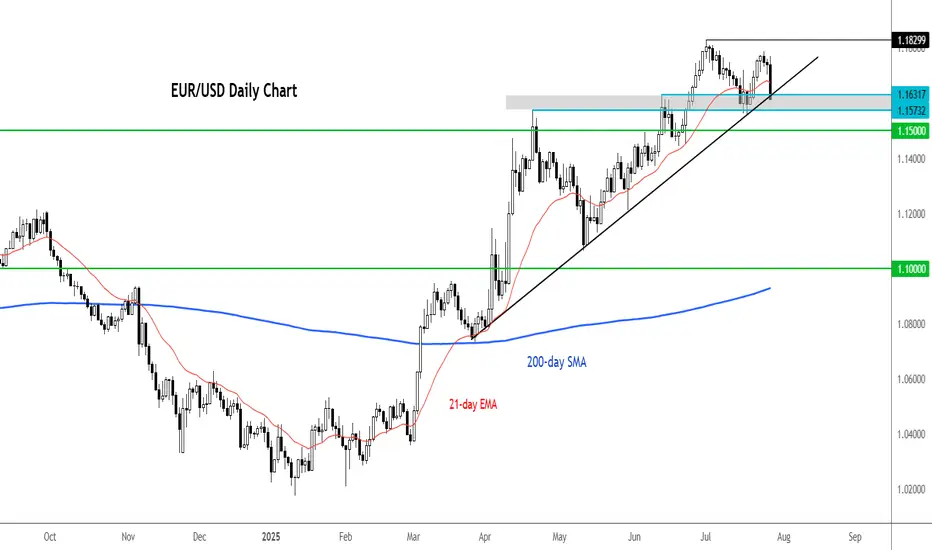
EUR/USD testing bull trend after 1% dropThere are multiple factors weighing on the EUR/USD today. We have seen a broad dollar rally, suggesting that the trade agreements are seen as net positive for the US economy, even it means rising inflation risks. With higher tariffs and Trump’s inflationary fiscal agenda, interest rates in the US are likely to remain elevated for longer.
As far as the euro itself is concerned, the single currency fell all major currencies, which suggests investors were not impressed by the EU’s negotiation tactics. Accepting a 15% tariff on most of its exports to the US while reducing levies on some American products to zero, means the deal will make companies in Europe less competitive. Still, it could have been a far worse situation had we seen a trade war similar to the US-China situation in April. It means that there is now some stability and businesses can get on with things. On balance, though, European leaders will feel that they may have compromised a little too much.
Technically, the EUR/USD is still not in a bearish trend despite today’s sizeable drop. But that could change if the bullish trend line breaks now. If that happens 1.15 could be the next stop. Resistance is now 1.1650 followed by 1.1700.
By Fawad Razaqzada, market analyst with FOREX.com
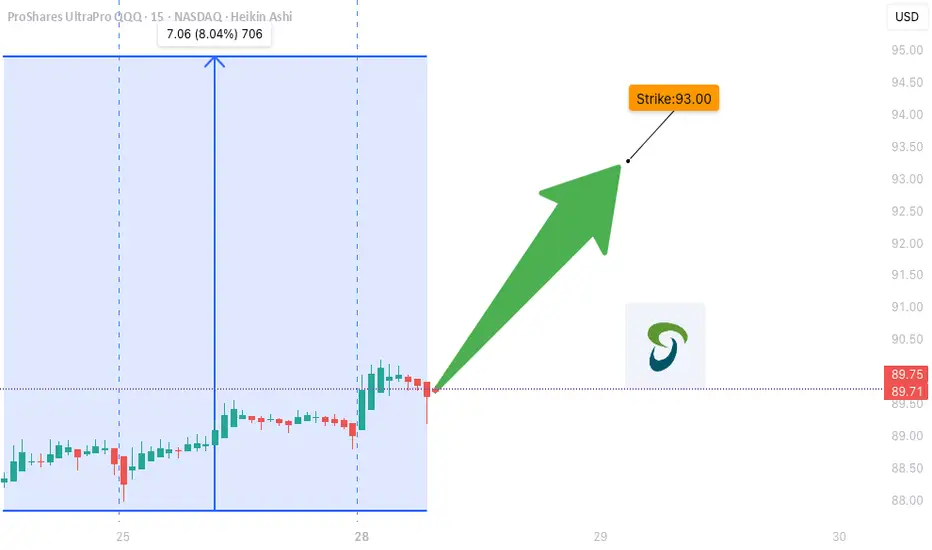
TQQQ WEEKLY TRADE IDEA (07/28/2025)
**🚀 TQQQ WEEKLY TRADE IDEA (07/28/2025) 🚀**
**Triple-Leveraged Momentum Play — But Watch the Volume Trap!**
---
📈 **Momentum Snapshot:**
* **Daily RSI:** 75.0 ⬆️
* **Weekly RSI:** 70.1 ⬆️
🔥 Bullish across **all timeframes** = strong trend confirmation
📊 **Options Flow:**
* **Call Volume:** 24,492
* **Put Volume:** 18,970
* **C/P Ratio:** **1.29** → Institutional bias = **Bullish**
📉 **Volume Concern:**
* Weekly volume = **0.8x** previous week
⚠️ Weak participation could limit breakout strength
🌪️ **Volatility Environment:**
* **VIX < 20** → ✅ Great for directional plays
---
🔍 **Model Consensus Recap:**
✅ All reports agree on bullish momentum
✅ Favorable volatility = cleaner setups
⚠️ Volume is the only red flag
📌 Final Take: **Bullish, but be tactical**
---
💥 **RECOMMENDED TRADE SETUP (Confidence: 75%)**
🎯 **Play:** Buy CALL Option
* **Strike:** \$93
* **Expiry:** Aug 1, 2025
* **Entry Price:** \~\$0.79
* **Profit Target:** \$1.58 (🟢 2x Gain)
* **Stop Loss:** \$0.39 (🔻 50% Risk)
📆 Entry Timing: Market Open
📏 Position Size: 2–4% of account
---
⚠️ **Key Risks to Watch:**
* 🔍 **Volume Trap**: Weak volume = fragile follow-through
* ⚡ **Gamma Risk** into expiry → price may swing quickly
* 📉 Avoid chasing — stick to setup, use stop-loss
---
📌 **JSON FORMAT TRADE DETAILS (Automation-Ready):**
```json
{
"instrument": "TQQQ",
"direction": "call",
"strike": 93.0,
"expiry": "2025-08-01",
"confidence": 0.75,
"profit_target": 1.58,
"stop_loss": 0.39,
"size": 1,
"entry_price": 0.79,
"entry_timing": "open",
"signal_publish_time": "2025-07-31 09:29:00 UTC-04:00"
}
```
---
**TL;DR:**
✅ RSI momentum = 🔥
📈 Call flow = ✅
⚠️ Volume = 🟡 Caution
🎯 \ NASDAQ:TQQQ breakout play for the bold
💬 Are you riding the 3x bull, or waiting for confirmation?
\#TQQQ #OptionsTrading #MomentumSetup #UnusualOptionsFlow #TradingView #TechStocks #QQQ #LeveragedETF
PLTR WEEKLY TRADE IDEA (07/28/2025)
**🚀 PLTR WEEKLY TRADE IDEA (07/28/2025) 🚀**
**Momentum is 🔥 but Volume is the Missing Ingredient**
---
📈 **Momentum Snapshot:**
* **Daily RSI:** 71.9 ⬆️ (🚨 Overbought but still rising)
* **Weekly RSI:** 76.7 ⬆️ (📢 Clear Bullish Strength)
➡️ *Strong upside pressure, but entering the overbought zone*
📉 **Volume Insight:**
* Weekly Volume = **0.8x last week**
⚠️ *Weak institutional conviction during the breakout = yellow flag*
🔍 **Options Flow Check:**
* **Call/Put Ratio:** 1.09 = *Neutral*
➡️ Balanced flow = *no aggressive buying yet*
🌪️ **Volatility Environment:**
* **VIX = 15.4**
✅ Favorable for directional trades — low IV supports premium growth
---
📊 **Model Consensus Recap:**
✅ Bullish RSI momentum (unanimous)
✅ Volatility ideal for long calls
⚠️ Volume flagged as a concern by some models
📌 Final stance: **MODERATE BULLISH**
---
💥 **RECOMMENDED TRADE SETUP (Confidence: 65%)**
🎯 **Play:** Buy CALL Option
* **Strike:** \$167.50
* **Expiry:** Aug 1, 2025
* **Entry Price:** \~\$0.74
* **Profit Target:** \$1.48 (🟢 2x return)
* **Stop Loss:** \$0.37 (🔻-50%)
📆 **Entry Timing:** Market Open Monday
📦 **Size:** 1 Contract
---
⚠️ **Key Risks to Watch:**
* 📉 Weak volume = possible consolidation before next leg up
* ⏳ Premium decay risk into expiry
* 📊 No strong institutional footprint = stay nimble
---
📌 **JSON FORMAT TRADE DETAILS (Automation Ready):**
```json
{
"instrument": "PLTR",
"direction": "call",
"strike": 167.50,
"expiry": "2025-08-01",
"confidence": 0.65,
"profit_target": 1.48,
"stop_loss": 0.37,
"size": 1,
"entry_price": 0.74,
"entry_timing": "open",
"signal_publish_time": "2025-07-28 10:13:40 EDT"
}
```
---
🔥 TL;DR:
* Momentum is undeniable ✅
* Volume = suspect 🟡
* VIX = Green light for directional play ✅
💬 **\ NASDAQ:PLTR Bulls, are you ready or waiting for volume confirmation?**
\#PLTR #OptionsTrading #BullishSetup #UnusualOptions #MomentumPlay #TradingView #StockMarket

SI1!: Silver Demand Zone: Possible Bullish ContinuationI am currently observing a potential long-term continuation on SI1! Silver (XAG/USD), as the Commitment of Traders (COT) data indicates an increase in positions from both commercial and non-commercial traders. The price is approaching a demand zone on the daily chart, suggesting a possible bullish move.
The recent price action originated from an initial spike in the monthly supply zone, but there’s a possibility that the price could continue to rise further before reaching the next supply zone where a reversal might occur. Given the daily timeframe, I view this setup as suitable for a scalp trade. In my opinion, this presents an opportunity for short-term traders to capitalize on the potential upward movement.
✅ Please share your thoughts about SI1! in the comments section below and HIT LIKE if you appreciate my analysis. Don't forget to FOLLOW ME; you will help us a lot with this small contribution.

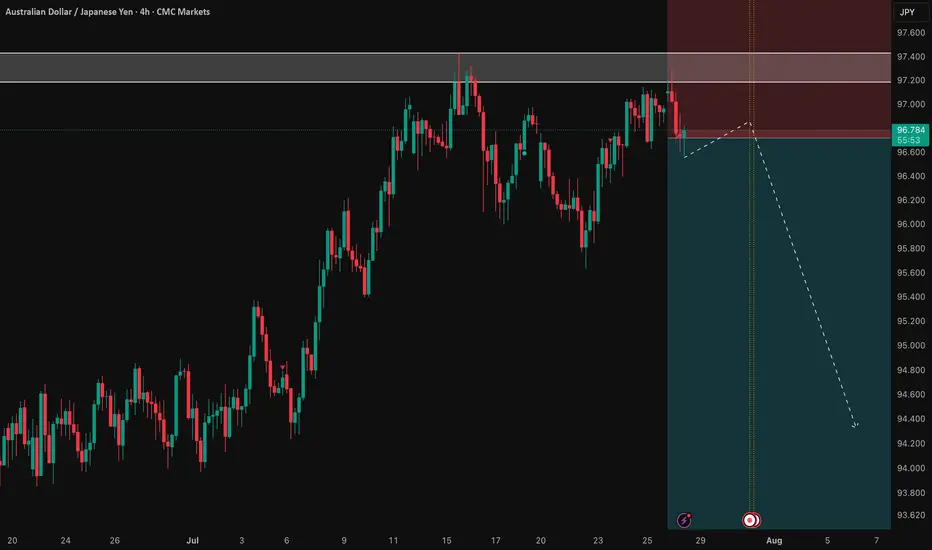
AUD/JPY: Fading the Rally at a Major Resistance ZoneWhile AUD/JPY has been in a clear uptrend, the rally is now approaching a significant technical ceiling where sellers have previously stepped in. We see a compelling opportunity for a counter-trend short, betting that this resistance level will hold and that the current bullish momentum is showing signs of exhaustion.
This trade is for those watching for a market turn, offering a well-defined risk-to-reward setup for a swing position.
🤔 The "Why" Behind the Short Setup
📰 The Fundamental Risk
The Australian Dollar is a "risk-on" currency, meaning it performs well when global markets are optimistic. The Japanese Yen, however, is a classic "safe-haven" asset that strengthens during times of uncertainty. With the upcoming high-impact Australian CPI data, any sign of economic weakness could disappoint the market, increase pressure on the RBA, and trigger a "risk-off" move that would benefit the Yen and send AUD/JPY lower.
📊 The Technical Ceiling
The chart tells a clear story. The price is currently testing a major resistance zone. Attempting to short near a strong ceiling like this provides a strategic entry to capture a potential trend reversal. We are essentially betting that the trend's multi-week momentum will stall and reverse from this key technical juncture.
✅ The High-Clarity SHORT Trade Setup
📉 Pair: AUD/JPY
👉 Direction: Short
⛔️ Entry: 96.716
🎯 Take Profit: 92.080
🛑 Stop Loss: 98.907
Rationale: This setup plays for a significant swing move. The wide stop loss is designed to withstand volatility from news events, while the deep take profit targets a full reversal back to major support levels seen earlier in the year.
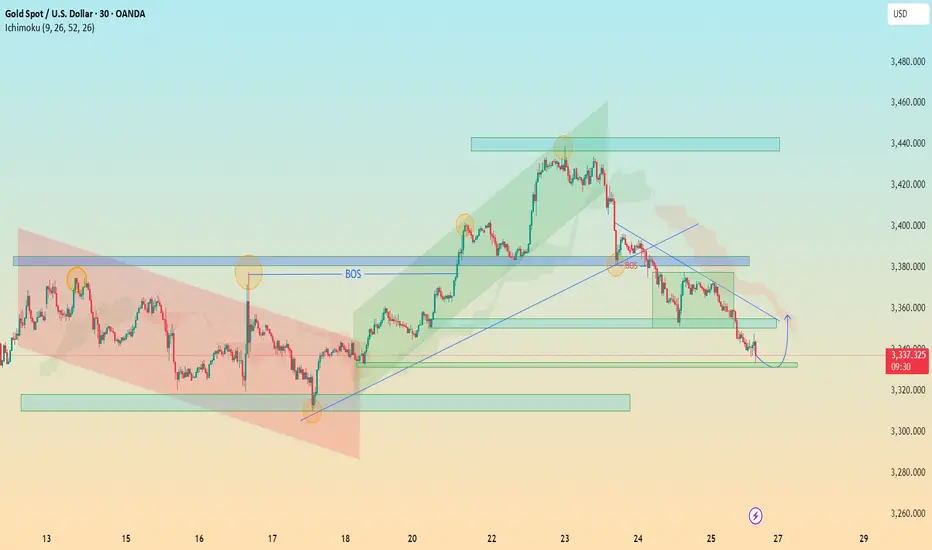
"XAU/USD Hits Major Demand – Is a Relief Rally Brewing?"🟡 XAU/USD (Gold) – Demand Zone Rejection in Play | Bullish Correction Ahead?
Timeframe: 30-Minute | Date: July 25, 2025
Created by: AllyPipsExpert
Indicators: Ichimoku Cloud, BOS (Break of Structure), Dynamic S/R, Trendlines
---
🔍 Technical Analysis & Key Insights:
🔸 1. Market Recap – Distribution & Downtrend Confirmation:
After the Break of Structure (BOS) near 3385, gold confirmed a bearish reversal following the distribution phase at the top resistance zone around 3445–3460.
Bearish momentum was sustained by a descending trendline, paired with a bearish Kumo (Ichimoku cloud) crossover.
🔸 2. Major Zone Tagged – Key Demand Area Tested:
Price has now reached the critical demand block at 3320–3340, a zone that previously initiated bullish impulse on July 18–19.
The current bullish projection (in blue) reflects potential short-term recovery or correction phase, following oversold conditions and historical support strength.
🔸 3. Bullish Reversal Potential – Short-Term Retracement?
The blue arrow reflects a likely bullish retracement toward 3360–3380, aligning with trendline retest and potential Kumo rejection.
Expect sellers to re-enter if price retests former BOS/imbalance zone, creating scalp or swing sell setups on confirmation.
---
🔧 Confluences & Technical Highlights:
Confluence Point Description
Demand Zone Strong previous accumulation at 3320–3340
BOS Retest Area Key liquidity level now acting as resistance
Ichimoku Cloud Price below cloud = bearish bias maintained
Descending Trendline Reinforces bearish structure unless broken
Price Action Rejection wick at demand + potential short squeeze
---
🎯 Trade Outlook:
🧭 Bias: Short-Term Bullish Rebound → Long-Term Bearish Continuation
🟩 Support: 3320 – 3340
🟥 Resistance: 3360 – 3385 (BOS & Trendline zone)
🔁 Scenario: Bounce → Retest → Continuation lower (unless breakout confirmed)
---
📘 Why This Chart Could Be Featured:
✅ Multi-layered Analysis: BOS, zones, cloud, price action, and psychological zones used together.
✅ Forward-Looking: Projects the next logical market reaction instead of just explaining the past.
✅ Clean, Structured, Educational: Layout and visuals guide the viewer through logical trade steps.
✅ Value-Packed: Provides actionable levels and flexible scenarios — helpful to traders of all levels.
Very important Economic Calendar 28.07–01.08: FOMC, BTC, tariffsThis Week (July 28 – August 1) — the final week of the month is packed with key events.
Save this post and forward it to 3 friends 😉
📋 High volatility ahead — as the Fed’s key "threelemma" (inflation, labor market, tariffs) comes into focus.
Several important macro releases are scheduled — each one matters on its own, but combined, they can move markets sharply.
🗓 Monday (July 28)
▪️ 12:30 UTC – QRA (Part 1): upcoming US Treasury borrowing needs
▪️ 16:00 UTC – 2Y & 5Y bond auctions – key indicator of market expectations ahead of FOMC
🔗 Strong demand = stronger rate cut expectations
🗓 Tuesday (July 29)
▪️ 12:30 UTC – US GDP (Q2 estimate)
▪️ 16:00 UTC – 7Y bond auction
🗓 Wednesday (July 30)
▪️ 12:15 UTC – ADP employment report – early signal ahead of NFP
▪️ 12:30 UTC – QRA (Part 2): breakdown of Treasury borrowing
▪️ 18:00 UTC – FOMC rate decision (no change expected – 4.5%) + Powell’s press conference
🗓 Thursday (July 31)
▪️ 12:30 UTC – PCE inflation (June) – Fed’s favorite inflation gauge
🗓 Friday (August 1)
▪️ 12:30 UTC – Nonfarm Payrolls (employment)
▪️ 13:00 UTC – ISM Manufacturing Index (July)
▪️ 13:00 UTC – Univ. of Michigan Consumer Sentiment Index
▪️ All day – July auto sales data
🚨 LIBERATION DAY 2.0
Potentially the most impactful event of the week: the Trump administration will begin sending “tariff letters” to ~200 countries.
This marks the end of the temporary tariff relief (April 8 – August 1).
Markets expect a new wave of global trade tension — timing is still uncertain.
💡 Summary:
Every day brings a new potential driver.
Markets are nervous and highly reactive — sharp moves are likely...
CRYPTOCAP:BTC is currently being held above $117K, but Wednesday and Friday bring high risk of "news bombs".
